インドフェノール滴定法,インドフェノール・キモレン法およびヒドラジン法による生馬鈴薯のビタミンC含量の評価
8
0
0
全文
(2) • 24 ^ H l -^ UMBW^Na^ (^ II ^ C) RS^B 48 ^ 10 ^. Estimation of Vitamin C Content in Raw Potatoes by Ind-Titrn, Ind-Xylene, and Hydrazine Method. Saburow KITAGAWA and Noriko WATABE Laboratory of Nutrition, Asahikawa Branch, Hokkaido University of Education. ;}un^?, ^??-: ^ '^ p'7 ^ / -/^$E& ^ yp'7^/ -^- ^. -^ ^ ^^ J; ^ ^ K 7 ^ ^<? ^ ^^feM^^^ ^ ^ ^' v c -t^-AotW. Customarily, we put potatoes to a good use in school meals, so that it is necessary to evaluate the real vitamin C value to determine the ascorbic acid (AsA) content in raw potatoes. Methods for the determination of AsA have been proposed for avoiding interference from other non-AsA. In fresh vegetables, especially in potatoes, the determination value for AsA is affected by the presence of various compounds, like plant pigments as flavones, reductones and so on.. Oxidation of AsA by 2, 6-dichlorophenolindophenol is found available for determining AsA. However, this method is not applicable for the analysis of products containing water- or acidsoluble pigments or reducing agents for AsA. These non-AsA react with the dye and influence the end point of titration. In many more pigment-containing, or turbid acid, extracts, this method is not entirely satisfactory for measuring the degree of reduction of the dye. Then it becomes possible to use a xylene extraction, eliminating interference from acid soluble pigments, because of the readily soluble in xylene. The most widely used method for the determination of the total vitamin C is based upon Roe's procedure. Among the number of methods available, the oxidation-reducing and Roe's methods are widely used as analytical procedures in the measurement of vitamin C. Potatoes are not rich in AsA, but we take so many potatoes that often provide a considerable proportion of AsA in the diet of school meals. However, their AsA contents are not held constant for the same species. The AsA level of raw potatoes from 4 to 50 mg/100 g is generally given in the literatures. A AsA level of 30 mg or over can only be found in fresh potatoes, whereas a level of 15 mg is given for them from Japanese Food Composition Tables0. In this experiment, the contents of AsA in raw potatoes were investigated by the following methods ; 2, 6-dichlorophenolmdophenol visual titration method, Indophenol-xylene extract photometric method, and 2, 4-dinitrophenylhydrazine method. The AsA values of them are considered from the estimation of the applicable vitamin C level by comparison with the values of these methods.. ( 15).
(3) Vol. 24, No. 1 Journal of Hokkaido University of Education (Section II C) October 1973. Materials and Methods The species, white potatoes, " Danshaku " ; Hokkaido-grown potatoes at Kamikawa. After raw potatoes are cut and chopped, samples are treated very rapidly and blended with metaphosphoric acid as quickly as possible, preventing further oxidation of AsA. The samples are separated into three parts. The part containing the peels is referred to as the whole ; the part of peeled potatoes, the edible ; and the part of only peeled chops, the peel. The peels of potatoes are removed by the paring-knife and are cut into thin slices. The three parts are respectively used for determining their AsA by the following methods. The 2, 6-dichlorophenolindophenol visual titration method (Ind-Titron method) : this method is based upon the procedure of the Vitamin Assay by the Association of Vitamin Chemists25. The Indophenol-xylene extraction method (Ind-Xylene method) : this method follows the same procedure as the photometric assay25.. The 2, 4-dinitrophenylhydrazine method (Hyd-method) : this method is an adaptation of the method described by Roe; it follows the same procedure25. The instrument used for these methods is the photoelectric spectrophotometer, Shimazu IVIodel QV-50.. Results Calibration constant K for ascorbic acid by two methods Ind-Xylene method The preparation of the calibration chart for AsA followed the same procedure of the Vitamin Assay25. The instrument was set at 100^ transmittance with distilled water, the transmittance readings were converted to optical density at 500 mu. Table 1 shows the determination of the instrument constant K for the standard AsA solution in each concentration. Our average K values are usually kept constant linearly, but are variable in lower concentration. It seems to be stable in the range of about 0.020 mg per m/ to 0.030 mg per ml for determining. TABLE 1 Calibration constant K for ascorbic acid by Ind-Xylene method Optical dencity. Trial. Ascorbic acid mg per m/. No.. 1 2 3 4 5 6 7 8 9 10 Av.. K*. 0.004. 0.006. 0.008. 0.010. 0.015. 0,020. 0.025. 0.030. 0.260. 0.273. 0.296. 0.303. 0.310. 0.313. 0.331. 0.378. 0.351. 0.385. 0.333. 0.313. 0.323. 0.317. 0.347. 0.393. 0.196. 0.273. 0.296. 0.303. 0.316. 0.323. 0.336. 0.370. 0.278. 0.316. 0.313. 0.325. 0.395. 0.351. 0.375. 0.395. 0.339. 0.316. 0.204. 0.244. 0.238. 0.313. 0.304. 0.333. 0.340. 0.410. 0.370. 0.373. 0.308. 0.313. 0.346. 0.337. 0.341. 0.378. 0.270. 0.289. 0.300. 0.307. 0.342. 0.387. 0.300. 0.297. 0.292. 0.338. 0.314. 0.342. 0.385. 0.267. 0.254. 0.270. 0.289. 0.310. 0.314. 0.331. 0.390. 0.225. 0.280. 0.272. 0.288. 0.305. 0.302. 0.331. 0.378. 0.271. 0.302. 0.298. 0.304. 0.326. 0.321. 0.340. 0.383. 1.476. 1.987. 2.685. 3.289. 4.601. 6.231. 7.353. 7.833. 0.308. means extinction coefficient.. U6).
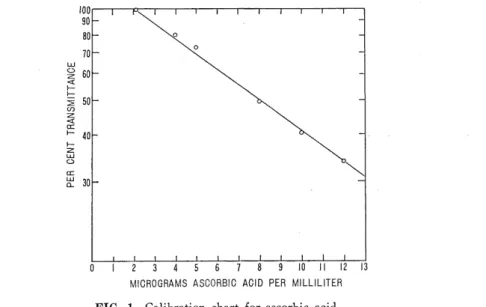
(4) '24:. 1-^-. r^CT (it ii ^ c). TO 48 ^ 10 J^. AsA. The dye solution must be checked with a definite concentration of the standard AsA solution in each assay. Hyd-method The preparation of the caloutbration chart followed the same procedure of the Vitamin Assay25. As shown in fig. 1, the calibration chart for AsAwas prepared by plotting per cent transmittance as ordinate and concentration of AsA (mg per rcJ) as abscissa on semilogarithmic paper. The plot of transmittance % against AsA mcg per rrJ was found to be linear. The optimal concentrations for determining AsA are given in a range from 4 mcg per rs\l to 12 mcg per m/ according to the calibration curve for the standard AsA solution.. I 23456 7 8 9101112 MICROGRAMS ASCORBIC ACID PER MILLILITER FIG. 1 Calibration chart for ascorbic acid Ascorbic acid content of raw potatoes by Ind-Xylene method The stability of the color in the xylene layer should be checked by preparing the total dye tubes at the beginning and at the end of a series treatment is appied to correct the action of the non-AsA reducing materials present. This. of samples. In this method, the peroxide TABLE 2 Ascorbic acid content of whole part in raw potatoes by Ind-. Xylene method. procedure by peroxide is described as treat-A. The formaldehyde treatment is also applied to correct a similar action. This procedure is also described as treat-B. Under our experi-. mental conditions, these treatments were not necessary for our samples, but they were carried out in each assay to investigate the liable variation of the AsA values due to these correction treatments.. The AsA contents of each part in raw potatoes are shown in tables 2, 3 and 4 respectively. Data in these tables are summarized in the following table and involve a comparison of AsA values with the three parts in regard. U7). Trial No.. Ascorbic acid mg per. 100 g Treat-B. Non-Treat. Treat-A. 1 2 3 4 5. 20.55. 20.12. 17.48. 20.25. 19.80. 17.48. 20.38. 19.04. 16.06. 19.62. 19.60. 16.64. 19.00. 18.98. 16.82. 6 7 8 9 10. 20.78. 20.38. 18.31. 19.97. 18.87. 16.05. 20.25. 19.24. 16.25. Av.. 19.94. 1997. 16.72. 19.30. 18.94. 16.29. 20.00. 19.50. 16.85.
(5) October 1973. Journal of Hokkaido University of Education (Section II C). Vol. 24, No. 1 to these treatments.. TABLE 3 Ascorbic acid content of edible part. TABLE 4 Ascorbic acid content of peel part in. in raw potatoes by Ind-Xylene method. raw potatoes by Ind-Xylene method. Trial No.. Ascorbic acid mg per 100 g. 1 2 3 4 5 6 7 8 9 10. 18.73. 18.09. 14.56. 18.90. 18.67. 14.66. 18.87. 19.42. 14.38. 19.08. 18.56. 15.31. 19.02. 19.48. 19.90. 18.93. 19.15. 15.76. 18.50. 18.42. 14.82. 18.94. 18.57. 14.48. 18.78. 18.42. 15.13. 18.86. T8.25. 14.90. Av.. 18.86. 18.70. 14.89. Ascorbic acid mg per 100 g. Trial. Non-Treat Treat-A Treat-B. No.. Non-Treat Treat-A Treat-B. 1 2 3 4 5 6 7. 3.34. 3.06. 1.24. 3.18. 2.66. 1.38. 3.52. 3.11. 1.17. 3.00. 3.03. 0.55. 3.73. 2.85. 1.16. 3.18. 2.69. 1.27. 2.98. 2.77. 1.22. Av.. 3.28. 2.87. 1.29. Average AsA contents of each part in raw potatoes. by treatments in Ind-Xylene method Parts of AsA mg per 100 g potatoes Non-Treat Treat-A Treat-B. Whole. Edible. Peel. 20.00. 19.50. 16.85. 18.86. 18.70. 14.89. 3.28. 2.87. 1.29. The AsA content of any part with the non-treat gives a relatively higher level compared with the treatments. These correction treatments in the AsA assay trend to show a slight decrease on the non-treat level. It is noteworthy that the value of the peel part indicates significant quantities on its AsA level. It also seems that this level depends on the influence of non-AsA reducing materials, especially on some plant pigments in the peel of raw potatoes. This point is the task of the next study if the considerable AsA level in the peel is a true vitamin C in raw potatoes. The results in table 5 show the AsA values in each part of raw potatoes and their mean errors by these treatments. The variation of the values is found to be great from the values by the treat-B in each part. There is so considerable doubt as to whether the variation is due to samples or to these treatments.. TABLE 5 The standard deviation of the levels of ascorbic acid in raw potatoes reig per 100 g Ascorbic acid mg. Rart of Raw. Potatoes. Whole. 22.16 20.00. Edible. 19.69 18.86. Peel. Treat-A. Non-Treat. 3.28. ± ± ±. ± ±. 0.14. 21.59. 019. 19.50. 0.06. 19.21. 0.04. 18.70. 0.07. 2.87. (25). ± ±. Treat-B. 0.06. 19.78. 0.12. 16.85. 0.12. ±. 13.45. 0.10. 14.89. ±. 0.05. 1.29. ±. ± ± ± ± ±. 0.20 0.17 0.17 0.09 0.08.
(6) October 1973. Journal of Hokkaido University of Education (Section II C). Vol. 24, No. 1. Ascorbic acid content of raw potatoes by Hydrazine method The AsA content of raw potatoes was determined by the Hyd-method under the same conditions of the Ind-Xylene method. The procedure of the assay was described above. As shown in fig. 1 and table 6, the stability of the calibration curve in the Hyd-method was in a marked contrast to the unstable liability of the calibration in the Ind-Xylene method. As shown in tables 7, 8 and 9, the AsA contents of each part of raw potatoes are obtained from the same sample at two dilutions ; 10 m/-,and 5 mZ-diln. The AsA values at 10 mZ-diln. were higher than those at 5 m/-diln. from the assay of each part, especially in the case of the whole part. The AsA values obtained from the assay of one sample at two dilns did not appreciably agree even with any part of raw potatoes. The same interferences are indicated from substances other than AsA. The AsA values of the peel by this method showed a considerable higher level than those by the Ind-Xylene method. TABLE 7 Ascorbic acid content of edible part. TABLE 6 Calibration of spectrophotometer for ascorbic acid by Hyd-method. in raw potatoes by Hyd-method. Transmittance % for Ascorbic £ icid No.. 1 2 3 4 5 6 7 8 9 10 Av.. 2. 4. 105 105 105 105 101 105 103 102 101 105 104. (mJ per cgm). Trial. 5 8. 10. 12. 89.0. 80.0 67.0. 57.0. 44.0. 90.5. 84.0 68.0. 57.0. 44.0. 91.0. 83.0 67.5. 56.5. 44.0. 90.0. 83.0 64.0. 58.0. 44.0. 88.0. 84.5 66.0. 56.0. 45.0. 87.0. 82.0 66.0. 55.0. 45.0. 90.0. 84.5 67.0. 56.0. 45.0. 87.0. 80.0 67 0. 54.0. 43.5. 87.0. 79.0 58.0. 54.0. 42.0. 88.5. 82.0 61.0. 51.5. 45.0. 88.8. 82.2 60.1. 55.4. 44.2. No.. '0. mg%. '0. mg%. mg%. 1 2 3 4 5. 54.0. 14.8. 76.0. 8.8. 53.0. 15.0. 78.5. 8.2. 11.6. 56.5. 13.8. 72.0. 9.8. 11.8. 55.5. 14.4. 75.0. 9.0. 11.7. 52.0. 15.4. 78.0. 8.2. 11.8. 6 7 8 9 10. 57.8. 13.6. 70.0. 10.2. 11.9. 58.5. 13.0. 69.0. 10.4. 11.7. 58.0. 13.4. 69.0. 10.4. 11.9. 57.0. 13.8. 71.0. 10.0. 11.9. 57.8. 13.6. 70.0. 10.2. 11.9. Av.. 56.0. 14.1. 72.9. 9.5. 11.8. *. TABLE 8. Ascorbic acid content of edible part 5 m^-dilut Average 10 m/.dilut AsA AsA °x* °/. * AsA, 11.8. means per cent transmittance. Ascorbic acid content of whole part in raw potatoes by Hyd-method. Trial. 10 m/.dilut ;, 0/» yo. 1 2 3 4 5. TABLE 9. Ascorbic acid content of whole part AsA^ 0. mg 7o. 5 mZ-dilut Average AsA AsA T %* o, 0, mg^o mg_^_. 48.0. 16.8. 70.0. 10.2. 13.5. 49.2. 16.6. 71.0. 9.8. 13.2. 48.8. 16.4. 70.0. 10.2. 13.3. 49.0. 16.6. 70.0. 10.2. 13.4. 48.0. 16.8. 69.0. 10.4. 13.6. 48.0. 16.8. 70.0. 10.2. 13.5. 48.0. 16.8. 70.0. 10.2. 13.5. 48.0. 16.8. 70.0. 10.2. 13.5. Ascorbic acid content of peel part in raw potatoes by. Trial No.. 1 2 3 4 5. 6 7 8 9 10. 48.2. 16.8. 71.2. 10.0. 13.4. 49.0. 16.6. 69.2. 10.4. 13.4. 6 7 8. Av.. 48.0. 16.8. 70.0. 10.2. 13.4. Av.. means per cent transmittance. part Ascorbic acid content: of peel part 5 m/-dilut 10 m/.dilut Average AsA AsA it AsA 0/sfs o/* ~/0~. mg%. 70. 79.0. 8.2. 86.0. 88.0. 8.0. 78.5. mg%. 6.6. 7.4. 82.0. 7.6. 7.8. 8.2. 82.0. 7.6. 7.9. 79.0. 8.2. 82.5. 7.2. 7.7. 77.0. 8.6. 82.0. 7.6. 8.1. 76.0. 8.8. 82.5. 7.2. 8.0. 81.0. 7.8. 83.5. 7.2. 7.5. 79.0. 8.2. 81.5. 7.6. 7.9. 78.7. 8.3. 82.8. 7.3. 7.8. means per cent transmittance. (29). mg%.
(7) TO 48^10^. (^ II ^ C). •l^. •24:. Comparison of ascorbic acid contents in raw potatoes by Ind-Titrn, Ind-Xylene and Hydrazine methods The AsA contents of each part in raw potatoes were respectively determined by the IndTitrn, Ind-Xylene, and Hyd-methods for the same samples. The AsA values in tables. TABLE 10 Comparison of ascorbc acid contents of edible part in raw potatoes by Ind-. 10, 11 and 12 show the comparison between. titrn, Ind-Xylene and Hyd-method. each part of raw potatoes by these three. Trial. methods. As shown in tables 10 and 11,. No.. the AsA values of both parts, except the peel are given on similar levels by these methods. The AsA values of the peel, as shown in table 12, show a remarkably higher level only by the Hyd-method. It must be. investigated further whether this high level involves the AsA content, and to what extent the true vitamin C exists in the peel of raw potatoes.. TABLE 11 Comparison of ascorbc acid contents. Trial No.. 1 2 3 4 5 6 7 8 Av.. AsA content of of edible part Ind-Titrn. mg %. Ind-Xylene. Hyd. 1 2 3 4 5 6 7 8 9. 15.70. 16.29. 16.00. 15.70. 16.65. 16.40. 15.70. 16.29. 16.00. 15.70. 15.83. 16.00. 15.70. 16.20. 16.00. 16.65. 16.00. Av.. 15.70. 15.38. 16.60. 15.74. 16.40. 16.11 16.12. 16.20. TABLE 12 Comparison of ascorbc acid contents. of whole part in raw potatoes by Ind-. of peel part in raw potatoes by Ind-. titrn, Ind-Xylene and Hyd-method. titrn, Ind-Xylene and Hyd-method. AsA content of of whole part. mg %. Ind-Titrn. Ind-Xylene. Hyd. 17.0. 19.0. 18.0. 17.0. 18.7. 17.0. 17.0. 18.5. 18.6. 17.0. 18.0. 17.0. 17.0. 18.9. 16.6. 18.0. 17.4. 18.1. 17.4. 18.1. 18.4. 17.0. Trial No.. AsA content of peel part mg Ind-Xylene. Ind-Titrn. %. Hyd. 3.1. 2.9. 12.2. 3.1. 3.9. 13.2. 3.1. 3.0. 11.6. 3.1. 3.9. 11.4. 3.1. 4.6. 12.8. 3.5. 12.4. 4.1. 11.6. 17.0. 1 2 3 4 5 6 7 8. 6.9. 11.8. 17.4. Av.. 3.1. 4.1. 12.1. Discussion As pointed out by Akiji Fujita, et al.s'), the AsA values by the Hyd-method for foods have been given at a rather higher level than those of the Japanese Food Composition Tables0. Their report indicate that many foodstuffs for animal and vegetable origins show remarkable AsA values by the Hyd-method, but the TLC values were neglible. According to the report by R. Zacharias, et al.n, the AsA values by 10 analytical methods were discussed more fully for determining AsA in raw potatoes. They suggested that variable AsA values were obtained by comparing the direct assay with the indirect assay of the thinlayer chromatographic procedure. Their reports suggest that many alternative methods or many techniques of separation and purification give rise to some loss of AsA through long or tedious. {20).
(8) Vol. 24, No. 1 Journal of Hokkaido University of Education (Section II C) October 1973 procedures. In spite of the development of newer techniques some reports point out that it is very difficult to determine the existence of the true vitamin C in raw potatoes. The AsA values in raw potatoes are apt to variate through many alternative methods. However, it seems that the AsA values assayed by the Ind-Titrn method, out of many alternative methods, are considered to be the real vitamin C content of raw potatoes.. Summary A practical application of the general routine methods ; 2,6-dichlorophenolindophenol visual titration method, Indophenol-Xylene extract photomatric method, and 2, 4-dinitrophenylhydrazine method were investigated for the determination of the AsA content in raw potatoes. The whole and the edible parts of raw potatoes showed a similar AsA value by these three methods, except the peel part by the Hydrazine method. This study includes the investigation of possible variations of the AsA values of raw potatoes by the main routine method. The AsA values are liable to vary with the troublesome procedures of the alternative methods. Considering many conditions, the 2, 6-dichlorophenolindophenol visual titration method seems to reveal the real vitamin C content for AsA determination in raw potatoes.. References. 1) Ed. by the Resources Council, the Japanese Scientific and Technical Administration; the Japanese Food Composition Tables, p. 22 (1963). 2) Myer, F. Methods of Vitamin Assay, ed. by the Association of Vitamin Chemists, Inc., 287-340 (1966). 3) Fujita, Akiji, Fukuko Hirose and Yoshiko Uchiyama, Vitamin Japan 40, 1, 17-26 (1969). 4) Zacharias, R., U. Imhoff, R. Stroehecker jr. und M. Zobel, Zeitschrift fiir Lebensmittel -Untersuchung. und -Forschung, 138, 65-74 (1968).. (21).
(9)
図


+2

関連したドキュメント
In order to compute the Taylor tower of Hochschild homology it was natural to first consider the Taylor tower of the forgetful functor from simplicial commutative augmented
If condition (2) holds then no line intersects all the segments AB, BC, DE, EA (if such line exists then it also intersects the segment CD by condition (2) which is impossible due
W ang , Global bifurcation and exact multiplicity of positive solu- tions for a positone problem with cubic nonlinearity and their applications Trans.. H uang , Classification
2 Combining the lemma 5.4 with the main theorem of [SW1], we immediately obtain the following corollary.. Corollary 5.5 Let l > 3 be
It is suggested by our method that most of the quadratic algebras for all St¨ ackel equivalence classes of 3D second order quantum superintegrable systems on conformally flat
In particular, we consider a reverse Lee decomposition for the deformation gra- dient and we choose an appropriate state space in which one of the variables, characterizing the
As is well known (see [20, Corollary 3.4 and Section 4.2] for a geometric proof), the B¨ acklund transformation of the sine-Gordon equation, applied repeatedly, produces
Since the boundary integral equation is Fredholm, the solvability theorem follows from the uniqueness theorem, which is ensured for the Neumann problem in the case of the
