R E S E A R C H A R T I C L E
Open Access
Initiation of recombination suppression and
PAR formation during the early stages of
neo-sex chromosome differentiation in the
Okinawa spiny rat, Tokudaia muenninki
Chie Murata
1, Yoko Kuroki
2,3, Issei Imoto
1, Masaru Tsukahara
4, Naoto Ikejiri
4and Asato Kuroiwa
5*Abstract
Background: Sex chromosomes of extant eutherian species are too ancient to reveal the process that initiated sex-chromosome differentiation. By contrast, the neo-sex chromosomes generated by sex-autosome fusions of recent origin in Tokudaia muenninki are expected to be evolutionarily‘young’, and therefore provide a good model in which to elucidate the early phases of eutherian sex chromosome evolution. Here we describe the genomic evolution of T. muenninki in neo-sex chromosome differentiation.
Results: FISH mapping of a T. muenninki male, using 50 BAC clones as probes, revealed no chromosomal rearrangements between the neo-sex chromosomes. Substitution-direction analysis disclosed that sequence evolution toward GC-richness, which positively correlates with recombination activity, occurred in the peritelomeric regions, but not middle regions of the neo-sex chromosomes. In contrast, the sequence evolution toward AT-richness was observed in those pericentromeric regions. Furthermore, we showed genetic differentiation between the pericentromeric regions as well as an accelerated rate of evolution in the neo-Y region through the detection of male-specific substitutions by gene sequencing in multiple males and females, and each neo-sex–derived BAC sequencing.
Conclusions: Our results suggest that recombination has been suppressed in the pericentromeric region of neo-sex chromosomes without chromosome rearrangement, whereas high levels of recombination activity is limited in the peritelomeric region of almost undifferentiated neo-sex chromosomes. We conclude that PAR might have been formed on the peritelomeric region of sex chromosomes as an independent event from spread of recombination suppression during the early stages of sex chromosome differentiation.
Keywords: Sex chromosome, neo-X, neo-Y, Evolution, Pseudoautosomal region, Recombination suppression, Biased gene conversion, BAC, Next-generation DNA sequencing
Background
The eutherian Y chromosome was originally homologous to the X chromosome [1]. Since the acquisition of the sex-determining loci, however, the Y has progressively degenerated due to suppression of recombination with the X. In the early stages of sex-chromosome differenti-ation, it is suggested that interactions between sex-determining genes and sexually antagonistic genes can
drive selection for reduced recombination via gradual re-duction of crossover frequencies, due to the spread of genetic modifiers of recombination rates and/or chromo-some rearrangements such as inversions [2]. A lack of re-combination results in accumulation of more deleterious substitutions relative to recombining regions, ultimately leading to deletion of non-functional DNA segments from the Y chromosome [3].
Sex chromosomes have evolved independently many times from different autosomes in different lineages [4]. In each lineage, different features are associated with sex-chromosome evolution. Drosophila lacks recombination * Correspondence:asatok@sci.hokudai.ac.jp
5
Laboratory of Animal Cytogenetics, Faculty of Science, Hokkaido University, Kita 10 Nishi 8, Kita-ku, Sapporo, Hokkaido, Japan
Full list of author information is available at the end of the article
© 2015 Murata et al. Open Access This article is distributed under the terms of the Creative Commons Attribution 4.0 International License (http://creativecommons.org/licenses/by/4.0/), which permits unrestricted use, distribution, and reproduction in any medium, provided you give appropriate credit to the original author(s) and the source, provide a link to the Creative Commons license, and indicate if changes were made. The Creative Commons Public Domain Dedication waiver (http://creativecommons.org/publicdomain/zero/1.0/) applies to the data made available in this article, unless otherwise stated.
during male meiosis, so they have completely differenti-ated and largely degenerdifferenti-ated Y chromosomes [5]. The sex chromosomes of some fishes and plants have not evolved large non-recombining regions because their independ-ently- and repeatedly-formed sex chromosomes have not had time for recombination to be suppressed or as a conse-quence of extensive ongoing recombination along the most region of sex chromosomes over long periods of time, as also illustrated by the sex chromosomes of palaeognathous birds [6–9]. In contrast, most eutherians have evolved largely degenerated Y chromosomes with the minute hom-ologous region known as the pseudoautosomal region (PAR), which derived from an autosomal pair fused to the sex chromosomes in eutherian ancestor [1]. In eutherian, chiasma formation between X and Y chromosomes in the PAR are essential for the correct segregation of the sex chromosomes in male meiosis [10, 11]. Obligate crossing over in the minute PAR results in an extremely high combination rate in the region relative to other genomic re-gion, and the high frequency of meiotic recombination is expected to cause an increase in G + C content within PAR through GC-biased gene conversion (gBGC) [12, 13]. Previ-ous studies suggest that the rapid progression of Y gene decay occurred shortly after the initiation of the sex chromosome differentiation in eutherian [4, 14, 15]. There-fore, the eutherian sex chromosomes might diverge largely because of not only their ancient origin, but also an unrecognized mechanism that accelerates Y degeneration. It is needed to understand the both processes of recom-bination suppression and PAR formation during early sex chromosome differentiation for revealing the eutherian-specific feature in Y degeneration. However, it remains unknown when and how PAR is formed in the sex chro-mosomes. Sex chromosomes of most of the highly di-verged extant eutherian species are too ancient to address this issue. By contrast, the neo-sex chromosomes gener-ated by sex-autosome fusions of recent origin are expected to be evolutionarily young. Therefore, such neo-sex chromosomes provide a good model in which to eluci-date the early phases of eutherian-specific sex chromo-some evolution.
The Okinawa spiny rat (Tokudaia muenninki) has neo-sex chromosomes formed by neo-sex-autosome fusions and is therefore an excellent model for studies of the initiation process of sex chromosome differentiation [16]. Cross-species fluorescence in situ hybridization (Zoo-FISH) has revealed that a pair of autosomes fused with the sex chro-mosomes of T. muenninki (neo-X and neo-Y), which are homologous to segments of chromosomes 11 and 16 of mouse [16]. The neo-sex chromosomes of T. muenninki correspond to autosomes in the two other Tokudaia spe-cies, Tokudaia tokunoshimensis and Tokudaia osimensis [17], indicating that the sex-autosome fusions occurred independently in the T. muenninki lineage after it diverged
from the last common Tokudaia ancestor. On the basis of the sequence data for mitochondrial cytochrome b (Cytb) and nuclear recombination activating gene 1 (RAG1), divergence times between T. muenninki and the two other species are estimated to be around 1.5–1.7 and 0.6–0.8 million years ago (MYA) ([18]; on the basis of the substi-tution rate of this gene in murids, 0.932 (Cytb) and 0.078 (RAG1) per 12 MY; [19]), suggesting that autosomes fused to sex chromosomes at 1.5–1.7 MYA or more recently. T.
muenninki (2n = 44, XX/XY) is the only species in the
genus Tokudaia that has maintained the Y chromosome, probably through fusion with an autosome [16, 18]. The short and long arms of their X chromosome (Xp and Xq) consisted of autosome (neo-X) and ancestral X, respect-ively, and the X chromosome had a large centromeric het-erochromatin [16, 18]. The short arm of Y chromosome (Yp) consisted of autosome (neo-Y) in almost region and minute ancestral Y at the pericentromeric region, and the long arm of Y chromosome (Yq) was heterochromatic re-gion including many SRY pseudogenes [16, 18]. The other two spiny rats lost the whole Y chromosome, except for a small region translocated to a single X chromosome in males and females [20, 21].
In the study described here, we applied molecular cytogenetic and genetic approaches to reveal the pro-cesses of PAR formation and recombination suppression during early-stage evolution of eutherian sex chromo-somes, using T. muenninki neo-sex chromosomes as a model. First, we used fluorescence in situ hybridization (FISH) in a T. muenninki male to examine loci order in the neo-X and neo-Y chromosomes, as well as identify their chromosomal rearrangements. To estimate recom-bination rates along the neo-sex chromosome, the fine approach is to construct a genetic map by genotyping, with a high density of markers and a large number of unrelated individuals [22]. In single-sperm typing and genetic maps of three-generation families, male and sex-specific recombination rates also can be estimated, re-spectively. However, it is difficult to correct sufficient samples for estimating recombination rates by above analysis because T. muenninki is endangered and has been protected by the Japanese government as a natural treasure since 1972. Therefore, we detected variations in G + C content, which is positively correlated with recom-bination activity [12, 13, 23], by substitution-direction ana-lysis using 116 gene sequences from the peritelomeric, middle, and pericentromeric regions of T. muenninki neo-sex chromosomes, to reveal recombination activity in different chromosomal locations. We also studied male-specific substitutions to identify the genetically diverged re-gion between the neo-X and neo-Y, using partial sequences of 21 genes on three different regions of the neo-sex chro-mosomes. Furthermore, we determined the neo-X– and neo-Y–linked sequences of 18 genes to elucidate the
processes underlying their genetic differentiation. In this study, we show that recombination have been suppressed in the pericentromeric region while recombination have been activated in the peritelomeric region of neo-sex chro-mosomes, indicating PAR might have evolved during the early stage of sex chromosome differentiation.
Results
Conserved synteny between neo-sex chromosomes
We performed two- and three-color FISH mapping, using bacterial artificial chromosome (BAC) clones of
T. muenninki as probes, to confirm conserved synteny
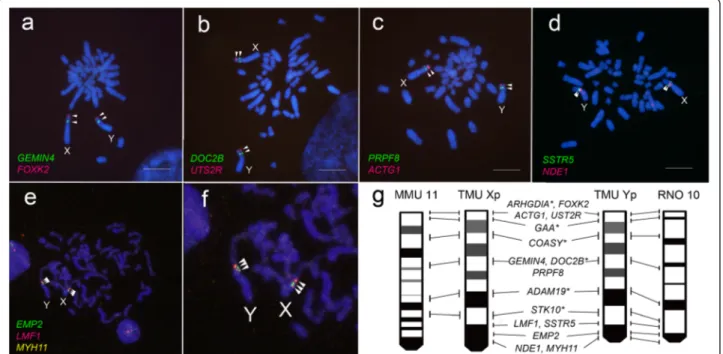
between their neo-sex chromosomes and the corre-sponding autosomes of mouse and rat. BAC clones used for FISH were screened based on genome infor-mation from mouse and rat, using as a reference the neo-sex–linked genes we identified in a previous study [16]. Sixteen, ten, and twenty four BAC clones were mapped to the peritelomeric, middle, and peri-centromeric regions of both T. muenninki neo-X and neo-Y, respectively, as inferred from the genomes of the two other rodents (Fig. 1 and Additional file 1: Table S1). The neo-sex chromosomes were homologous to mouse chromosomes 11, 16 and 17, and to rat chromo-some 10 (Additional file 1: Table S1). BAC FISH revealed
no distinct chromosome rearrangements between the neo-sex chromosomes and rat chromosome 10 (Fig. 1).
Substitution bias associated with G + C content in neo-sex chromosomes
We identified 51, 29, and 40 gene sequences located in the peritelomeric, middle, and pericentromeric regions of T. muenninki neo-sex chromosomes, respectively, from de novo assembled BAC sequences by performing the exon-intron definition based on the mapped read se-quences to the mouse genome (Additional file 1: Table S2). Frameshifts were found in four genes on the neo-sex chro-mosomes (Additional file 1: Table S2), and the coding se-quences of these genes were excluded from the following substitution-direction analysis.
To detect the variation in recombination frequency of
T. muenninki neo-sex chromosomes, we estimated the
G + C content in each of the three regions of the neo-sex chromosomes, which is positively correlated with recombination activity [12, 13]. We also estimated the frequency of nucleotide substitutions associated with the G + C content in the neo-sex chromosomes comparing to the corresponding autosomes in mouse and rat, which are the most closely related species to T. muenninki among the species with sufficient sequence data available for the analysis. Noncoding sites and third codon positions
Fig. 1 Two- and three-color FISH mapping of DAPI-stained chromosomes of a male T. muenninki. FITC-avidin (green)– and rhodamine-DIG (red)–labeled BAC DNA probes were used. Scale bar indicates 10 μm. Arrowheads indicate the locations of each BAC clone. Eleven genes, GEMIN4 and FOXK2 (a), DOC2B and UTS2R (b), PRPF8 and ACTG1 (c), SSTR5 and NDE1 (d), EMP2, LMF1, and MYH11 (e, f) were mapped on T. muenninki neo-sex chromosomes. (g) Comparative cytogenetic maps from short arms of T. muenninki sex chromosomes (TMU Xp and Yp), mouse chromosome 11 (MMU 11), and rat chromosome 10 (RNO 10). The locations and order of the genes are shown on the side of each chromosome. The location of genes with asterisk and ideograms of T. muenninki neo-sex chromosomes were taken from Murata et al. (2012). The gene order and ideogram of MMU 11 and RNO 10 was taken from the NCBI database (http://www.ncbi.nlm.nih.gov/)
of coding sites, which are not generally subject to strong purifying selection, were used in this analysis. The muta-tion direcmuta-tion of each substitumuta-tion was inferred in each species relative to the homolog nucleotide site in the other two species by the maximum parsimony principle. In the result, the G + C content was higher in the peritelomeric region and slightly lower in the pericentromeric region of
T. muenninki neo-sex chromosomes than in the
corre-sponding autosomal regions from mouse and rat (Table 1). Nucleotide substitutions at both the coding and
noncod-ing sites were strongly biased toward A/T→ G/C
substi-tutions in the concatenated gene sequences from the peritelomeric region, but toward G/C→ A/T substitutions in the pericentromeric region of T. muenninki neo-sex chromosomes (Table 1). This substitution bias was also observed in the separated gene sequences from each re-gion (Additional file 2: Figure S1). By contrast, this strong bias in substitution direction was not detected in the mid-dle region of T. muenninki neo-sex chromosomes or in any region of rat and mouse autosomes (Table 1). These results showed that the sequence evolution toward GC-richness and AT-GC-richness had occurred in the peritelo-meric and pericentroperitelo-meric regions, respectively, through the strong substitution bias. In this analysis, the frequency of substitution direction in rat may be effected by some nucleotide substitutions occurred in the common ancestor of mouse and T. muenninki. Therefore, we also performed the substitution-direction analysis among T. muenninki, mouse, and rat with guinea pig as outgroup to compare T.
muenninkiwith rat more properly (Additional file 1: Table S3). This result also showed the sequence evolution toward GC- and AT-richness in the peritelomeric and pericentromeric region of T. muenninki neo-sex chro-mosomes, respectively.
We then inferred the substitution directions at all noncoding sites preceded by C or followed by G in three species to exclude the influence of DNA methylation on G + C content in the peritelomeric and pericentromeric regions of T. muenninki neo-sex chromosomes. The
total rate of CpG→ TpG and CpG → CpA substitutions
due to deamination of 5-methyl-cytosine in methylated CpG pairs is estimated to be more than 10 times higher than those of other transitions [24, 25]. The total
fre-quency of CpG→ TpG and CpG → CpA substitution
was only 3–3.5 % lower in the peritelomeric region and 0.3–0.7 % higher in the pericentromeric region in T.
muenninkithan in the corresponding autosomal regions
of mouse and rat (Additional file 1: Table S4).
Genetic differentiation between the pericentromeric regions of neo-sex chromosomes
We detected the male-specific substitutions to reveal the genetically diverged regions between neo-sex chromo-somes by PCR and direct sequencing using genomic DNA from two-to-six males and four females. We found 47 male-specific substitutions and four indels in eleven of twelve partial gene sequences from the pericentromeric region, but no male-specific substitutions in all 12 partial
Table 1 Comparison of G + C content and nucleotide substitution frequency in three regions among T. muenninki, mouse, and rat
Species Site Genome
category No. of genes No. of bases GC content No. of substitutions A/T→ G/C (%) G/C→ A/T A/T→ C/G C/G→ A/T A/T→ T/A G/C→ C/G
T.muenninki neo-sex peritelomeric ORF 50 22,288 69.5 1,452 51.9 25.1 9.8 2.8 3.6 6.9
M.musculus chr. 11E1-E2 66.8 1,231 34.0 42.9 7.6 5.5 2.8 7.1
R.norvegicus chr. 10q32.3 66.0 1,439 31.6 46.8 4.5 6.5 3.1 7.4
T.muenninki neo-sex middle ORF 29 15,596 64.7 655 35.9 42.3 6.7 5.2 4.4 5.5
M.musculus chr. 11B5 65.3 791 36.9 37.3 11.0 4.7 4.2 5.9
R.norvegicus chr. 10q24 64.2 957 32.0 45.4 7.1 6.3 3.3 6.0
T.muenninki neo-sex pericentromeric ORF 37 16,788 58.5 690 27.4 52.2 5.2 6.7 3.5 5.1
M.musculus chr. 16A1-B3, chr. 17A3.3 59.6 839 37.1 40.6 7.5 5.1 3.9 5.7
R.norvegicus chr. 10q11-12 59.4 1,150 36.3 41.1 7.0 5.7 4.9 5.0
T.muenninki neo-sex peritelomeric UTR + intron 51 342,340 52.4 22,385 40.3 24.9 13.4 6.3 7.3 7.8
M.musculus chr. 11E1-E2 50.9 18,488 32.0 35.1 10.9 7.6 6.9 7.6
R.norvegicus chr. 10q32.3 50.6 23,100 31.8 36.5 8.9 8.1 6.8 7.8
T.muenninki neo-sex middle UTR + intron 29 346,940 48.2 16,768 32.0 36.0 10.3 7.1 7.9 6.7
M.musculus chr. 11B5 48.4 17,444 32.7 34.4 11.5 6.9 7.6 6.8
R.norvegicus chr. 10q24 48.3 23,707 32.6 35.3 9.9 7.2 7.7 7.3
T.muenninki neo-sex pericentromeric UTR + intron 40 576,147 45.5 26,909 28.7 40.9 8.6 8.1 7.8 6.1
M.musculus chr. 16A1-B3, chr. 17A3.3 46.2 29,346 32.2 34.8 11.3 7.2 8.0 6.4
gene sequences from the peritelomeric and middle regions (Additional file 1: Table S5 and S6). Each neo-sex chromosome-derived BAC clone was screened based on the inferred neo-X and neo-Y alleles described in Additional file 1: Table S6 to confirm the degree of genetic divergence between the neo-X and neo-Y. The open read-ing frames (ORFs) of 18 genes studied were conserved on both neo-sex chromosomes except for TXNDC11, although the complete ORF sequences were not determined in three genes. The neo-Y–linked sequence of TXNDC11 contains the frameshift generated by a single base insertion, whereas its neo-X homolog does not (Additional file 2: Figure S2). Although neo-X derived BAC clone sequences did not be determined in PRM1 and CPPED1, detection of male-specific substitutions revealed that the frameshift mutations occurred in these genes as well as TXNDC11 in one allele of male (Additional file 1: Table S6).
The evolutionary rate was significantly higher in the neo-Y than the neo-X in the combined nucleotide sequences of all genes excluding TXNDC11, as well as in the noncoding sequences of all genes, comparing to mouse orthologues (Fig. 2a, b). The ratios of non-synonymous/synonymous substitution rates (dN/dS) for the combined 17 genes were estimated to reveal the variation in selection pressure on neo-Y genes using“free-ratio” model, which assumes a dif-ferent dN/dSratio for each branch. We observed that dN/
dS ratio was 2.9 times higher in the neo-Y branch than
X branch, and the significant difference between neo-X and neo-Y branches was shown by likelihood ratio test (P = 0.0151, Fig. 2c and Additional file 1: Table S7). Fur-thermore, the neo-Y branch has significantly higher dN/dS
ratio than other branches, while no significant differ-ence was found between the neo-X and other branches (P < 0.0001 and P = 0.5895, respectively, Additional file 1: Table S7).
As an additional analysis of substitution spectrum in the genetically diverged regions between neo-sex chro-mosomes, we estimated the frequencies of substitution directions in each neo-sex–derived noncoding sequence to distinguish between the neo-X and neo-Y by compar-ing with mouse sequence. Sequence evolution toward AT-richness was observed in both neo-X and neo-Y, al-though it was more pronounced on the neo-Y than the neo-X (Additional file 1: Table S8).
Discussion
In agreement with a previous study [16], our FISH analysis detected no visible inversion and deletion between the neo-X and neo-Y in T. muenninki (Fig. 1). However, it remains the possibility of small rearrangements between them. The determination of the complete genomic sequence from each neo-X and neo-Y in the recombination suppressed re-gion is needed to exclude the possibility. FISH analysis also showed the existence of homologous segment of mouse chr. 17 as well as chr. 11 and 16 in T. muenninki neo-sex chromosomes. The fluorescence signal of mouse chr. 17 probe on the neo-sex chromosomes would be too small to detect in Zoo-FISH analysis from our previous study [16]. It is hypothesized that a gradual reduction of crossover frequencies is due to the spread of genetic modifiers of recombination rates or to chromosome rearrangements such as inversions [2]. Recombination-suppressed sex
Fig. 2 Sequence evolution of T. muenninki neo-sex chromosomes. a Nucleotide sequence evolution in the coding sites of 17 combined genes. b Nucleotide sequence evolution in the noncoding sites of 18 combined genes. Equality of the evolutionary rate between the neo-X and neo-Y was rejected based on a chi-squared test, and an accelerated rate of evolution in the neo-Y was demonstrated in both coding and noncoding sites. subs: substitutions. c Maximum likelihood tree of the coding sequences of 17 combined genes. Numbers above and under branches refer to dN/dSratios and maximum-likelihood bootstrap percentage (1000 replications), respectively. The free-ratio model is
used, which assumes a different dN/dS ratio for each branch in the tree. dS: synonymous substitution rate; dN: non-synonymous substitution rate; spiny
chromosomes with chromosome inversions were reported in eutherian lineages. In humans, an autosome fused to the X chromosome (XAR) in the eutherian ancestor has high homology with the ancestral chromosome from which it is derived, whereas most of the autosome fused to the Y chromosome has genetically diverged from the XAR and then degenerated via at least eight inversions, leaving only the minute distal parts that recombine with the XAR dur-ing meiosis [1]. In black muntjac (Muntiacus crinifrons), recombination suppression due to a large autosomal inver-sion during the past 0.5 million years has led to the forma-tion of the neo-Y diverged from the neo-X [26]. Compared to their sex-chromosomal regions, T. muenninki neo-sex chromosomes without distinct chromosome rearrangement are in a very early stage of sex-chromosome differentiation.
Over the course of sequence evolution, GC-richness in-creased in the peritelomeric region and dein-creased in the pericentromeric region of the neo-sex chromosomes (Table 1). G + C content is negatively correlated with the distance to telomeres [23]. However, distance from the telomere does not differ significantly between the three regions of T. muenninki neo-sex chromosomes and the corresponding regions of rat chromosome 10 (Fig. 1), sug-gesting that chromosomal location is not the cause of the specific substitution patterns in T. muenninki neo-sex chromosomes. Therefore, the sequence evolution toward GC- and AT-richness in the peritelomeric and pericentro-meric region of neo-sex chromosomes, respectively, must be a consequence of genomic evolution from autosomes to sex chromosomes specifically in T. muenninki lineage. In human and bovine, G + C content of various regions can be ranked as follows (in decreasing order): PAR, auto-somes, X chromosome, and Y chromosome; this ranking corresponds to decreasing order of recombination activity [12]. This effect of recombination is most probably a con-sequence of the neutral process of gBGC, i.e., a nonrecip-rocal exchange of nucleotide sequence that is biased in favor of GC-alleles resulting from mismatch repair of het-eroduplex DNA formed during meiotic recombination [13, 23]. gBGC is expected to occur predominantly in re-combination hotspots with short lifespans and weak influ-ences on substitution rate, suggesting that it could affect the evolution of base composition in Mb-long genomic fragments, but not individual hotspots (typically 2 kb long) [13, 27]. This agrees well with our observation that G + C content was altered in both coding and noncoding sites of most of the genes we analyzed in the peritelomeric and pericentromeric regions (Additional file 2: Figure S1). We also observed sequence evolution toward AT-richness in both neo-X and neo-Y sequences from the pericentro-meric regions that genetically diverged each other, and the bias toward AT-richness was stronger on the neo-Y than neo-X (Table 1 and Additional file 1: Table S8). In the peri-centromeric region of neo-sex chromosome, recombination
could be suppressed between neo-X and neo-Y and limited between neo-X chromosomes during female meiosis. Therefore, this region shows low recombination rate com-paring to the corresponding autosomal region of other spe-cies and the other neo-X region recombining with neo-Y, in which recombination occurs during both male and female meiosis. This evolutionary pattern can be explained by a low gBGC effect due to depression of recombination activ-ity that involved in change from autosomal inheritance to sex-linked inheritance. Variation in G + C content is also generated by other factors, such as large differences in the original G + C content or the DNA methylation frequency of CpG dinucleotides [24, 25, 28]. However, the observed G + C variation in T. muenninki neo-sex chromosomes cannot be explained by these two factors. Changes toward GC-richness and AT-richness were observed respectively in the peritelomeric region, which has high G + C content, and the pericentromeric region, which has low G + C con-tent, relative to the corresponding autosomal regions in the two other species. There was little difference in the
CpG→ TpG/CpA substitution rate between T. muenninki
and the other rodent species. Therefore, it was suggested that the sequence evolution toward GC-richness resulted from the increased gBGC by acquisition of recombination activity in the peritelomeric region of the neo-sex chromo-somes. To reveal the recombination activity along the neo-sex chromosome, we need to estimate recombination rates in different regions by substitution-direction analysis as well as other approaches such as construction of a gen-etic map by genotyping with a high density of markers and a large number of unrelated individuals, single-sperm typing, and genetic maps of three-generation families, if we could correct sufficient number of DNA samples or fresh testis.
The lack of recombination results in accumulation of more substitutions on the Y chromosome than the X chromosome due to Muller’s ratchet, genetic hitchhiking, male-driven effects, positive selection, and/or relaxed puri-fying selection [3, 15, 29, 30]. In the pericentromeric region that genetically diverged between neo-sex chromosomes, we observed higher substitution rates in the neo-Y than neo-X (Fig. 2a, b, Additional file 1: Table S5 and S6), indi-cating that recombination had been suppressed in the pericentromeric region. We also observed higher dN/dS ra-tio in Y than X lineage, suggesting that the neo-Y–linked genes had experienced relaxed purifying selection and/or positive selection (Fig. 2c and Additional file 1: Table S7). Consistent with this result, we detected the internal stop codon generated by the frameshift in the neo-Y–linked sequence of TXNDC11, but not the neo-X–linked sequence (Additional file 2: Figure S2). We also revealed that the frameshift mutations in
PRM1 and CPPED1 as well as TXNDC11 on the
males (Additional file 1: Table S6), suggesting that the frameshift mutations were caused by neo-Y degener-ation in the three genes. Further investigdegener-ation is needed to identify factor accelerating the evolutionary rate on the neo-Y.
Our results suggested that the recombination was sup-pressed in the pericentromeric region of neo-sex chro-mosomes from any cause at least other than distinct chromosomal inversion (Figs. 1 and 2, Additional file 1: Table S6). This region locates most closely to the ances-tral sex chromosomes among the three neo-sex regions [16], suggesting that recombination between the neo-X and neo-Y was suppressed due to gradually spread of genetic modifiers of recombination rates from the ances-tral Y region to its neighboring region in the neo-Y chro-mosomes. Alternatively, it may be that the involvement of the heterochromatic arms is a prerequisite for recombin-ation suppression, or can at least accelerate the process. In common mole-rat, Cryptomys hottentotus natalensis and C. h. hottentotus, asynapsis of X2 (autosomal homolog of Y) and Y (autosome fused to ancestral Y) occurs in 25 % of cells examined and that this involves their heterochro-matic arms, while the sister taxon (C. h. pretoriae), which lacks these heterochromatic arms, displays complete syn-apsis of X2 and Y in 100 % of cells examined [31]. The asynapsis between the X2 and the Y leads to the absence of chiasma formation in this region, further emphasising that recombination is reduced between these chromo-somes [31]. T. muenninki has an X chromosome contain-ing a large pericentromeric heterochromatic region and a Y chromosome with heterochromatin in the proximal region of the short arm as well as the entire long arm [18]. Therefore, the involvement of pericentromeric heterochro-matins in T. muenninki Xp and Yp may be prerequisite for recombination suppression, or can at least accelerate the process in their neo-sex chromosomes.
There is a significant difference between peritelomeric and middle regions in regard to the extent of sequence evolution toward GC-richness, of which both are recom-bining regions (Table 1, Additional file 1: Table S5). The result suggested that recombination activity had already been limited in the peritelomeric region of almost hom-ologous neo-sex chromosomes, although in this study we could not study the recombination in male meiosis because they are endangered and protected species. The PAR has conserved synteny among most eutherian spe-cies in which it has been identified [32], suggesting that the PAR is formed during a very early stage of sex-chromosome differentiation. Therefore, acquirement of recombination activity limited in the peritelomeric region of sex chromosomes may be one of the mech-anism that accelerates Y degeneration during a very early stage of sex chromosome differentiation in eutherian.
Conclusions
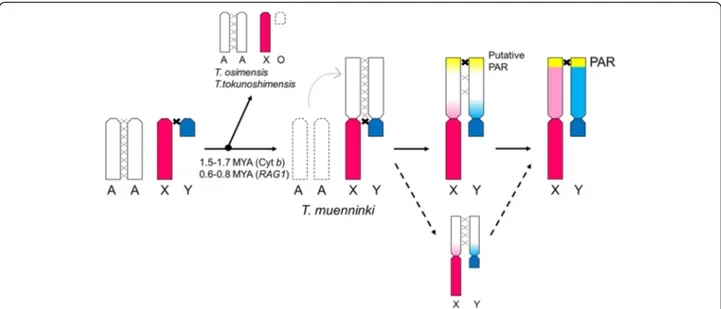
Our research showed that recombination might have been suppressed and activated in the pericentromeric and peritelomeric region of almost homologous neo-sex chromosomes without distinct chromosome rearrange-ment in T. muenninki. We conclude that the PAR might have been formed independently of the spread of recom-bination suppression at the same time as the initiation of recombination suppression during an early stage of sex-chromosome differentiation (Fig. 3). T. muenninki neo-sex chromosomes are excellent models for the very early stages of sex-chromosome differentiation, and fur-ther analysis of them should provide new insights into eutherian sex-chromosome evolution.
Methods
Sample collection, cell culture, and DNA extraction
T. muenninki is endangered (The IUCN Red List of
Threatened Species; http://www.iucnredlist.org/) and has been protected by the Japanese government as a natural treasure since 1972 [33]. We performed sample collection with permission from the Agency for Cultural Affairs and the Ministry of the Environment in Japan. After a small piece was cut from the tip of the tail of spiny rats for our study, all the spiny rats were released at their capture sites. We carried out cell culture and DNA extraction as previ-ously reported [18] and used genomic DNA from six males and four females of T. muenninki in this study. All the animal experiments in this study were approved by In-stitutional Animal Care and Use Committee of National University Corporation Hokkaido University and per-formed in accordance with the Guidelines for the Care and Use of Laboratory Animals, Hokkaido University. This article does not contain any studies with human par-ticipants performed by any of the authors.
Construction of BAC libraries and screening of BAC clones
BAC libraries were constructed according to previously described procedures [34]. Cultured fibroblast cells were embedded in 1 % agarose gels, treated with SacI, and subjected to pulsed-field gel electrophoresis. DNA frag-ments ranging from 125 to 225 kb were isolated and li-gated into vector pKS145. Transformation was carried out by electroporation using Escherichia coli DH10B as a host strain. Ampicillin-resistant transformants were collected and stored in 384-well plates. PCR primer sets were designed against M. musculus gene sequences lo-cated on chromosomes 11, 16, and 17 (GRCm38/mm10 provided from UCSC) and the orthologous sequences lo-cated on chromosome 10 of R. norvegicus (RGSC 5.0/rn5 and Rnor_6.0 provided from UCSC and NCBI, respect-ively). These primers were used to screen the T.
muen-ninki BAC library using a two-step 3D PCR screening
Additional file 1: Table S1. The identities of positive clones were confirmed by PCR using a single colony to provide template DNA. Clones screened for FISH analysis and each neo-sex sequence determination are presented in Additional file 1: Table S1 and S9, respectively. High-grade BAC DNA was obtained using the Plasmid Mini kit (QIAGEN) following the instructions of the manufacturer with minor modifications.
Chromosome preparation and FISH
Chromosome preparation and FISH were performed as pre-viously described protocol with slight modifications [35]. All BAC clones of T. muenninki were hybridized to male chro-mosomes. After hybridization overnight at 37 °C, hybridized probes labeled with biotin 16-dUTP or Digoxigenin (DIG) 11-dUTP by nick translation (Roche) were detected with FITC-avidin or anti-DIG-rhodamine (Roche), respectively, and then stained with 4′, 6-diamidino-2-phenylindole (DAPI). The FISH signals were observed under an Olympus fluorescence microscope BX51 and BX53 (Olympus), and the images were captured with an EXi Aqua digital camera (QImaging) and DP73 (Olympus), respectively.
Determination of BAC sequence by next-generation sequencing (NGS)
BAC sequence was determined by NGS on an Illumina HiSeq 1000 using a 100 bp paired-end protocol or an Illu-mina MiSeq using a 300 bp paired-end protocol. The DNA library was prepared from seven BAC pools (details shown in Additional file 1: Table S1, S8, S10, and S11) using TruSeq DNA Sample Prep v2 (Illumina), following
the manufacturer’s instructions, with a unique identifier index added to each pool for multiplex sequencing.
Data assembly
De novoassembly was performed after removing sequences
not from T. muenninki and quality filtering of reads. First, all short reads of each index group were mapped to the DNA sequences of cloning vector pKS145 (AB013921) and E. coli(NC_010473) using the BWA 0.5.9 aligner with the default setting, and then the unmapped BAM file generated by SAMtools 0.1.16 was converted into a FASTQ file using bam2fastq 1.1.0 [36, 37]. The unmapped reads were then mapped to the mouse genome sequences (mm10) using the BWA 0.5.9 aligner given 20 % uniform base error rate to identify genes included in BAC sequences determined by NGS. Next, using FASTX-Toolkit 0.0.13 and PRINSEQ lite 0.20.3, reads with 80 % of bases at quality threshold Q20 (1 in 100 chance of incorrect base call) and those that were less than 81 bp after trimming distal sequences of less than Q20 were removed. Finally, de novo assembly was carried out across multiple k-mer values using Velvet 1.0.17 (Add-itional file 1: Table S10 and S11) [38].
Sequence determination of neo-sex–linked genes
The assembled genomic sequences of M. musculus (GRCm38/mm10, released on December 2011) and R.
norvegicus(RGSC 5.0/rn5, released on March 2012) were
downloaded from UCSC Genome Bioinformatics (http:// genome.ucsc.edu/) and NCBI (http://www.ncbi.nlm.nih. gov/). De novo assembled sequences of T. muenninki BAC clones were annotated by identifying each exon of gene sequences determined by the reference mapping to mouse
Fig. 3 Evolution of neo-sex chromosomes. In the early stages of sex-chromosome differentiation, a putative PAR with recombination activity might have been formed prior to the spread of recombination suppression. Red: ancestral X region; blue: ancestral Y region; pink: neo-X region diverged from neo-Y; sky blue: neo-Y region diverged from neo-X; white: undifferentiated neo-sex chromosomal region; yellow: putative PAR. MYA: million years ago
genome. The accession numbers for 120 neo-sex–linked genes of T. muenninki are listed in Additional file 1: Table S2. The coding and noncoding sequences of each gene from T. muenninki were respectively aligned with the cod-ing and noncodcod-ing sequences of homologous genes from both mouse and rat using ClustalX 2.1 (Additional file 3) [39]. Gaps were filled with the sequences determined by the reference mapping or Sanger sequencing.
Estimation of G + C content and frequency of nucleotide changes
Custom written C scripts were used to estimate the G + C content and the frequency of each substitution direction in the aligned noncoding and coding sequences among T. muenninki, M. musculus, and R. norvegicus, with or with-out guinea pig (Cavia porcellus) as with-outgroup. The direction of nucleotide substitutions among the three sequences was inferred by the maximum parsimony principle shown in Additional file 2: Figure S3. At a given position, if T.
muen-ninki had a G-allele and the other species shared an
A-allele, the substitution direction was inferred to be from A to G in T. muenninki. An unaligned region and repetitive sequences were excluded from this analysis.
Detection of male-specific substitution and testing the molecular evolutionary rate
Substitution detection was performed in partial sequences of seven genes from the peritelomeric region, five genes from the middle region, and twelve genes from the peri-centromeric region of the neo-sex chromosome (Add-itional file 1: Table S5). PCR was carried out in a reaction
volume of 10 μl containing 25 ng of template genomic
DNA, 0.3μM of each primer (Additional file 1: Table S5), 0.2 mM of each of the four dNTPs, and 0.25 U of PrimeS-TAR GXL DNA Polymerase (TaKaRa Bio Inc.). The reac-tion profile was as follows: denaturareac-tion for 2 min at 98 ° C, by 30 cycles of denaturation for 10 s at 98 °C, annealing for 15 s at 60 °C, and extension for 30 s or 1–3 min at 68 ° C, and then a final extension at 72 °C for 5 min. Nucleo-tide sequences were determined on an ABI 3500xL gen-etic analyzer (Applied Biosystems). We determined each gene sequence using the genomic DNA from two to six males. In the event that a common substitution was iden-tified in all males, we validated the male specificity of the substitution by verifying the absence of polymorphism at the same site in four females.
The equality of evolutionary rate between neo-X and neo-Y sequences was tested by Tajima’s relative rate test (MEGA 5.2.2) [40] with the autosomal homologs in mouse, which was more closely related species to T. muenninki than rat. The dN/dS ratios, which were indicator used to detect the variation in selection pressure on genes, were es-timated by the branch model with CODEML program in PAML ver. 4.8 [41, 42]. This analysis was carried out based
on the tree topology of the ML tree constructed by using MEGA 5.2.2. For instance, the two-ratio model of category 3 assumes that the branches of interest (both neo-X and neo-Y branch) have a dN/dS ratio that is different from the background ratio. The three-ratio model assumes that the ratios for neo-X and neo-Y branches are different and both are different from the background ratio. The above models were compared using the likelihood ratio test to examine interesting hypotheses.
Availability of supporting data
The sequences of T. muenninki neo-sex–linked genes determined in this study are available on GenBank (accession numbers AB984629-AB984775). The se-quence alignment of each gene among T. muenninki, mouse, rat, and guinea pig used in this study are in-cluded in Additional file 3.
Additional files
Additional file 1: Table S1. List of BAC clones screened for FISH analysis in this study. Table S2. List of genes located on the three regions of neo-sex chromosomes in T. muenninki. Table S3. Comparison of G + C content and nucleotide substitution frequency in three regions among T. muenninki, mouse, and rat with guinea pig as outgroup. Table S4. Frequencies (%) of nucleotide substitutions in sites preceded by C or followed by G in T. muenninki neo-sex chromosomal segments and their autosomal homologs in mouse and rat. Table S5. Detection of male-specific substitutions in 24 genes located on the neo-sex chromosomes. Table S6. Male-specific substitutions observed in the pericentromeric region of the T. muenninki neo-Y chromosome. Table S7. Resulti of tests of the differences in dN/dSratios among
T. muenninki neo-X, neo-Y, and other branches. Table S8. G + C content and frequency of nucleotide substitutions in T. muenninki neo-sex chromosomes and their homologous region in mouse. Table S9. List of BAC clones identified for neo-sex sequence determination. Table S10. Results of next-generation sequencing on an Illumina HiSeq, using a 100 bp paired-end protocol and de novo assembly. Table S11. Results of next-generation sequencing on an Illumina MiSeq, using a 300 bp paired-end protocol and de novo assembly. (ZIP 110 kb) Additional file 2: Figure S1. Frequency distribution of relative rates of A/T→ G/C and G/C → A/T substitutions in T. muenninki, mouse, and rat. Each relative rate was estimated from the combined sequences of coding (3rd codon only) and noncoding sites of each gene located on the peritelomeric (a) and pericentromeric (b) regions of T. muenninki neo-sex chromosomes and the corresponding autosomal regions of mouse and rat. The horizontal axis shows the log of the ratio of A/T→ G/C substitutions to G/C→ A/T substitutions, and the vertical axis shows the number of genes. Black bar: T. muenninki; white bar: M. musculus; and gray bar: R. norvegicus. Figure S2. Comparison of nucleotide sequences of TXNDC11 between T. muenninki neo-X and neo-Y. Single base insertion site in neo-Y–linked sequence was indicated by gray box. The sequences were partially skipped in TMU (2407 bp) and MMU (2410 bp), and the skipped site is shown by double slashes. The accession number for Txndc11 gene from mouse is NM_029582. TMU: T. muenniniki, MMU: M.musculus. Figure S3. The estimation of nucleotide substitution directions in the three species by the maximum parsimony principle. TMU: T. muenninki, MMU: M. musculus, RNO: R. norvegicus. (ZIP 342 kb)
Additional file 3: File_1 and File_2 include each gene sequence alignment of non-coding and coding region amongT. muenninki , mouse, and rat, respectively. File_3 includes each gene sequence alignment of coding region among the three species with guinea pig. (DOC 21 kb)
Abbreviations
PAR:Pseudoautosomal region; gBGC: GC-biased gene conversion; Zoo-FISH: Cross-species fluorescence in situ hybridization; MYA: Million years ago; FISH: Fluorescence in situ hybridization; BAC: Bacterial artificial chromosome; ORF: Open reading frame; dN: Non-synonymous substitution
rate; dS: Synonymous substitution rate; XAR: Autosome fused to the X
chromosome; DIG: Digoxigenin; DAPI: 4‘, 6-diamidino-2-phenylindole; NGS: Next-generation sequencing.
Competing interests
The authors declare that they have no competing interests. Authors’ contributions
CM conceived and designed of the study, performed all experiments and data analysis, and drafted the manuscript. YK carried out the construction of BAC libraries and helped to screening of BAC clones. II participated to design of the study and draft the manuscript. MT and NI participated in screening of BAC clones and detection of male-specific substitution. AK conceived and designed of the study, and participated to draft the manuscript. All authors read and approved the final manuscript.
Acknowledgments
The authors thank A. Tajima for helpful advice and technical support with the NGS data analysis; K. Izumi and Fujii Memorial Institute of Medical Sciences, Tokushima University, for support with fluorescence microscopy; F. Yamada, T. Jogahara, C. Koshimoto, T. Mitani, and K. Nakata for their efforts in capturing the animals; and N. Inagaki, K. Tateno, and M. Fukuhara for help with BAC clone screening. This work was supported by JSPS KAKENHI Grant Numbers 23870023 and 26870410, and by a grant from the Sumitomo Foundation, Japan.
Author details
1Department of Human Genetics, Institute of Health Biosciences, Tokushima
University Graduate School, 3-18-15, Kuramoto-cho, Tokushima, Japan.
2RIKEN, Center for Integrative Medical Sciences, 1-7-22 Suehiro-cho, Tsurumi,
Yokohama, Kanagawa, Japan.3Present address: Division of Pediatric Disease
Genomics, Department of Genome Medicine, National Research Institute for Child Health and Development, 2-10-1 Okura, Setagaya-ku, Tokyo, Japan.
4Student Laboratory, Faculty of Medicine, Tokushima University, 3-18-15,
Kuramoto-cho, Tokushima, Japan.5Laboratory of Animal Cytogenetics,
Faculty of Science, Hokkaido University, Kita 10 Nishi 8, Kita-ku, Sapporo, Hokkaido, Japan.
Received: 27 May 2015 Accepted: 20 October 2015 References
1. Ross MT, Grafham DV, Coffey AJ, Scherer S, McLay K, Muzny D, et al. The DNA sequence of the human X chromosome. Nature. 2005;434:325–37. 2. Charlesworth D, Charlesworth B, Marais G. Steps in the evolution of
heteromorphic sex chromosomes. Heredity. 2005;95:118–28.
3. Bachtrog D. Y-chromosome evolution: emerging insights into processes of Y-chromosome degeneration. Nat Rev Genet. 2013;14:113–24.
4. Waters PD, Wallis MC, Marshall Graves JA. Mammalian sex-origin and evolution of the Y chromosome and SRY. Semin Cell Dev Biol. 2007;18: 389–400.
5. Zhou Q, Bachtrog D. Sex-specific adaptation drives early sex chromosome evolution in Drosophila. Science. 2012;337:341–5.
6. Volff JN. Genome evolution and biodiversity in teleost fish. Heredity. 2005;94:280–94.
7. Charlesworth D. Plant sex chromosome evolution. J Exp Bot. 2013;64:405–20. 8. Nishida-Umehara C, Tsuda Y, Ishijima J, Ando J, Fujiwara A, Matsuda Y,
et al. The molecular basis of chromosome orthologies and sex chromosomal differentiation in palaeognathous birds. Chromosome Res. 2007;15:721–34.
9. Pigozzi MI. Diverse stages of sex-chromosome differentiation in tinamid birds: evidence from crossover analysis in Eudromia elegans and Crypturellus tataupa. Genetica. 2011;139:771–7.
10. Burgoyne PS, Mahadevaiah SK, Sutcliffe MJ, Palmer SJ. Fertility in mice requires X-Y pairing and a Y-chromosomal“spermiogenesis” gene mapping to the long arm. Cell. 1992;71:391–8.
11. Burgoyne PS, Evans EP. A high frequency of XO offspring from X(Paf)Y* male mice: evidence that the Paf mutation involves an inversion spanning the X PAR boundary. Cytogenet Cell Genet. 2000;91:57–61.
12. Van Laere AS, Coppieters W, Georges M. Characterization of the bovine pseudoautosomal boundary: Documenting the evolutionary history of mammalian sex chromosomes. Genome Res. 2008;18:1884–95. 13. Duret L, Galtier N. Biased gene conversion and the evolution of
mammalian genomic landscapes. Annu Rev Genomics Hum Genet. 2009;10:285–311.
14. Hughes JF, Skaletsky H, Brown LG, Pyntikova T, Graves T, Fulton RS, et al. Strict evolutionary conservation followed rapid gene loss on human and rhesus Y chromosomes. Nature. 2012;483:82–6.
15. Cortez D, Marin R, Toledo-Flores D, Froidevaux L, Liechti A, Waters PD, et al. Origins and functional evolution of Y chromosomes across mammals. Nature. 2014;508:488–93.
16. Murata C, Yamada F, Kawauchi N, Matsuda Y, Kuroiwa A. The Y chromosome of the Okinawa spiny rat, Tokudaia muenninki, was rescued through fusion with an autosome. Chromosome Res. 2012;20:111–25. 17. Nakamura T, Kuroiwa A, Nishida-Umehara C, Matsubara K, Yamada F,
Matsuda Y. Comparative chromosome painting map between two Ryukyu spiny rat species, Tokudaia osimensis and Tokudaia tokunoshimensis (Muridae, Rodentia). Chromosome Res. 2007;15:799–806.
18. Murata C, Yamada F, Kawauchi N, Matsuda Y, Kuroiwa A. Multiple copies of SRY on the large Y chromosome of the Okinawa spiny rat, Tokudaia muenninki. Chromosome Res. 2010;18:623–34.
19. Sato JJ, Suzuki H. Phylogenetic relationships and divergence times of the genus Tokudaia within Murinae (Muridae; Rodentia) inferred from the nucleotide sequences encoding the Cytb gene, RAG1, and IRBP. Can J Zool. 2004;82:1343–51.
20. Arakawa Y, Nishida-Umehara C, Matsuda Y, Sutou S, Suzuki H. X-chromosomal localization of mammalian Y-linked genes in two XO species of the Ryukyu spiny rat. Cytogenet Genome Res. 2002;99:303–9.
21. Kuroiwa A, Ishiguchi Y, Yamada F, Abe S, Matsuda Y. The process of a Y-loss event in an XO/XO mammal, the Ryukyu spiny rat. Chromosoma. 2010;119:519–26. 22. Flaquer A, Rappold GA, Wienker TF, Fischer C. The human pseudoautosomal
regions: a review for genetic epidemiologists. Eur J Hum Genet. 2008;2008(16):771–9.
23. Duret L, Arndt PF. The impact of recombination on nucleotide substitutions in the human genome. PLoS Genet. 2008;4:e1000071.
24. Sved J, Bird A. The expected equilibrium of the CpG dinucleotide in vertebrate genomes under a mutation model. Proc Nati Acad Sci USA. 1990;87:4692–6. 25. Robertson KD, Wolffe AP. DNA methylation in health and disease. Nat Rev
Genet. 2000;1:11–9.
26. Zhou Q, Wang J, Huang L, Nie W, Wang J, Liu Y, et al. Neo-sex chromosomes in the black muntjac recapitulate incipient evolution of mammalian sex chromosomes. Genome Biol. 2008;9:R98.
27. Spencer CC, Deloukas P, Hunt S, Mullikin J, Myers S, Silverman B, et al. The influence of recombination on human genetic diversity. PLoS Genet. 2006;2:e148.
28. Jiang C, Zhao Z. Mutational spectrum in the recent human genome inferred by single nucleotide polymorphisms. Genomics. 2006;88:527–34. 29. Makova KD, Li WH. Strong male-driven evolution of DNA sequences in
humans and apes. Nature. 2002;416:624–6.
30. Gregoire MC, Massonneau J, Simard O, Gouraud A, Brazeau MA, Arguin M, et al. Male-driven de novo mutations in haploid germ cells. Mol Hum Reprod. 2013;19:495–9.
31. Deuve JL, Bennett NC, Ruiz-Herrera A, Waters PD, Britton-Davidian J, Robinson TJ. Dissection of a Y-autosome translocation in Cryptomys hottentotus (Rodentia, Bathyergidae) and implications for the evolution of a meiotic sex chromosome chain. Chromosoma. 2008;117:211–7.
32. Raudsepp T, Das PJ, Avila F, Chowdhary BP. The pseudoautosomal region and sex chromosome aneuploidies in domestic species. Sex Dev. 2012;6:72–83. 33. Yamada F, Kawauchi N, Nakata K, Abe S, Kotaka N, Takashima A, et al.
Rediscovery after thirty years since the last capture of the critically endangered Okinawa spiny rat Tokudaia muenninki in the northern part of Okinawa Island. Mammal Study. 2010;35:243–55.
34. Fujiyama A, Watanabe H, Toyoda A, Taylor TD, Itoh T, Tsai SF, et al. Construction and analysis of a human-chimpanzee comparative clone map. Science. 2002;295:131–4.
35. Matsuda Y, Chapman VM. Application of fluorescence in situ hybridization in genome analysis of the mouse. Electrophoresis. 1995;16:261–72.
36. Li H, Durbin R. Fast and accurate short read alignment with Burrows-Wheeler Transform. Bioinformatics. 2009;25:1754–60.
37. Li H, Handsaker B, Wysoker A, Fennell T, Ruan J, Homer N, et al. The Sequence Alignment/Map format and SAMtools. Bioinformatics. 2009;25:2078–9.
38. Zerbino DR, Birney E. Velvet: algorithms for de novo short read assembly using de Bruijn graphs. Genome Res. 2008;18:821–9.
39. Larkin MA, Blackshields G, Brown NP, Chenna R, McGettigan PA, McWilliam H, et al. Clustal W and Clustal X version 2.0. Bioinformatics. 2007;23:2947–8. 40. Tamura K, Peterson D, Peterson N, Stecher G, Nei M, Kumar S. MEGA5:
Molecular Evolutionary Genetics Analysis using Maximum Likelihood, Evolutionary Distance, and Maximum Parsimony Methods. Mol Biol Evol. 2008;28:2731–9.
41. Yang Z. Likelihood ratio tests for detecting positive selection and application to primate lysozyme evolution. Mol Biol Evol. 1998;15:568–73. 42. Yang Z. PAML 4: Phylogenetic Analysis by Maximum Likelihood. Mol Biol
Evol. 2007;24:1586–91.
Submit your next manuscript to BioMed Central and take full advantage of:
• Convenient online submission
• Thorough peer review
• No space constraints or color figure charges
• Immediate publication on acceptance
• Inclusion in PubMed, CAS, Scopus and Google Scholar
• Research which is freely available for redistribution
Submit your manuscript at www.biomedcentral.com/submit