棚田景観の評価の構造と関係する物理指標 [要約] 写真画像を用いた棚田景観の感性評価試験を行った結果、棚田景観の評価は「統一 感」「自然性」「複雑さ」の因子によって説明される。また、因子と関係する物理指標と して、全可視田の一筆面積の変動係数、畦畔延長−画像周長比がある。 農業工学研究所・農村環境部・景域研究室 区 分 研究 連絡先 029-838-7583 [email protected] 分 類 参考 [背景・ねらい] 水田が 有す る環境 保全 機能の 一つ として 、景 観保全 上の 機能が 広く 認識さ れつ つある。 特に棚田が有する景観保全機能は、棚田百選の選定にみられるように、高く評価されてい る。しかしながら、棚田の立地する山間地域の農村景観については、地形や景観構成要素 の複雑さから、景観に対する評価構造を明確にすることは困難であった。そこで、棚田景 観の評価構造を明らかにするとともに、関係する物理指標の解明を行う。 [成果の内容・特徴] 1.異なる視点場から撮影した棚田の写真画像を用いて、SD 法による棚田景観の感性評価 試験(被験者:成人男女 51 名)を実施した。結果、棚田景観の評価に関係する因子が 第 3 因子まで抽出された(表1)。各評価項目との関係から、第 1 因子は「統一感」、 第 2 因子は「自然性」、第 3 因子は「複雑さ」を示す評価因子と考えられる。 2.好ましい棚田景観を表す選好率と「統一感」との間には正の相関がある(相関係数: 0.825,1%水準で有意)(表2)。既往研究では、好ましい水田景観の評価要因として、 「広がり感」と「自然性」が指摘されているが、棚田景観においては「統一感」が好 ましい景観の評価に結びついている。 3.棚田景観の写真画像を、田面,畦畔などの構成要素(5 項目)ごとに塗り分け、画像 内に占める画素数を計測することにより、物理指標値を算出した(図1)。 4.各景観の因子得点を従属変数に、物理指標値を独立変数に回帰分析を行った結果、い くつかの物理指標値と評価因子の間に関係がみられた。「統一感」は、全可視田の一筆 面積の変動係数と関係がある(図2)。「複雑さ」は、全可視田の畦畔延長−画像周長 比(各筆の畦畔及び法面との境界延長を画像周囲の長さで除した値)と関係がある(図 3)。 [成果の活用面・留意点] 本研究での知見を活用することにより、棚田においても、人の景観評価、評価と関連する 物理指標を踏まえた保全・整備のあり方を検討していくことが可能となる。
[具体的データ] [その他] 研究課題名:水田地域における景域特性と景観評価との関係解析 中期計画大課題名:環境保全機能の総合的解析に基づく景域計画策定手法の開発 予算区分 :交付金研究 研究期間 :2001∼2003 年度 研究担当者:栗田英治、木村吉寿、松森堅治、上村健一郎 発表論文等:1)木村吉寿・斎藤元也・栗田英治・上村健一郎・長利洋、手持ちデジタル カメラ画像による棚田景観の特性評価、日本写真測量学会平成15年度 秋季学術講演会発表論文集、113-116、2003. 2)木村吉寿・栗田英治・松森堅治・斎藤元也・上村健一郎・長利洋、棚田 景観の特徴と評価および意義、システム農学講要、19 別 2、62-63、2003. 表1 棚 田 景 観 の評 価の因 子 分 析 結 果 表2 各 景 観 の因 子 得 点 と選 好 率 図1 物 理 指 標 値 算 出 の流 れ :天空 :山林 :田面 :畦畔 図2 筆 変 動 係 数と「統 一 感」との関 係 図3 畦 畔 延 長 ー画 像 周 長 比 と「複 雑さ」との関 係 評価項目 第1因子 第2因子 第3因子 複雑な/単調な -0.266 0.072 0.958 落ち着く/落ちつかない 0.733 0.614 -0.169 人の気配がする/ひと気がない 0.519 -0.721 0.022 バランスのとれた/バランスの悪い 0.982 0.027 0.126 開放感がある/囲まれ感がある 0.968 0.179 -0.023 整然とした/雑然とした 0.958 -0.189 0.062 自然的な/人工的な -0.559 0.791 -0.052 美しい/美しくない 0.819 0.514 0.217 固有値の合計 4.679 1.861 1.017 寄与率(%) 58.491 23.256 12.716 累積寄与率(%) 58.491 81.748 94.464 評価因子 統一感 自然性 複雑さ 統一感 自然性 複雑さ (第1因子) (第2因子) (第3因子) 景観1 -0.514 1.392 -0.435 5.9 景観2 -0.361 0.506 1.402 11.8 景観3 0.096 1.144 -1.608 9.8 景観4 0.826 0.185 1.316 52.9 景観5 -1.494 -0.436 -0.950 0.0 景観6 0.527 -2.024 -0.727 13.7 景観7 -1.387 -0.502 0.984 9.8 景観8 1.449 0.668 0.029 74.5 景観9 -0.283 -0.316 0.248 15.7 景観10 1.142 -0.616 -0.258 49.0 選好率(%) 景観8 景観10 景観9 景観1 景観3 景観5 景観2 景観7 景観6 景観4 y = 0.1764x - 0.9867 R2 = 0.3104 -2.000 -1.000 0.000 1.000 2.000 0.00 5.00 10.00 15.00 畦畔延長−画像周長比 複 雑 さ ︵ 第 3 因 子 ︶ 景観10 景観7 景観8 景観3 景観1 景観5 景観4 景観6 景観9 景観2 y = -0.0059x + 1.5863 R2 = 0.2393 -2.000 -1.000 0.000 1.000 2.000 0.0 100.0 200.0 300.0 400.0 500.0 筆変動係数 統 一 感 ︵ 第 1 因 子 ︶ 物理指標 算出方法 指標値 可視圃場枚数 64枚 可視田面積率 = 可視田面画素数/画像全画素数*100 27.5% 畦畔率 = 畦畔画素数/画像全画素数*100 22.9% 最大筆比 = 最大筆の画素数/可視田面画素数*100 15.0% 筆変動係数 = 全可視田の一筆ごとの画素数の変動係数 174.9 畦畔延長− 画像周長比 = 各筆の畦畔境界の延長/画像の周囲長 11.3
10 The Evaluation Structure of Terraced Rice Fields Landscapes and Related Physical Indexes
〔Abstract〕The results of the psychological experiment of terraced rice fields landscapes using picture images shows that the landscape are valued according to three factors, “coherence,” “naturality,” and “complexity.” The physical indexes that were related to these factors were the coefficient of variation of all visible rice field lots in an area and the ratio of levee lengths to circumferences length of picture.
Laboratory of Landscape Planning, Dept. of Rural Environment, National Institute for Rural Engineering
Classification: Research
Telephone number and e-mail address: 029-838-7583, [email protected]
Class: Reference
〔Background and objectives〕
The landscape conservation function has recently been recognized as one of the ecological functions of rice fields. Further, the landscape conservation function of rice fields is highly evaluated, as is evident in the selection of the best hundred terraced rice fields. It has been difficult, however, to identify the evaluation structure of rural landscape in hilly and mountainous areas due to the complexity of the topography and landscape elements. The purpose of this study is to identify the evaluation structure of terraced rice fields landscapes and to investigate related physical indexes.
〔Contents and characteristics of the results〕
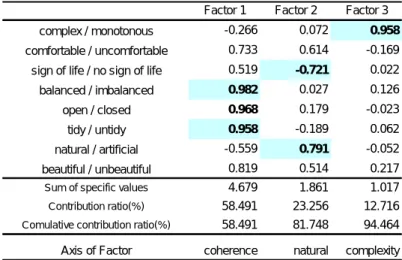
1. Using rice fields pictures taken from various viewpoints, the psychological experiment of terraced rice fields landscape was implemented based on the Semantic Differential method (examinees: a total of 51 adult men and women). As a result, three factors relating to the evaluation of terraced rice fields landscapes were clarified (Table 1). From the correlation between the evaluation items and factors it can be read that the first factor is “coherence,” the second “naturality,” and the third “complexity.”
2. A positive correlation between the preference ratio, which relates to preferable terraced rice fields landscapes, and “coherence” can be recognized (correlation coefficient: 0.825 (significance level is 1%)) (Table 2). Past studies show that the evaluation factors for preferable rice fields landscape are “extent feeling” and “naturality,” while “coherence” is related to the preferable evaluation for terraced rice fields landscapes.
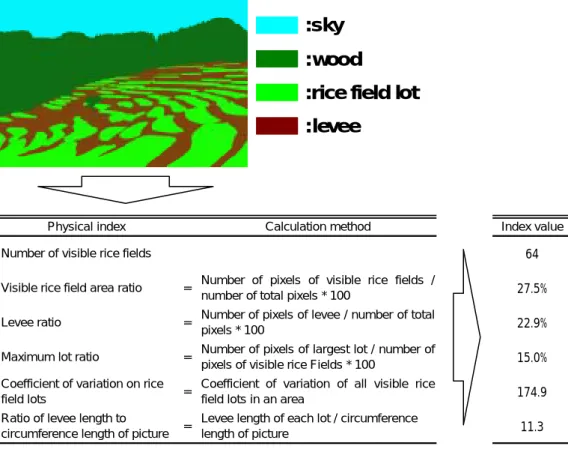
3. The pictures of terraced rice fields landscapes were divided into components (5 elements) such as rice field lots and levees, and then were colored differently. Then, the pixels in each component were counted to calculate physical indexes (Fig. 1).
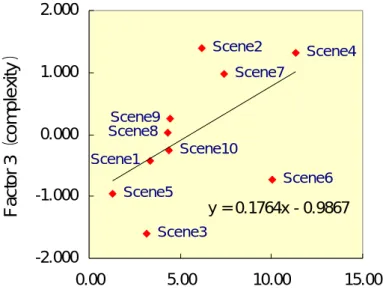
4. The results of the regression analysis with factor points of each scene as dependent variables and physical indexes as independent variables shows that some physical indexes relate to evaluation factors. For example,”coherence” relates to the coefficient of variation of
all visible rice field lots in an area (Fig. 2), and “complexity” to the ratio of levee lengths to circumferences length of picture (Fig. 3).
〔Utilization of the results and points to be considered〕
Using the knowledge obtained in this study allows a review of desirable maintenance for terraced rice fields in consideration of human evaluation on landscape and its relating physical indexes.
〔Specific data〕
Table 1: Result of factor analysis on evaluation for terraced rice fields landscape
Table 2: Factor point and preference ratio of each landscape
Factor 1 Factor 2 Factor 3
complex / monotonous -0.266 0.072 0.958
comfortable / uncomfortable 0.733 0.614 -0.169 sign of life / no sign of life 0.519 -0.721 0.022
balanced / imbalanced 0.982 0.027 0.126
open / closed 0.968 0.179 -0.023
tidy / untidy 0.958 -0.189 0.062
natural / artificial -0.559 0.791 -0.052 beautiful / unbeautiful 0.819 0.514 0.217 Sum of specific values 4.679 1.861 1.017 Contribution ratio(%) 58.491 23.256 12.716 Comulative contribution ratio(%) 58.491 81.748 94.464 Axis of Factor coherence natural complexity
coherence natural complexity (Factor 1) (Factor 2) (Factor 3)
Scene1 -0.514 1.392 -0.435 5.9 Scene2 -0.361 0.506 1.402 11.8 Scene3 0.096 1.144 -1.608 9.8 Scene4 0.826 0.185 1.316 52.9 Scene5 -1.494 -0.436 -0.950 0.0 Scene6 0.527 -2.024 -0.727 13.7 Scene7 -1.387 -0.502 0.984 9.8 Scene8 1.449 0.668 0.029 74.5 Scene9 -0.283 -0.316 0.248 15.7 Scene10 1.142 -0.616 -0.258 49.0 preference ratio (%)
Fig.1: Flow for calculating physical indexes
Fig. 2: Relation between coefficient of variation on rice field lots and “coherence”
Physical index Calculation method Index value
Number of visible rice fields 64
Visible rice field area ratio = Number of pixels of visible rice fields /
number of total pixels * 100 27.5% Levee ratio = Number of pixels of levee / number of total
pixels * 100 22.9%
Maximum lot ratio = Number of pixels of largest lot / number of
pixels of visible rice Fields * 100 15.0% Coefficient of variation on rice
field lots =
Coefficient of variation of all visible rice
field lots in an area 174.9 Ratio of levee length to
circumference length of picture =
Levee length of each lot / circumference
length of picture 11.3 Scene2 Scene9 Scene7 Scene5 Scene1 Scene3 Scene6 Scene10 Scene4 Scene8 y = -0.0059x + 1.5863 -2.000 -1.000 0.000 1.000 2.000 0.0 100.0 200.0 300.0 400.0 500.0 The coefficient of variation of all
visible rice field lots in an area
F a c tor 1 (c o he re nc e ) :天空 :山林 :田面 :畦畔 :天空 :山林 :田面 :畦畔 :sky
:rice field lot :levee
Fig. 3: Relation between ratio of levee length to circumference length of picture and “complexity” Scene4 Scene6 Scene7 Scene2 Scene5 Scene3 Scene1 Scene9 Scene10 Scene8 y = 0.1764x - 0.9867 -2.000 -1.000 0.000 1.000 2.000 0.00 5.00 10.00 15.00 The ratio of levee lengths to circumferences length of picture
Fa c to r 3 (co m p le xi ty )