Title:
1
Entrance surface dose measurements using a small OSL dosimeter with a
2
computed tomography scanner having 320 rows of detectors
3
Authors:
4
Kazuki Takegami1),*, Hiroaki Hayashi2),#, Kenji Yamada3), Yoshiki Mihara4),
5
Natsumi Kimoto1), Yuki Kanazawa2), Kousaku Higashino2,3), Kazuta
6
Yamashita2,3), Fumio Hayashi2,3), Tohru Okazaki5), Takuya Hashizume5), Ikuo
7
Kobayashi5)
8
1) Graduate School of Health Sciences, Tokushima University
9
3-18-5 Kuramoto-cho, Tokushima, Tokushima 770-8503, Japan
10
2) Graduate School of Biomedical Sciences, Tokushima University
11
3-18-5 Kuramoto-cho, Tokushima, Tokushima 770-8503, Japan
12
3) Tokushima University Hospital
13
3-18-5 Kuramoto-cho, Tokushima, Tokushima 770-8503, Japan
14
4) School of Health Sciences, Tokushima University
15
3-18-5 Kuramoto-cho, Tokushima, Tokushima 770-8503, Japan
5) Nagase-Landauer, Ltd.
17
C22-1 Suwa, Tsukuba, Ibaraki 300-2686, Japan
18
*Present address:
19
Yamaguchi University Hospital
20
1-1-1, Minamikogushi, Ube, Yamaguchi 755-8505, Japan
21
# Corresponding Author:
22
Hiroaki HAYASHI
23
Institute of Biomedical Sciences, Tokushima University Graduate School
24
3-18-5 Kuramoto-cho, Tokushima, Tokushima 770-8503, Japan
25 +81-88-633-9054 26 hayashi.hiroaki@tokushima-u.ac.jp 27 Keywords: 28
OSL dosimeter; GafchromicTM film, entrance-surface dose, computed
29
tomography
30
Classifications:
4.010: Dosimetry-Radiation Protection
32
Abstract: (250 words)
33
Entrance surface dose (ESD) measurements are important in X-ray computed
34
tomography (CT) for examination, but in clinical settings it is difficult to
35
measure ESDs because of a lack of suitable dosimeters. We focus on the
36
capability of a small optically stimulated luminescence (OSL) dosimeter.
37
The aim of this study is to propose a practical method for using an OSL
38
dosimeter to measure the ESD when performing a CT examination. The
39
small OSL dosimeter has an outer width of 10 mm; it is assumed that a partial
40
dose may be measured because the slice thickness and helical pitch can be set
41
to various values. To verify our method, we used a CT scanner having 320
42
rows of detectors and checked the consistencies of the ESDs measured using
43
OSL dosimeters by comparing them with those measured using GafchromicTM
44
films. The films were calibrated using an ionization chamber on the basis of
45
half-value layer estimation. On the other hand, the OSL dosimeter was
46
appropriately calibrated using a practical calibration curve previously
47
proposed by our group. The ESDs measured using the OSL dosimeters are
48
in good agreement with the reference ESDs from the GafchromicTM films.
Using these data, we also estimated the uncertainty of ESDs measured with
50
small OSL dosimeters. We conclude that a small OSL dosimeter can be
51
considered suitable for measuring the ESD with an uncertainty of 30% during
52
CT examinations in which pitch factors below 1.000 are applied.
53 54
1 Introduction
55
X-ray examinations using computed tomography (CT) and plain X-rays
56
are widely used to diagnose various diseases in clinics because of their simple
57
and quick results. X-ray equipment is properly controlled on the basis of
58
several tests for accuracy using a management program; however, exposure
59
doses for each patient are not measured because of a lack of detection systems.
60
The X-ray exposure has recently been increased [1] to obtain high-quality
61
medical images for diagnosis. It is important for radiological technologists
62
and medical doctors to optimize the balance between image quality and
63
exposure doses to patients [2–4]. In particular, CT examinations result in
64
higher X-ray exposure than plain X-ray examinations; thus, an increased the
65
risk of getting cancer has been noted [5]. It becomes imperative to construct
66
a system to measure the exposure dose received during CT examinations.
67
For clinical applications, the system should be easy to use.
68
The exposure dose received during a CT examination is generally
69
evaluated using the CT dose index (CTDI) method; however, it is difficult to
70
evaluate the actual dose received by the patient [6]. Ideally, the organ doses
71
of patients should be evaluated, but in reality, only a few studies have
estimated these, using several human-body-type phantoms in which
73
radiation detectors were implanted within the organs [7, 8]. Although this
74
research method provides a good estimate, the systems are slightly
75
complicated for application in clinical diagnosis. Using a suitable dosimeter,
76
we plan to evaluate the doses not only of phantoms, but also of patients. At
77
the beginning of our research, we focused on the entrance surface dose (ESD).
78
The ESD is used for making practical evaluations; there is plentiful research
79
concerning ESD measurements [8–15]. In this study, we used a small
80
optically stimulated luminescence (OSL) dosimeter.
81
An OSL dosimeter called nanoDot™ was made commercially available by
82
Landauer, Inc. The following useful characteristics of this dosimeter helped
83
us to measure the ESDs in the diagnostic X-ray region. First, the dosimeter
84
is small and lightweight. The dosimeter will not interfere with X-ray
85
examinations if patients wear the dosimeter on their bodies. Second, the
86
nanoDotTM OSL dosimeter has a low detection efficiency. According to our
87
previous studies [16–18], the nanoDotTM OSL dosimeter does not interfere
88
with medical imaging in the diagnostic X-ray region; therefore, it is assumed
89
that no additional artifacts appear on CT images. Third, the dosimeter can
store the information regarding radiation detection for a long time and can be
91
read many times without loss of information [18]; these characteristics play
92
an important role in managing the ESD of each patient over the long term.
93
Finally, compared with other radiation detectors, nanoDotTM OSL dosimeters
94
are inexpensive; therefore, they can be produced in large quantities. To date,
95
we have performed various basic studies on the use of the nanoDotTM OSL
96
dosimeter in the diagnostic X-ray region as an annealing device [19], for
97
evaluation of the uncertainty of the measurement system [18], for angular
98
measurements [20], and for determining the energy dependences [21].
99
Moreover, we proposed a practical dose calibration curve [22] in which the
100
systematic uncertainty was evaluated to be 15% by considering the angular
101
dependence, energy dependence, and variability of individual dosimeters. In
102
our system, the ESD and entrance-skin dose can be derived from measured
103
values without the need to gather information about the irradiation
104
conditions such as the tube voltages and incident X-ray angles. The
105
nanoDotTM OSL dosimeter is expected to be suitable for direct measurements
106
in clinical applications.
107
When performing CT examinations using collimated X-rays, the response
of the nanoDotTM OSL dosimeter is unclear. Thus, we should evaluate the
109
uncertainty of the nanoDotTM OSL dosimeter when it is used for CT scans,
110
where some dosimeters may be irradiated by the slit X-ray beam directly and
111
others may not. It is assumed that the responses of the dosimeter will
112
change depending on the irradiation conditions, which are described as the
113
slice thickness and helical pitch (pitch factor, PF). In contrast, for a cone
114
beam CT system, there is no significant problem. Giaddui et al. reported
115
that nanoDotTM OSL dosimeters can be used to measure doses with an
116
accuracy of 6% [23]. It is important for evaluating the ability to measure the
117
ESD using the nanoDotTM OSL dosimeter in general CT systems.
118
This study aims to evaluate the limitations and uncertainties when the
119
nanoDotTM OSL dosimeter is used to measure the ESD during CT
120
examinations.
121
2 Materials and methods
122
2.1. Dose measurement
123
2.1.1. Small OSL dosimeter: nanoDotTM
124
We used a small OSL dosimeter called the nanoDotTM (Landauer,
Glenwood, Illinois, U.S.A.) for measuring the ESDs. The size of the
126
nanoDotTM OSL dosimeter is 10 mm in width, 10 mm in length, and 2 mm in
127
thickness. The detector region is made of Al2O3:C. Information concerning
128
X-ray exposure was measured using a reading device, the microStar® reader
129
(Landauer, Glenwood, Illinois, U.S.A.), and was derived as countable values,
130
which are referred to as counts. Before irradiation with X-rays, the
131
nanoDotTM OSL dosimeter was sufficiently initialized [19]. The detection
132
efficiency, ε, of nanoDotTM OSL dosimeters exhibits individual differences,
133
information on which is incorporated into barcodes (ID). To account for these
134
differences in ε, we used the values of counts/ε [18–22].
135
To convert the counts/ε values of the nanoDotTM OSL dosimeter to the
136
ESD, a practical calibration curve developed in a previous study [22] was
137
applied. Here, the ESD can be derived from the counts/ε value as
138
ESD [mGy] = 𝐶𝐶𝐶𝐶𝐶𝐶𝐶𝐶𝐶𝐶𝐶𝐶𝜀𝜀 −240
3935 . (1)
139
In our method, the nanoDotTM OSL dosimeter was calibrated using 83 kV
X-140
rays [half-value layer (HVL) = 3.0 mmAl]. We proposed an adaptive 15%
141
uncertainty considering the effects of the angular dependence [20], energy
dependence [21], variability of individual dosimeters [18], and a difference
143
between mass energy-absorption coefficients of air and soft-tissue. In the
144
previous study [22], we reported that our calibration curve can convert
145
counts/ε to entrance-skin dose, which is defined by the absorbed dose of the
146
skin, e.g. soft-tissue. Although the ESD is defined by air kerma, we can
147
apply the previous curve to estimate the ESD; as described above, the effect
148
of disregarding the difference between mass energy-absorption coefficients of
149
air and soft-tissue was considered in the uncertainty (see equation (2)). A
150
schematic drawing of our calibration is presented in Fig. 1. Here, we explain
151
the method used to estimate the uncertainty. The total uncertainty of counts,
152
σt, consists of the statistical uncertainty, σsta, and the systematic uncertainty,
153
σsys, and their relationship is expressed as
154
𝜎𝜎𝑡𝑡 = �𝜎𝜎𝑠𝑠𝑡𝑡𝑠𝑠2+ 𝜎𝜎𝑠𝑠𝑠𝑠𝑠𝑠2, (2)
155
where σsys in this analysis becomes 0.15 (15%) [22]. In our experiments, the
156
counts/ε measured using the nanoDotTM OSL dosimeters were derived from
157
an average of five consecutive readings [18]. Then, σsta is calculated as
158
𝜎𝜎𝑠𝑠𝑡𝑡𝑠𝑠 = �
∑ �5𝑖𝑖 �𝐶𝐶𝑖𝑖 𝜀𝜀𝐶𝐶𝑖𝑖 𝜀𝜀⁄⁄�2
5 , (3)
where Ci/ε is the counts/ε value of the ith measurement.
160
2.1.2. GafchromicTM film
161
We used a high-sensitivity Gafchromic™ film (XR-SP2, ASHLAND Ltd.,
162
New Jersey, U.S.A.) for measuring the profile of the ESD. This film can be
163
used in the dose range of 0.5–50 mGy; the present experiments were
164
performed in this range. To reduce contamination from natural radiation,
165
new films were bought (lot number: 10261501, expiration date: October 2017),
166
and the experiments were performed within two weeks. A flat panel scanner
167
(Epson Expression 11000G flat-bed document scanner and DD-system,
168
SEIKO EPSON Corporation, Suwa, Japan) combined with analysis software
169
(DD-Analysis Ver. 10.33, R-Tech Inc., Azumino, Japan) was used for reading
170
the film density.
171
The GafchromicTM film was well calibrated according to the general
172
method [12, 24], as shown in Fig. 1. The quality of the radiation at the center
173
axis of the CT X-rays (120 kV) was determined using a 0.6-cc Farmer-type
174
ionization chamber (10X6-0.6CT, Radical Corporation, California, U.S.A.)
175
connected to a dosimeter (Accu-Pro, Radical Corporation, California, U.S.A.).
176 Fig. 1
In the present experiment, the HVLwas determined to be 7.2 mm. Then,
177
using diagnostic X-ray equipment (Digital Diagnost, Koninklijke Philips N.V.,
178
Amsterdam, Netherlands), in which the same quality of radiation as that of
179
a CT scanner was reconstructed, the measured value of the GafchromicTM film
180
was calibrated using the air kerma measured using the ionization chamber.
181
We checked the repeatability of the dose measurement system using the
182
flat panel scanner. This system was remarkably stable, and the uncertainty
183
of the repeatability of the system was estimated to be less than 0.5%.
184
Therefore, in this study, we did not consider the uncertainty of the dose
185
measured with the GafchromicTM film. On the other hand, the uncertainty
186
of the calibration of the GafchromicTM film was approximately 5% owing to
187
that of the ionization chamber. This uncertainty is not essential for our
188
analysis because the ionization chambers used in our experiments were
189
calibrated by the same calibration field.
190
2.2. Experiments
191
Experiments were performed using a multidetector CT scanner (Aquilion
192
ONETM, Toshiba Medical Systems, Otawara, Japan). The CT equipment has
320 rows of detectors that detect X-rays within a maximum range of 160 mm.
194
Figure 2 shows the experimental settings for X-ray irradiation in CT
195
scans. A water phantom (conforming to JIS Z4915-1973; length = 45 cm,
196
width = 30 cm, height = 20 cm) was placed on the scanning bed. Then, the
197
center of the phantom was aligned with the isocenter of the CT equipment.
198
Here, we marked the phantom for the sake of good reproducibility. To
199
measure the ESDs, both the GafchromicTM film and nanoDotTM OSL
200
dosimeters were placed on the water phantom as shown in Fig. 2. The
201
GafchromicTM film was cut into 10 mm wide by 100 mm long pieces, which
202
were pasted on the back side of a paper sheet. The nanoDotTM OSL
203
dosimeters were lined up on the front side of the sheet; the dimensions of the
204
dosimeters matched those of the pieces of GafchromicTM film. Owing to the
205
precise experimental setup, we could easily identify the relative positions in
206
which the nanoDotTM OSL dosimeters were set.
207
Table 1 summarizes the irradiation conditions. The relationships
208
between the PF and number of detector rows used in the experiment were as
209
follows: PF = 0.688, 0.938, 1.348 for 16 rows; PF = 0.656, 0.844, 1.406 for 32
210
rows; PF = 0.641, 0.828, 1.484 for 64 rows; PF = 0.637, 0.813, 1.388 for 80
211 Fig. 2
rows; PF = 0.810, 1.390 for 100 rows; and PF = 0.806, 0.994 for 160 rows. We
212
set the tube currents in order to obtain similar effective doses of
213
approximately 200 mAs (= 𝑇𝑇𝑇𝑇𝑇𝑇𝑇𝑇 𝑐𝑐𝑇𝑇𝑐𝑐𝑐𝑐𝑇𝑇𝑐𝑐𝑐𝑐 × 𝑅𝑅𝑅𝑅𝑐𝑐𝑅𝑅𝑐𝑐𝑅𝑅𝑅𝑅𝑐𝑐 𝑐𝑐𝑅𝑅𝑡𝑡𝑇𝑇 𝑃𝑃𝑅𝑅𝑐𝑐𝑐𝑐ℎ 𝑓𝑓𝑅𝑅𝑐𝑐𝑐𝑐𝑅𝑅𝑐𝑐⁄ ).
214
The following parameters were fixed: tube voltage of 120 kV, rotation time of
215
0.5 s, large field of view (FOV = 400 mm in diameter), and irradiation length
216
of 450 mm, which is the same as the length of the water phantom. When a
217
prescan was performed to determine the irradiation size of the water
218
phantom, we did not place the GafchromicTM film and nanoDotTM OSL
219
dosimeters on the phantom. After the prescan, both the GafchromicTM film
220
and nanoDotTM OSL dosimeters were placed on the water phantom, and the
221
examination scan was performed. We then analyzed the ESDs measured
222
using the GafchromicTM film and nanoDotTM OSL dosimeters as functions of
223
the PF and number of detector rows.
224
In addition, we performed an experiment for visualizing the ESD
225
distribution on a human-body phantom (PBU-60, Kyoto Kagaku, Ltd., Kyoto,
226
Japan) using the nanoDotTM OSL dosimeters in clinical settings. Figure 3
227
shows a photograph of the experiment. The nanoDotTM OSL dosimeters
228
were attached to the body phantom at intervals 2 cm in width and 5 cm in
229 Fig.3
length; 90 dosimeters were laid out on a region with a width of 18 cm (nine
230
dosimeters) and a length of 50 cm (10 dosimeters). The irradiation condition
231
used the general scan protocol from chest to pelvis. The conditions were as
232
follows: tube voltage of 120 kV, 80 rows of detectors, detector size of 0.5 mm,
233
PF of 0.814, large FOV, and effective tube-current time product of 166 mAs.
234
Here, experiments were performed in the CT scan mode with and without an
235
adaptive iterative dose reduction (Volume EC + AIDR3D) system proposed by
236
Toshiba [25, 26].
237
3 Results
238
3.1. ESDs on the water phantom
239
Figure 4 shows the ESD distributions under all the conditions in the CT
240
scans; (a), (b), (c), (d), (e), and (f) show results for 16 rows, 32 rows, 64 rows,
241
80 rows, 100 rows, and 160 rows, respectively. In these figures, the
242
horizontal axis represents the relative dosimeter position. The vertical axis
243
represents the ESDs. Values measured using the GafchromicTM film and
244
nanoDotTM OSL dosimeters are represented by small open circles and large
245
solid circles, respectively. The uncertainties of the nanoDotTM OSL
246 Fig.4
dosimeters from Eq. (2) were applied. For all the irradiation conditions, the
247
ESDs of the nanoDotTM OSL dosimeter were in good agreement with those
248
measured using the GafchromicTM film, within the margin of their
249
uncertainties. The broken lines represent the mean value of the ESD
250
distribution measured using the GafchromicTM film.
251
The mean value is important in this study for the evaluation of the
252
precision of the nanoDotTM OSL dosimeters during the CT scans. To perform
253
the evaluation, the differences between the mean values of the ESD
254
distribution and the ESDs measured using the nanoDotTM OSL dosimeters
255
were calculated, and they are plotted in Fig. 5. Here, we define the precision
256
of the nanoDotTM OSL dosimeters as the maximum difference; the levels (and
257
numerical values) are displayed as dashed lines in the figure. Under most
258
irradiation conditions, the accuracies were estimated to be below 25%, except
259
for the following three conditions: 64 rows with PF = 1.484 [Fig. 4 (c-3)], 80
260
rows with PF = 1.388 [Fig. 4 (d-3)], and 100 rows with PF = 1.390 [Fig. 4
(e-261
2)].
262
3.2. Visualization of ESD distributions using the human-body phantom
263 Fig.5
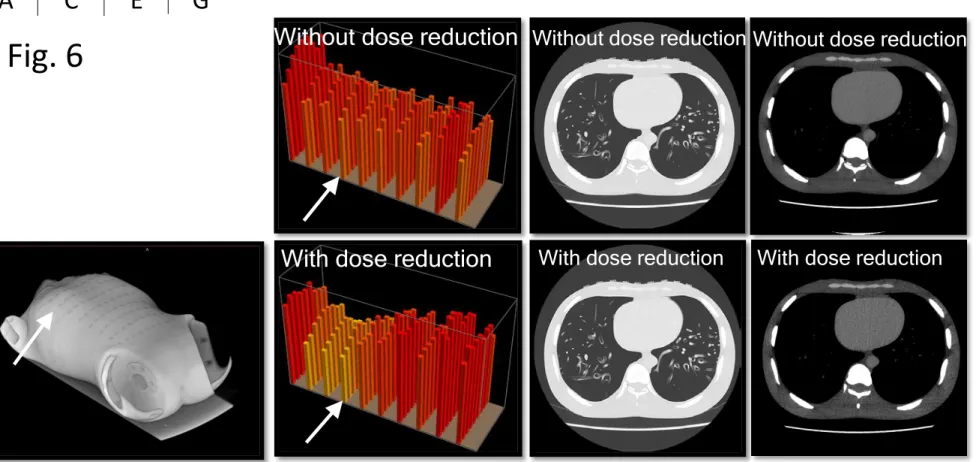
Figure 6 shows the results of the visualization of the ESD measurements
264
when the nanoDotTM OSL dosimeters were placed on the human-body
265
phantom. Figure 6 A shows the CT image derived by the CT scan; we can
266
observe the nanoDotTM OSL dosimeters on the surface of the human-body
267
phantom. Figure 6 B shows the two-dimensional distribution of the
268
measured ESDs in a normal scan, and Fig. 6 C shows the results obtained
269
using the dose reduction system. Higher ESDs are shown in red, and lower
270
ones in yellow. A comparison of B and C clearly reveals that the dose
271
reduction system is effective in the lung field. Figure 6 D and E show
cross-272
sectional CT images with the lung window corresponding to the positions
273
identified by arrows in B and C, respectively. In these images, the positions
274
of the nanoDotTM OSL dosimeters can be easily found. Figure 6 F and G
275
show cross-sectional CT images with the mediastinal window for the same
276
positions as in D and E, respectively. In contrast with D and E, in the images
277
in F and G, it is difficult to identify the positions at which the nanoDotTM OSL
278
dosimeters were attached.
279
4 Discussion
280
In this study, we tried to apply the small OSL dosimeter, nanoDotTM, to
281 Fig.6
measure the ESD during CT examinations. In CT scans, irradiated X-rays
282
are collimated into a slit beam; therefore, the measured counts of the
283
dosimeter irradiated by the slit beams undergo intricate fluctuations in
284
response to the chosen PF and the number of detector rows. Although the
285
outer dimensions of the nanoDotTM OSL dosimeter result in convenient
286
measurements when they are placed on patients, this placement may cause
287
reduced stability. To use the nanoDotTM OSL dosimeter in clinical settings,
288
the uncertainties of the ESDs and their limitations were evaluated as follows.
289
To estimate the uncertainties of the ESDs measured using the nanoDotTM
290
OSL dosimeters, measurements were also performed using the GafchromicTM
291
film and a water phantom. The ESDs measured under all the scanning
292
conditions using the nanoDotTM OSL dosimeters were consistent with those
293
measured using GafchromicTM film, as shown in Fig. 4. These results are
294
important, because the dose calibration methods for the nanoDotTM OSL
295
dosimeters and GafchromicTM film are completely different in this study.
296
The nanoDotTM OSL dosimeters were calibrated by the practical method we
297
proposed [22] on the basis of air-kerma measurements with X-rays of HVL =
298
3.0 mmAl (83 kV), whereas the GafchromicTM films were calibrated under
rays with a quality of HVL = 7.2 mmAl (120 kV). In our method for
300
evaluating the nanoDotTM OSL dosimeters, the energy and angular
301
dependences and the characteristics of different dosimeters were considered
302
to lie within an uncertainty of 15%. The results indicate that these previous
303
findings can be applied to ESD measurements during CT scans.
304
GafchromicTM film is widely used for evaluating the ESD distributions during
305
CT scans [12, 27]. For cases in which precise dose distributions should be
306
measured, it may be a suitable tool. In contrast, for convenient evaluation
307
of doses, the nanoDotTM OSL dosimeter also becomes a valuable tool. In the
308
near future, medical diagnoses will become more complicated because of the
309
use of multimodalities; patients will have to undergo examinations involving
310
not only a single CT scan, but also plain X-rays, dual-energy CT scans,
311
positron emission tomography, and so on. Medical staff will have to evaluate
312
the actual overall doses administered to patients. Our method using the
313
nanoDotTM OSL dosimeters can be used to evaluate the doses without the
314
need to gather information concerning the energy and angular dependences,
315
because our method includes the uncertainty of ignoring these effects. Thus,
316
our method will be valuable for the management of actual patient doses.
Here, using the ESD distributions measured using the GafchromicTM
318
films in Fig. 4 as the reference ESD, the accuracies and limitations of those
319
measured using the nanoDotTM OSL dosimeters were evaluated. The
320
differences of the ESDs measured using dosimeters from the mean value of
321
the reference ESD are represented in Fig. 5; the accuracies of the nanoDotTM
322
OSL dosimeters are defined as these differences. Relatively high accuracies
323
(small differences from the mean values) were derived when PFs close to
324
1.000 were used. Under this condition, the nanoDotTM OSL dosimeters were
325
uniformly irradiated; therefore, the observed deviations became smaller. On
326
the other hand, when the PFs were not close to 1.000, the accuracies
327
decreased rapidly. In particular, the following three conditions showed less
328
than favorable results: accuracy of 47% for PF = 1.484 (64 rows), accuracy of
329
41% for PF = 1.388 (80 rows), and accuracy of 38% for PF = 1.390 (100 rows).
330
These findings can be explained as follows. When the helical CT scan was
331
performed using 64 rows and a PF of 1.484, the irradiation area became 32
332
mm (= 64 [row] × 0.5 [mm row⁄ ]) in the direction of the long axis, and no
333
irradiation area of 15.5 mm [= 32 [mm] × (1.484 − 1.000)] appeared at the
334
isocenter. As a result, some dosimeters were irradiated only by scattered
rays (no direct X-rays), and lower ESDs were observed compared to those of
336
the other dosimeters irradiated by both direct and scattered X-rays. From
337
these results, we proposed that the nanoDotTM OSL dosimeter should not be
338
used for PFs of 1.484 for 64 rows, 1.388 for 80 rows, and 1.390 for 100 rows.
339
Under the conditions that we adopt, the maximum uncertainty is found to be
340
25% (PF = 0.641, 64 rows). Then, we proposed that an additional
341
uncertainty (σsys,CT) of 25% will be considered in estimating the total
342
uncertainty (σt,CT) of the CT scan, as follows:
343
𝜎𝜎𝑡𝑡,𝐶𝐶𝐶𝐶 = �𝜎𝜎𝑠𝑠𝑡𝑡𝑠𝑠2+ 𝜎𝜎𝑠𝑠𝑠𝑠𝑠𝑠2 + 𝜎𝜎𝑠𝑠𝑠𝑠𝑠𝑠,𝐶𝐶𝐶𝐶2. (4)
344
In typical CT examinations, σsta is less than 1%, σsys is 15%, and σsys,CT
345
is 25%; therefore, σt,CT becomes 30%. Although an accuracy of 30% is not
346
good, the nanoDotTM OSL dosimeter is expected to be useful for making direct
347
ESD measurements of patients undergoing CT examinations. Note that this
348
estimation is limited to experiments using a 320-row CT scanner
349
manufactured by Toshiba. For CT scanners of other manufacturers, the
350
applicability limit of the present results is unclear. In the next paragraph,
351
we describe the effective clinical applications for measuring patient doses
352
during CT scans.
For clinical application, it is important that nanoDotTM OSL dosimeters,
354
when placed on the human body, do not interfere with the ability to obtain
355
medical images. Metals (high-atomic-number materials) are known causes
356
of artifacts in images obtained in CT scans. The nanoDotTM OSL dosimeter
357
consists of relatively low-atomic-number materials; the detector region is
358
78.4% Al2O3 and 21.6% polyester with a density of 1.41 g/cm3 and a thickness
359
of 200 µm. The cover is composed of polyester with a density of 1.18 g/cm3
360
and a thickness of less than 2 mm [20]. These values are negligibly small
361
compared to those of the human body. Therefore, it is expected that no
362
artifacts will be present in the images. In fact, we could not detect additional
363
artifacts in the cross-sectional views in Fig. 6 D−G. The results represent a
364
valuable verification to support the application of the dosimeter in clinical
365
applications. In Fig. 6 B and C, the distributions of the ESDs are clearly
366
observed. These images are useful for the evaluation of doses, for education,
367
and so on. In the near future, we plan to measure the actual ESDs of
368
patients using the nanoDotTM OSL dosimeter, and the proper position in
369
which to place the dosimeter is now under consideration.
370
Finally, we discuss the future prospects for dose measurement using the
nanoDotTM OSL dosimeter. In all the X-ray examinations performed in
372
clinics, the most important dose is the effective dose administered to the
373
organs of the human body. By considering radiation-weighted factors [28]
374
concerning the organs of interest, an effective dose can be derived. During a
375
CT examination, the effective dose is estimated from the dose-length product
376
(DLP) using conversion coefficients reported by Christner et al. [29].
377
Moreover, the DLP is calculated from the volume CTDI, CTDIvol, and the
378
irradiated length during the CT scans. The entrance-skin dose was another
379
important dose to be evaluated, because one can measure the dose easily
380
compared to the CTDIvol. A relationship between the CTDIvol and the
381
entrance-skin dose was reported elsewhere [13]. The dose measured using
382
GafchromicTM film was the ESD, therefore we converted the ESD to the
383
entrance-skin dose using the following equation:
384
Entranse − skin dose = ESD ×(𝜇𝜇𝑒𝑒𝐶𝐶⁄ )𝜌𝜌 𝐶𝐶𝐶𝐶𝑠𝑠𝐶𝐶−𝐶𝐶𝑖𝑖𝐶𝐶𝐶𝐶𝐶𝐶𝑒𝑒
(𝜇𝜇𝑒𝑒𝐶𝐶⁄ )𝜌𝜌 𝑎𝑎𝑖𝑖𝑎𝑎 = ESD × 1.064. (5)
385
In this calculation, we assumed that the effective energy of CT X-rays was
386
approximately 50 keV, and the corresponding mass energy-absorption
387
coefficients were taken from the reference [30]. However, we did not
388
distinguish a difference between the entrance-skin dose and the ESD for the
measured value using the nanoDotTM OSL dosimeter, because the
390
experimental uncertainty of the measured value included the differences.
391
Then, as shown in Fig. 7, we preliminarily examined the relationship between
392
the CTDIvol and entrance-skin dose using the data derived in the present
393
experiments. The y axis shows the entrance-skin doses, where the solid and
394
open symbols represent the mean values of the nanoDotTM OSL dosimeters
395
and GafchromicTM film, respectively, and the x axis represents the CTDIvol,
396
which was determined in the CT equipment. A good correlation between the
397
CTDIvol and the entrance-skin doses was observed. The solid line represents
398
the relationship proposed previously by Westra et al. [13]. Our data are in
399
good agreement with their relationship. From this fact, one may conclude
400
that entrance-skin dose measurement is an indirect measurement method for
401
making effective dose evaluations for the whole body.
Our method using the
402
nanoDotTM OSL dosimeter is convenient; therefore, everyone can apply our
403
results for improving clinical CT examinations.
404
5 Conclusion
405
In conclusion, we evaluated the ability to measure the ESD of a patient
406
using a small OSL dosimeter called the nanoDotTM during CT scans. By
comparing ESDs measured using the nanoDotTM OSL dosimeter and
408
GafchromicTM film, the accuracy of the CT scans was found to be 25% for most
409
irradiation conditions. Considering this result in combination with previous
410
research on the evaluation of the energy and angular dependences, and
411
variability of the individual nanoDotTM OSL dosimeters, we concluded that
412
the nanoDotTM OSL dosimeter can measure the ESD of patients with total
413
uncertainties of 30%. Our results show the possibility of obtaining an
414
extremely large uncertainty when nanoDotTM OSL dosimeters are used under
415
the following conditions: PFs of 1.484 (64 rows), 1.388 (80 rows), and 1.390
416
(100 rows). Therefore, we suggest that the dosimeter should be used under
417
a PF of less than 1.000. In addition, we demonstrated visualization of the
418
ESD distributions with and without the dose reduction protocol proposed by
419
Toshiba. We also verified that there were no additional artifacts in the
cross-420
sectional CT images when the nanoDotTM OSL dosimeter was placed on
421
patients. These results can help us manage the exposure doses of patients.
422 423
Acknowledgement:
This work was supported by JSPS KAKENHI Grant Number 15K19205.
425 426
Conflict of interest:
427
T. Okazaki, T. Hashizume and I. Kobayashi are employees of Nagase
428
Landauer Ltd. and collaborating researchers.
References:
430
[1] Gonalez AB and Darby S. Risk of cancer from diagnostic X-ray: estimates
431
for the UK and 14 other countries, The Lancet. 2004;363:345-351.
432
(doi:10.1016/S0140-6736(04)15433-0)
433
[2] Uffmann M and Schaefer-Prokop C. Digital radiography: The balance
434
between image quality and required radiation dose, Eur. J. Radiol.
435
2009;72:202-208. (doi:10.1016/j.ejrad.2009.05.060)
436
[3] Gardner SJ, Studenski MT, Giaddui T, et al. Investigation into image
437
quality and dose for different patient geometries with multiple cone-beam
438
CT systems, Med. Phys. 2014;41(3):031908. (doi:10.1118/1.4865788)
439
[4] Goldman LW. Principles of CT: Radiation Dose and Image Quality, J.
440
Nucl. Med. Thecnol. 2007;35(4):213-225. (doi:10.2967/jnmt.106.037846)
441
[5] Mathews JD, Forsythe AV, Brady Z, et al. Cancer risk in 680000 people
442
exposed to computed tomography scans in childhood or adolescence: data
443
linkage study of 11 million Australians, The BMJ. 2013;346:f2360.
444
(doi:10.1136/bmj.f2360)
445
[6] McCollough CH, Leng S, Yu L, et al. CT Dose Index and Patient Dose:
They Are Not the Same Thing, Radiol. 2011;259:311-316.
447
(doi:10.1148/radiol.11101800)
448
[7] Koyama S, Aoyama T, Oda N, et al. Radiation dose evaluation in
449
tomosynthesis and C-arm cone-beam CT examinations with an
450
anthropomorphic phantom, Med. Phys. 2010;37(8). (doi:10.1118/1.3465045)
451
[8] McDermott A, White RA, Mc-Nitt-Gray M, et al. Pediatric organ dose
452
measurements in axial and helical multislice CT, Med. Phys.
453
2009;36(5):1494-1499. (doi: 10.1118/1.3101817)
454
[9] Tsalatoutas IA, Epistatou A, Nikoletopoulos S, et al. Measuring skin
455
dose in CT examinations under complex geometries: Instruments, methods
456
and considerations, Physica Medica. 2015;31:1005-1014.
457
(doi:10.1016/j.ejmp.2015.08.001)
458
[10] Tappouni R, Mathers B. Scan quality and entrance skin dose in thoracic
459
CT: A comparison between bismuth breast shield and posteriorly centered
460
partial CT scans, ISRN Radiology. 2013; article ID 457396.
461
(doi:10.5402/2013/457396)
462
[11] Duan X, Wang J, Christner JA, et al. Dose Reduction to Anterior
Surfaces With Organ-Based Tube-Current Modulation: Evaluation of
464
Performance in a Phantom Study, Am. J. Roentgenol. 2011;197:689-695.
465
(doi:10.2214/AJR.10.6061)
466
[12] Tominaga M, Kawata Y, Niki N, et al. Measurements of multidetector
467
CT surface dose distributions using a film dosimeter and chest phantom,
468
Med. Phys. 2011;38:2467. (doi:10.1118/1.3570769)
469
[13] Westra SJ, Li X, Gulati K et al. Entrance skin dosimetry and
size-470
specific dose estimate from pediatric xhest CTA, J. Cardiovasc. Comput.
471
Tomogr. 2014;8:97-107. (doi: 10.1016/j.jcct.2013.08.002)
472
[14] Ramac JP, Knezevic Z, Hebrang A et al. Radiation dose reduction by
473
using low dose CT protocol of thorax, Radiat. Meas. 2013;55:46-50.
474
(doi:10.1016/j.radmeas.2012.07.012)
475
[15] Cordasco C, Portelli M, Militi A, et al. Low-dose protocol of the spiral
476
CT in orthodontics: comparative evaluation of entrance skin dose with
477
traditional X-ray techniques, Prog. in Orthod. 2013;14:24. (doi:
0.1186/2196-478
1042-14-24)
479
[16] Takegami K, Hayashi H, Okino H, et al. Estimation of identification
limit for a small-type OSL dosimeter on the medical images by measurement
481
of X-ray spectra, Radiol. Phys. Technol. 2016; in press. (doi:
10.1007/s12194-482
016-0362-5)
483
[17] Takegami K, Hayashi H, Nakagawa K, et al. Measurement method of
484
an exposed dose using the nanoDot dosimeter, Eur. Con. Radiol. (EPOS).
485
2015. (doi:10.1594/ecr2015/C-0218)
486
[18] Hayashi H, Nakagawa K, Okino H, et al. High accuracy measurements
487
by consecutive readings of OSL dosimeter, Med. Imaging Inf. Sci.
488
2014;31(2):28-34. (doi:10.11318/mii.31.28)
489
[19] Nakagawa K, Hayashi H, Takegami K, et al. Fabrication of Annealing
490
Equipment for Optically Stimulated Luminescence (OSL) Dosimeter, Jpn. J.
491
Radiol. Technol. 2014;70(10):1135-1142.
492
(doi:10.6009/jjrt.2014_JSRT_70.10.1135)
493
[20] Hayashi H, Takegami K, Okino H, et al. Procedure to measure angular
494
dependences of personal dosimeters by means of diagnostic X-ray equipment,
495
Med. Imaging Inf. Sci. 2015;32(1):8-14. (doi:10.11318/mii.32.8)
496
[21] Takegami K, Hayashi H, Okino H, et al. Energy dependence
measurement of small-type optically stimulated luminescence (OSL)
498
dosimeter by means of characteristic X-rays induced with general diagnostic
499
X-ray equipment, Radiol. Phys. Technol. 2016;9:99-108.
500
(doi:10.1007/s12194-015-0339-9)
501
[22] Takegami K, Hayashi H, Okino H, et al. Practical calibration curve of
502
small-type optically stimulated luminescence (OSL) dosimeter for
503
evaluation of entrance-skin dose in the diagnostic X-ray, Radiol. Phys.
504
Technol. 2015;8:286-294. (doi:10.1007/s12194-015-0318-1)
505
[23] Giaddui T, Cui Y, Galvin J, et al. Comparative dose evaluations between
506
XVI and OBI cone beam CT systems using GafchromicTM XRQA2 films and
507
nanoDot optical stimulated luminescence dosimeters, Med. Phys.
508
2013:40:062102. (doi:10.1118/1.4803466)
509
[24] Tomic N, Devic S, DeBlois F, et al. Reference radiochromic film
510
dosimetry in kilovoltage photon beams during CBCT image acquisition, Med.
511
Phys. 2010,37:1083. (doi:10.1118/1.3302140)
512
[25] Yamashiro T, Miyara T, Honda O, et al. Adaptive Iterative Dose
513
Reduction Using Three Dimensional Processing (AIDR 3D) Improves Chest
CT Image Quality and Reduces Radiation Exposure, PLOS ONE.
515
2014;9(8):e105735. (doi:10.1371/journal.pone.0105735)
516
[26] Yamada Y, Jinzaki M, Hosokawa T, et al. Dose reduction in chest CT:
517
Comparison of the adaptive iterative dose reduction 3D, adaptive iterative
518
dose reduction, and filtered back projection reconstruction techniques, Eur.
519
J. Radiol. 2012;81:4185-4195. (doi:10.1016/j.ejrad.2012.07.013)
520
[27] D’Alessio D, Giliberti C, Soriani A, et al. Dose evaluation for skin and
521
organ in hepatocellular carcinoma during angiographic procedure, J. Exp.
522
Clin. Cancer Res. 2013;32:81. (doi:10.1186/1756-9966-32-81)
523
[28] Sabarudin A, Sun Z. Radiation dose measurement in coronary CT
524
angiography, World J. Cardiol. 2013;5(12):459-464.
525
(doi:10.4330/wjc.v5.i12.459)
526
[29] Christner JA, Kofler JM, McCollough CH. Estimating Effective Dose
527
for CT Using Dose-Length Product Compared With Using Organ Doses:
528
Consequences of Adopting International Commission on Radiological
529
Protection Publication 103 or Dual-Energy Scanning, Am. J. Rentgenol.
530
2010;194:881-889. (doi:10.2214/AJR.09.3462)
[30] Hubbell JH. Photon mass attenuation and energy-absorption
532
coefficients, The International Journal of Applied Radiation and Isotopes,
533
1982;33(11):1269-1290. (doi:10.1016/0020-708X(82)90248-4)
534 535
Figure Captions:
536
Fig. 1 Comparison of the calibrations of the nanoDotTM OSL dosimeter and
537
GafchromicTM film.
538
Fig. 2 Experimental setup for irradiating the nanoDotTM OSL dosimeters
539
and GafchromicTM film. The dosimeters and film were placed on a water
540
phantom.
541
Fig. 3 Photograph of the experiment in which the ESD distribution of the
542
body phantom was measured using nanoDotTM OSL dosimeters.
543
Fig. 4 Comparison of the ESDs measured using the nanoDotTM OSL
544
dosimeter (large solid circles) and GafchromicTM film (small open circles).
545
Dashed line indicates a mean value measured using the GafchromicTM film.
546
The values measured using the nanoDotTM OSL dosimeters are in good
547
agreement with those obtained using the GafchromicTM film.
548
Fig. 5 Evaluation of the accuracy of our method, in which the nanoDotTM
549
OSL dosimeter was used for CT scans. For each irradiation condition,
550
absolute values of the differences for ten dosimeters are plotted.
551
Fig. 6 Demonstration of two-dimensional ESD distributions on the body
phantom. Red and yellow bars represent high and low values, respectively.
553
(A) CT image, (B) ESD distribution of the normal scan, and (C) ESD
554
distribution using the dose reduction process proposed by Toshiba Ltd.
555
(Volume EC+AIDR3D). (D) and (E) Cross-sectional CT images with lung
556
window under irradiation conditions with and without the dose reduction
557
process, respectively. (F) and (G) Cross-sectional CT images with
558
mediastinal window under irradiation conditions with and without the dose
559
reduction process, respectively.
560
Fig. 7 Relationship between CTDIvol and entrance-skin dose. The
561
entrance-skin doses were derived from the measured values using the
562
nanoDotTM OSL dosimeters (solid symbols) and GafchromicTM film (open
563
symbols). The CTDIvol was calculated using the software installed in the
564
CT computer.
565
Table 1 Irradiation conditions in the CT scans.
“Counts” of nanoDot
“Pixel value” of
Gafchromic
TMfilm
General method
Calibration
Ionization chamber
X-ray quality of 3.0 mmAl
with uncertainty estimation
for different X-ray qualities
(different X-ray quality of CT)
Ionization chamber
X-ray quality of 7.2 mmAl
(the same X-ray quality of CT)
Entrance surface dose
(Air-kerma)
Entrance surface dose
(Air-kerma)
Fig. 1
nanoDot
TMOSL
Dosimeters
(10 dosimeters)
Gafchromic
TMFilm (XR-SP2)
10 c
m
Water phantom
45 cm
Fig. 2
0 10 20 30 40 50 0 20 40 60 80 100 GafchromicTM film
nanoDotTM OSL dosimeter
D o se [ m G y] Position [mm] 0.5×16-rows, PF=0.688 Mean value 0 10 20 30 40 50 0 20 40 60 80 100 GafchromicTM film
nanoDotTM OSL dosimeter
D o se [ m G y] Position [mm] 120 kV, 202 mAs(Eff.) 0.5×16-rows, PF=0.938 Mean value 0 10 20 30 40 50 0 20 40 60 80 100 GafchromicTM film
nanoDotTM OSL dosimeter
D o se [ m G y] Position [mm] 120 kV, 201 mAs(Eff.) 0.5×16-rows, PF=1.438 Mean value
b) 0.5 mm×32-rows
0 10 20 30 40 50 60 0 20 40 60 80 100 GafchromicTM filmnanoDotTM OSL dosimeter
D o se [ m G y] Position [mm] 120 kV, 198 mAs(Eff.) 0.5×32-rows, PF=0.656 Mean value 0 10 20 30 40 50 60 0 20 40 60 80 100 GafchromicTM film
nanoDotTM OSL dosimeter
D o se [ m G y] Position [mm] 120 kV, 201 mAs(Eff.) 0.5×32-rows, PF=0.844 Mean value 0 10 20 30 40 50 60 0 20 40 60 80 100 GafchromicTM film
nanoDotTM OSL dosimeter
D o se [ m G y] Position [mm] 120 kV, 202 mAs(Eff.) 0.5×32-rows, PF=1.406 Mean value
b-1) 0.656
b-2) 0.844
b-3) 1.406
d) 0.5 mm×80-rows
d-1) 0.637
d-2) 0.813
d-3) 1.388
0 10 20 30 40 50 0 20 40 60 80 100 GafchromicTM filmnanoDotTM OSL dosimeter
D o se [ m G y] Position [mm] 120 kV, 202 mAs(Eff.) 0.5×64-rows, PF=0.641 Mean value 0 10 20 30 40 50 0 20 40 60 80 100 GafchromicTM film
nanoDotTM OSL dosimeter
D o se [ m G y] Position [mm] 0.5×64-rows, PF=0.828 Mean value 0 10 20 30 40 50 0 20 40 60 80 100 GafchromicTM film
nanoDotTM OSL dosimeter
D o se [ m G y] Position [mm] 120 kV, 202 mAs(Eff.) 0.5×64-rows, PF=1.484 Mean value 0 10 20 30 40 50 60 0 20 40 60 80 100 GafchromicTM film
nanoDotTM OSL dosimeter
D o se [ m G y] Position [mm] 120 kV, 203 mAs(Eff.) 0.5×80-rows, PF=0.637 Mean value 0 10 20 30 40 50 60 0 20 40 60 80 100 GafchromicTM film
nanoDotTM OSL dosimeter
D o se [ m G y] Position [mm] 120 kV, 203 mAs(Eff.) 0.5×80-rows, PF=0.813 Mean value 0 10 20 30 40 50 60 0 20 40 60 80 100 GafchromicTM film
nanoDotTM OSL dosimeter
D o se [ m G y] Position [mm] 120 kV, 198 mAs(Eff.) 0.5×80-rows, PF=1.388 Mean value
f) 0.5 mm×160-rows
f-1) 0.806
f-2) 0.994
0 10 20 30 40 50 0 20 40 60 80 100 GafchromicTM filmnanoDotTM OSL dosimeter
D o se [ m G y] Position [mm] 120 kV, 203 mAs(Eff.) 0.5×100-rows, PF=0.810 Mean value 0 10 20 30 40 50 0 20 40 60 80 100 GafchromicTM film
nanoDotTM OSL dosimeter
D o se [ m G y] Position [mm] 120 kV, 201 mAs(Eff.) 0.5×100-rows, PF=1.390 Mean value 0 10 20 30 40 50 60 0 20 40 60 80 100 GafchromicTM film
nanoDotTM OSL dosimeter
D o se [ m G y] Position [mm] 120 kV, 201 mAs(Eff.) 0.5×160-rows, PF=0.994 Mean value 0 10 20 30 40 50 60 0 20 40 60 80 100 GafchromicTM film
nanoDotTM OSL dosimeter
D o se [ m G y] Position [mm] 120 kV, 198 mAs(Eff.) 0.5×160-rows, PF=0.806 Mean value
Fig. 4
0 10 20 30 0.688 0.938 1.438 A c c ur ac y [ Pitch Factor <9% <12% <12% 0 10 20 30 0.656 0.844 1.486 A c c ur ac y [ Pitch Factor <17% <13% <19% 0 10 20 30 0.641 0.828 1.484 A c c ur ac y [ Pitch Factor <25% <22% 0 10 20 30 40 50 60 0.637 0.813 1.388 A c c ur ac y [ % ] Pitch Factor 80 rows <22% <19% <41% 0 10 20 30 40 50 60 0.810 1.390 A c c ur ac y [ % ] Pitch Factor 100 rows <20% <38% 0 10 20 30 40 50 60 0.806 0.994 A c c ur ac y [ % ] Pitch Factor 160 rows <19% <17%
Fig. 5
Fig. 6
Without dose reduction
Without dose reduction
With dose reduction
With dose reduction
Without dose reduction
Fig. 7
20
30
40
50
10
15
20
25
30
35
40
E
nt
ra
nc
e-s
k
in do
s
e
[
m
e
a
s
u
red
w
it
h
na
n
oD
ot
CTDI
vol[mGy]
Westra et al.
80 100 160(Entrance-skin dose= 1.55×CTDI
16 380 202 15 0.938 580 201 23 1.438 32 260 198 21 0.656 340 201 27 0.844 570 202 45 1.406 64 260 202 41 0.641 330 199 53 0.828 600 202 95 1.484 80 260 203 51 0.637 330 203 65 0.813 550 198 111 1.388 100 330 203 81 0.810 560 201 139 1.390 160 320 198 129 0.806 400 201 159 0.994