30
Home care score predicts the advisability of home
care when it is difficult to predict it using the
functional independence measure score
Akiyoshi Matsugi
1)Keisuke Tani
2)Yoshiki Tamaru
1)Nami Yoshioka
3)Akira Yamashita
3)Nobuhiko Mori
4)Kosuke Oku
1)Masashi Ikeda
5)Yoshikazu Murakami
6)Shohei Nomura
6)Kiyoshi Nagano
1)1) Faculty of Rehabilitation, Shijonawate Gakuen University Hojo 5-11-10, Daitou City, Osaka 574-0011, Japan.
Tel.: +81-72-863-5043; Fax: +81-72-863-5022. Email: a-matsugi@reha.shijonawate-gakuen.ac.jp 2) Graduate School of Human and Environmental Studies, Kyoto University
3) Department of Rehabilitation, Bobath Memorial Hospital
4) Department of Rehabilitation Medicine, Wakayama Medical University 5) Okamoto Home Nursing Station
6) Department of Rehabilitation, Pegasus Rehabilitation Hospital
JAHS 7 (2): 30-36, 2016. Submitted Jul. 12, 2016. Accepted Sep. 10, 2016.
ABSTRACT:
Purpose: The aim of this study was to assess the role of the sub score of the home care score for the prediction of advisability of home care and to assess whether the it is useful for prediction when it is difficult to draw a high-precision prediction using the functional independence measure. Methods: In total, 148 subjects living at their home or in assisted-living facilities were analyzed. A binominal logistic regression analysis was conducted for all patients and a receiver operating characteristic analysis was conducted on the home care score of patients with a functional independence score ranging from 37–90, because, in this group, the ratio of home care was approximately 50 %. Result: Availability of a care provider, care provider’s motivation, bedroom availability, home environment, and verbal communication skills were selected for the binomial logistic regress analysis on the sub items of the home care score for the prediction. The receiver operating characteristic analysis revealed that the area under the curve was 0.89 and the optimal cutoff point was 11 (n=53). Using the optimal cutoff points, sensitivity was 0.65, specificity was 1.0, and positive predictive value was 1.0. Conclusion: The home care score is useful for the prediction of advisability of home care when it is difficult to predict the same using the score of the functional independence measure. Additionally, the care provider’s condition is important for home care.
31
INTRODUCTION
The home care score (HCS) was developed by the study group of the Ministry of Health and Welfare in Japan, in 1992, to comprehensively measure the care support conditions and the ability of activity of daily living (ADL) in people who require care for living in their own home. A previous study reported that the total HCS is useful for the prediction for advisability of home care with high-precision1-3). However, it is unclear which sub items of the HCS are the important for the prediction. Thus, the first aim of this study was to identify which sub items of the HCS contribute to the prediction of advisability of home care in one’s home.
The functional independence measure (FIM), which is commonly used in Japan, is frequently used not only for the evaluation of ADL, but also for the prediction for advisability of living at home in patients requiring family care4), because a change of one point in the total FIM score is equivalent to approximately 2 minutes of help from another person per day5). Further, the total FIM score reflects the quantity of necessary care for the patient. In other words, the FIM can generally be used to determine whether a person who has suffered an impediment can return home or has to live in an assisted-living facility after hospitalization6). However, prediction using the FIM at discharge from a rehabilitation hospital has been difficult because the ratio of returning home is approximately 50%7). Based on these findings, we aimed to explore if the HCS is a more precise predictor of advisability of home care when a high-precision prediction is difficult using the FIM score.
SUBJECTS AND METHOD
The study was performed in April 2014, in Osaka, Japan. The subjects included 148 elderly people who had received certification for long-term care. All subjects had been discharged from the hospital more than six months prior to the study and patients who had
lived at home with care for less than 6 months after hospital discharge were excluded. The number of subjects who lived at own home with care provided by their family and who lived in an assisted-living facility (4 nursing homes) were 76 (38 males and 38 females) and 72 (36 males and 36 females), respectively. The former was defined as the home care group and the latter as the facility care group.
Clinicodemographic parameters, including age, sex, underlying disease, number of co-resident before care was needed, the FIM score, and HCS, were recorded. The FIM score and HCS were measured by the physical therapist or occupational therapist in charge of the subject. The number of subjects with cerebrovascular disease, osteoarticular disease, intractable disease, respiratory disease, senility, metabolic disease, dementia, heart disease, spinal cord injury, cancer, and gastrointestinal disease in home care group were 48, 16, 5, 0, 0, 1, 2, 1, 3, 0, 0 and that in facility group were 40, 7, 3, 6, 5, 3, 2, 2, 0, 2, and 2, respectively. A t-test was conducted to determine whether there is difference between the home care and facility care groups in age and the number of co-residents. The alpha level was set at 0.05. The ADL ability of each subject was evaluated using the FIM. The HCS was used to measure the ability of the family to take care of the subject at home. The factors evaluated in order to obtain the HCS included the availability of a care provider; (1)the care provider’s health, (2)the availability of care provider, (3)the availability of a substitute care provider, (4)the
care provider’s motivation, (5)bedroom
availability, (6)home environment, (7)family income, excluding public pension, (8)the patient’s general conditions, including (8-A)the
ability to feed oneself, (8-B)bathing
(8-C)transfer, (8-D)dressing, (8-E)toilet use, (8-F) verbal communication skills, (8-G)mental status, (8-H)medical condition, (8-I)patient’s motivation.
32
conducted to determine whether the
advisability of family-based home care could be predicted based on the HCS sub score. Standardized partial regression coefficients [95 % confidence interval (CI)] and odds ratios (95% CI) were calculated to investigate what factor contributed to the advisability of home care. The alpha level was set at 0.05 for the statistical analyses.
Next, the ratio of home care was calculated according to subgroups with FIM scores of 18–36, 37–54, 55–72, 73–90, 91–108, and 109–126 to estimate the group with an approximately 50% ratio of home care. When we increase the number of the groups, there were some groups that the number of the subjects was around 5. Therefore, we adopted 6 groups to avoid this problem. Furthermore, the HCS of 1–3, 4–6, 7–9, 10–12, 13–15, 16–18, and 19–21to examine whether there is a point at which the ratio sharply changes, which would suggest that the method is an optimal sonar detector. Multiple z tests were conducted among the subgroups to elucidate the differences between the groups. The alpha level for the HCS was set at 0.05/21=0.002 and that for the FIM was set at 0.05/15=0.003, as determined by the Bonferroni correction. To determine the optimal cutoff scores for the HCS in the group in which the ratio of home care was approximately 50% based on the FIM score, ROC analyses were conducted in the group with an FIM score ranging from 37–90. The sensitivity and specificity were determined for each possible cutoff point. In addition, the area under the curve (AUC) was calculated for each ROC curve. The optimal cutoff points were obtained from the Youden index [maximum (sensitivity+specificity-1)]. A greater accuracy is reflected by a larger Youden index and a smaller distance to (0, 1)8). All statistical analyses were performed using the R(version 2.13.0; the R Foundation for Statistical Computing, Vienna, Austria).
The ethics committee of Shijonawate Gakuen
University approved all study protocols, and the study was conducted in accordance with the Helsinki Declaration. The patient information was entirely coded in order to ensure the anonymity of the subjects.
RESULTS
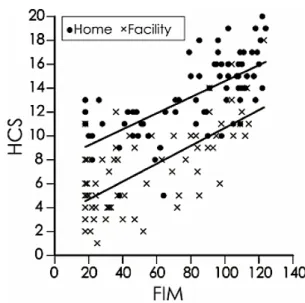
The age of the home care and facility care groups were 74.2±10.8 (mean ± standard deviation) and 77.7±10.6 years old, and there was no significant difference between these groups (p<0.05). The number of co-resident of the home care and facility care groups were 1.2±1.2 and 0.8±0.9, and there was significant difference between these groups (p=0.01). The FIM scores of the home care and facility care groups were 92.5±58 (median ± quartile deviation) and 40.5±23.8. The HCS in the home care and facility car groups were 13±11 and 7±4. Figure 1 shows a scatter diagram of the FIM score and HCS in the home care and facility care groups. The correlation coefficients of the FIM score and HCS in the home care and facility care groups were 0.68 (estimated
interval=0.54–0.79, p<0.001) and 0.67
(estimated interval=0.52–0.77, p<0.001), respectively.
Figure 1
Scatter diagram of the home care score and functional independence measure score in the home care and facility care groups. The upper and lower lines indicate the regression lines of the home and facility care groups, respectively.
33 Using a binominal logistic regression analysis, 5 items were found to be significant parameters, which were availability of a care provider (p<0.01), care provider’s motivation (p<0.05),
bedroom availability (p<0.05), home
environment (p<0.05), and verbal
communication skills (p<0.05). Table 1 indicates the standardized partial regression coefficients and odds ratios calculated by a binomial logistic regression analysis on all sub items.
Table 1. Sub scores of the home care score
Standardized partial
regression coefficient 95% CI p value Odds ratio 95% CI 1. Care provider’s health 0.1528 -1.1–1.7 0.6681 1.37 0.33–5.67 2. Availability of a care provider 1.4130 1.3–4.4 0.0004 ** 17.34 3.56–84.32 3. Availability of a substitute care provider 0.0872 1.2–1.7 0.7687 1.24 0.29–5.34 4. Care provider’s motivation 0.7757 0.01–1.0 0.0469 * 1.68 1.00–2.80 5. Bedroom availability 0.8819 0.4–3.8 0.0145 * 8.43 1.53–46.55 6. Home environment -1.0014 -4.2–-0.3 0.0223 * 0.10 0.01–0.72 7. Family income, excluding public pension 0.6748 -0.04–2.8 0.0577 3.89 0.96–15.82 8. Patient’s general condition
A: Ability to feed oneself 0.4721 -1.1–3.0 0.3704 2.59 0.32–20.87 B: Bathing 0.9076 -0.04–5.1 0.0537 12.64 0.96–166.43 C: Transfer -0.0409 -3.1–2.9 0.9567 0.92 0.05–18.56 D. Dressing -0.7979 -5.2–1.8 0.3490 0.18 0.006–6.23 E. Toilet use 1.3001 -1.0–6.3 0.1563 14.25 0.36–561.25 F: Verbal communication skills 0.8106 0.1–2.9 0.0354 * 4.38 1.11–17.36 G: Mental status -0.1127 -0.9–0.6 0.7254 0.87 0.40–1.89 H: Medical condition -0.4113 -2.4–0.6 0.2248 0.39 0.09–1.76 I: Patient’s motivation 0.4578 -0.5–1.8 0.2511 1.98 0.62–6.32 Constant term -7.1–1.9 0.0007 ** 0.01 0.001–0.15 *:p<0.05, **:p<0.01 Figure 2
Ratio of home care according to the functional independence measure score (A) and the home care score (B). Asterisks indicate significant differences.
34 Figure 2 shows the ratio of home care in the subgroups of the HCS and FIM score. The lowest ratio (0%) was observed in the HCS subgroup of 1–3, while the highest ratio (100%) was observed in the 19–21 subgroup. The ratios of home care in the HCS subgroups of 13–15, 16–18, and 19–21 were significantly higher than those in the 1–3, 4–6, and 7–9 subgroups, and that in the 10–12 subgroup was significantly higher than those in the 1–3 and 4–6 subgroups. The lowest ratio (approximately 20%) of the FIM score was observed in the 18–36 subgroup, while the 108–126 subgroup had the highest ratio (approximately 75%). The ratios of home care in the FIM subgroups of 73–90, 91–108, and 109–126 were significantly
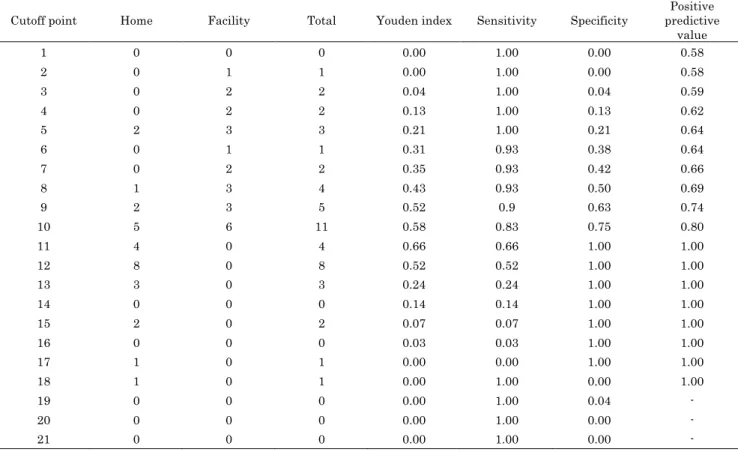
higher than that in the 18–36 subgroups. The results of the ROC curve analyses of the different cutoff points of the HCS for identifying subjects, including the Youden index, sensitivity, specificity, and positive predictive value, have been shown in Table 2. The ROC curves presented in Figure 3 were constructed based on the data of the HCS that the number of home care and facility care were 24 and 29. The AUC for the HCS was 0.89. The optimal cutoff points of HCS were 11. The points were selected based on the maximum Youden index in the HCS, which was 0.66 (sensitivity=0.66, specificity=1.0). Using the optimal cutoff points, the positive predictive values of the HCS and FIM were 1.0.
Table 2. Receiver operating characteristic curve analysis of the home care score to determine the most appropriate cutoff score when it is difficult to predict using the functional independence measure score
Cutoff point Home Facility Total Youden index Sensitivity Specificity predictive Positive value 1 0 0 0 0.00 1.00 0.00 0.58 2 0 1 1 0.00 1.00 0.00 0.58 3 0 2 2 0.04 1.00 0.04 0.59 4 0 2 2 0.13 1.00 0.13 0.62 5 2 3 3 0.21 1.00 0.21 0.64 6 0 1 1 0.31 0.93 0.38 0.64 7 0 2 2 0.35 0.93 0.42 0.66 8 1 3 4 0.43 0.93 0.50 0.69 9 2 3 5 0.52 0.9 0.63 0.74 10 5 6 11 0.58 0.83 0.75 0.80 11 4 0 4 0.66 0.66 1.00 1.00 12 8 0 8 0.52 0.52 1.00 1.00 13 3 0 3 0.24 0.24 1.00 1.00 14 0 0 0 0.14 0.14 1.00 1.00 15 2 0 2 0.07 0.07 1.00 1.00 16 0 0 0 0.03 0.03 1.00 1.00 17 1 0 1 0.00 0.00 1.00 1.00 18 1 0 1 0.00 1.00 0.00 1.00 19 0 0 0 0.00 1.00 0.04 - 20 0 0 0 0.00 1.00 0.00 - 21 0 0 0 0.00 1.00 0.00 -
35
Figure 3
Operating characteristic curves of the home care score. AUC: area under the curve.
DISCUSSION
The binominal logistic regression analysis revealed that availability of a care provider,
care provider’s motivation, bedroom
availability, home environment, and verbal communication skills contribute to the possibility of home care. Furthermore, the odds ratio of availability of a care provider was the highest predictor among all items. These findings indicate that one of the important factors for prediction of home care is the condition of the care provider. Therefore, we should evaluate family condition of the caregiver during the rehabilitation process. The FIM score has also been previously demonstrated to be a strong predictor of the advisability of home care 9-13). However, the FIM score may suggest only approximately 50 % of the probability of home care, which was 37–90 and the number of home care and facility care were 24 and 29 in the present study. On the other hand, in such cases, the HCS is a useful predictor of home care because the AUC of the ROC for the HCS was 0.89 (n=53). An AUC between 0.7 and 0.9, is considered moderately optimal, while that greater than 0.9 is considered high14). Thus, based on these findings, the precisions of prediction with HCS can be considered moderate when the
prediction is difficult using the FIM.
In some cases, even though the FIM score is low, the person who suffered an impediment can still return home if there is adequate support by co-resident household members9, 10), indicating that the FIM, which cannot evaluate the quantity of care provided by the family, may be insufficient for the prediction of advisability of home care. On the other hand, the HCS can measure not only the ADL of the subject but can also comprehensively measure the conditions of the care provided. Therefore, our results suggest that a scale to evaluate ADL comprehensively and the condition of the care provided, such as the HCS, is necessary to predict the advisability of home care successfully when the possibility of returning home cannot be predicted by a measure of ADL, such as the FIM.
In conclusion, comprehensively measuring the condition of the care provided and the ADL ability of the subject, for example using the HCS, is required for accurate prediction of the advisability of home care when the same is difficult using the FIM score.
ACKNOWLEDGEMENTS
This work was supported by the Osaka Gas Welfare Foundation.
REFERENCES
1) Miyamori T, Okajima S: Validity of a home care score system to assess the potential for successful care of patients after discharge from hospital. Jap. J. Prim. Care. 15: 58-64, 1992.
2) Matsugi A, Tani K, Tamaru Y, et al.: Prediction of advisability of returning home using the home care score. Rehabil. Res. Pract. 2015: 501042, 2015.
3) Matsugi A, Tani K, Yoshioka N, et al.:
Prediction of destination from
comprehensive rehabilitation hospital using home care score. J. Phys. Ther. Sci. in press, 2016.
36 4) Saji N, Kimura K, Ohsaka G, et al.:
Functional independence measure scores predict level of long-term care required by patients after stroke: a multicenter retrospective cohort study. Disabil. Rehabil. 37(4): 331-337, 2015.
5) Granger CV, Cotter AC, Hamilton BB, Fiedler RC: Functional assessment scales: a study of persons after stroke. Arch. Phys. Med. Rehabil. 74: 133-138, 1993.
6) Smith PM, Ottenbacher KJ, Cranley M, et al.: Predicting follow-up living setting in patients with stroke. Arch. Phys. Med. Rehabil. 83: 764-770, 2002.
7) Chumney D, Nollinger K, Shesko K, et al.: Ability of the Functional Independence
Measure to predict rehabilitation
outcomes after stroke: A review of the literature. J. Rehabil. Res. Dev. 47: 17-30, 2010.
8) Youden W: Index for rating diagnostic tests. Cancer. 3: 32-35, 1950.
9) Henley S, Pettit S, Todd-Pokropek A, Tupper A: Who goes home? Predictive factors in stroke recovery. J. Neurol. Neurosurg. Psychiatry. 48: 1-6, 1985. 10) Nguyen TA, Page A, Aggarwal A, Henke
P: Social determinants of discharge destination for patients after stroke with low admission FIM instrument scores. Arch. Phys. Med. Rehabil. 88: 740-744, 2007.
11) Koyama T, Sako Y, Konta M, Domen K:
Poststroke discharge destination:
functional independence and
sociodemographic factors in urban Japan. J. Stroke. Cerebrovasc. Dis. 20: 202-207, 2011.
12) Matsugi A, Tani K, Mitani Y: Revision of the predictive method improves precision in the prediction of stroke outcomes for
patients admitted to rehabilitation
hospitals. J. Phys. Ther. Sci. 26: 1429-1431, 2014.
13) Sonoda S, Saitoh E, Nagai S: Stroke
outcome prediction using reciprocal number of initial activities of daily living status. J. Stroke. Cerebrovasc. Dis. 14: 8-11, 2005.
14) Fischer JE, Bachmann LM, Jaeschke R: A readers’ guide to the interpretation of diagnostic test properties: clinical example of sepsis. Intensive. Care. Med. 29: 1043-1051, 2003.