Vol. 64
No. 1
March 2020
船と海上気象
船と海上気象
横浜港に停泊するクイーン・エリザベスと出港するコスタ・ネオロマンチカ (2019.5.5)Queen Elizabeth anchored and Costa neoRomantica departing at Yokohama Port (5 May 2019)
THE SHIP AND
MARITIME METEOROLOGY
THE SHIP AND
MARITIME METEOROLOGY
気 象 庁
Japan Meteorological Agency
目
次
Contents
2019 年の台風のまとめ ・・・・・・・・・・・・・・・・・・・・・・・・・・・・・・・・・・・・・・・・・・・・ 1
台風進路予報の予報円改善について ・・・・・・・・・・・・・・・・・・・・・・・・・・・・・・・・・ 4
海上分布予報の領域拡張について ・・・・・・・・・・・・・・・・・・・・・・・・・・・・・・・・・・・ 6
船舶気象報の利用例の紹介 ・・・・・・・・・・・・・・・・・・・・・・・・・・・・・・・・・・・・・・・・・ 8
2018 年秋~2019 年春に発生したエルニーニョ現象 ・・・・・・・・・・・・・・・・・・・ 11
「船舶気象観測指針(英語版)」を改訂しました ・・・・・・・・・・・・・・・・・・・・・・ 15
Summary of the 2019 Typhoon Season ・・・・・・・・・・・・・・・・・・・・・・・・・・・・・ 1
Improvement of TC track-forecast probability circles ・・・・・・・・・・・・・・・
4
Expansion of Marine Weather Forecast Distribution Maps ・・・・・・・・・・・・・・・ 6
Utilization of Ships’ Real-Time Weather Reports ・・・・・・・・・・・・・・・・・・・・・・・ 8
Development of an El Niño event
occurring
from boreal autumn 2018 to spring 2019 ・・ 11
Update of Guide to Weather Observations for Ships ・・・・・・・・・・・・・・・・・・・ 15
第 64巻 第 1号 船 と 海 上 気 象 二 〇 二 〇
Ab
ou
t T
his
B
ull
eti
n
船舶に対し気象知識や気象情報利用の普及を行うことを目的とした広報誌 です。主として船舶乗組員の方々を対象に、海上気象観測・通報の方法や、 気象庁の提供する気象情報、海洋情報の最新の状況などをお知らせしていま す。すべての記事は、和英併記となっています。発行は、3 月と 9 月の年 2 回です。 読者の皆様のご意見を取り入れながら、さらに親しみやすい広報誌にして いきたいと思いますので、よろしくお願いします。 なお、本誌は、下記ウェブサイトからもご覧になることができます。 https://marine.kishou.go.jp/jp/fune-jp.htmlつ
い
て
This bulletin aims to promote useful marine weather observations/reports from ships and familiarize readers with weather and marine information provided by JMA. The publication mainly covers topics of interest to mariners, marine weather observations, recent announcements about JMA’s marine weather services, and more. All articles appear both in English and in Japanese. The bulletin is issued twice a year, in March and September.
We make constant efforts to improve the bulletin in order to make it more accessible to all our readers. Thank you for your continued support.
This bulletin is also available at the following website: https://marine.kishou.go.jp/en/fune-en.html 令和 2 年 3 月 31 日発行 編集兼
気
象
庁
印刷所 株式会社 総北海 東京支店 発行者 (住所) 東京都墨田区江東橋 4 丁目 25−10 〒100-8122 東京都千代田区大手町 1 丁目 3 番 4 号 ○リサイクル特性の表示:紙へリサイクル可〒
100-8122 東京都 千代田区 大手町 1-3-4
気象庁
地球環境・海洋部 海洋気象課
「船と海上気象」担当
Marine Division, Global Environment and Marine Department
Japan Meteorological Agency
1-3-4 Otemachi, Chiyoda-ku, Tokyo 100-8122
Phone: +81 3 3212 8341 Ext. 5144 Telefax: +81 3 3211 3047
Email : [email protected] URL : https://marine.kishou.go.jp/
問
い
合
わ
せ
先
Conta
ct
us
52000138_fune64-1#hyou1-4.indd 4-6 2020/02/25 13:30:340 1 2 3 4 5 6 7 1 2 3 4 5 6 7 8 9 10 11 12 2019 Average (1981-2010) 月
2019 年の台風のまとめ
Summary of the 2019 Typhoon Season
気象庁 予報部 予報課 アジア太平洋気象防災センター Tokyo Typhoon Center, Forecast Division, Forecast Department, Japan Meteorological Agency
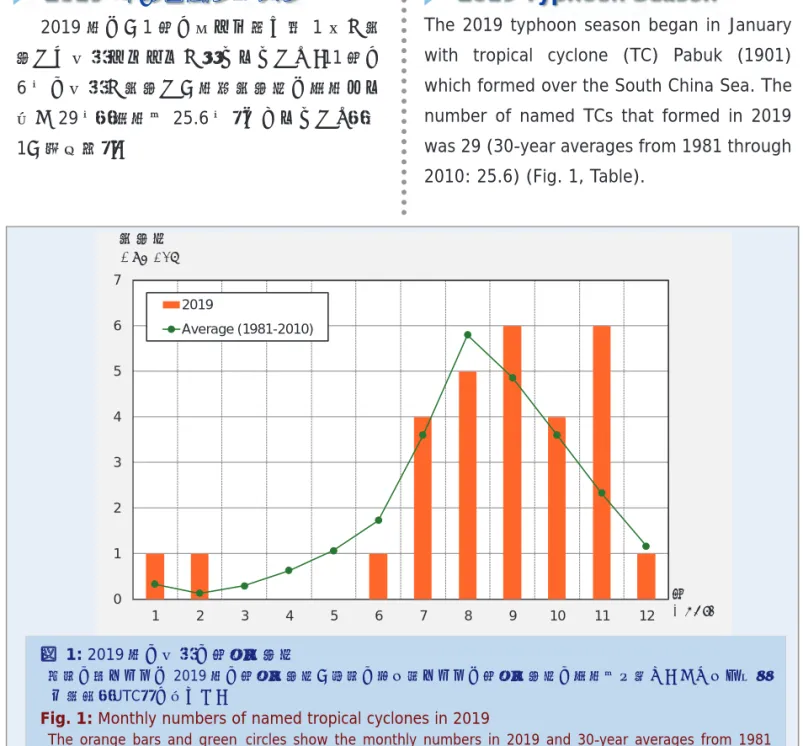
2019 年は、1 月に南シナ海で第 1 号が発 生して台風シーズンが始まりました。11 月に 6 個の台風が発生し、年間発生数は平年より 多い29 個(平年値 25.6 個)となりました(図 1、表参照)。
2019 年の台風シーズン
図 1: 2019 年の台風の月別発生数 橙色の棒グラフは2019 年の月別発生数、緑色の折れ線グラフは月別発生数の平年値を示す。いずれも協定 世界時(UTC)に基づく。Fig. 1: Monthly numbers of named tropical cyclones in 2019
The orange bars and green circles show the monthly numbers in 2019 and 30-year averages from 1981 through 2010, respectively.
Month
2019 Typhoon Season
The 2019 typhoon season began in January with tropical cyclone (TC) Pabuk (1901) which formed over the South China Sea. The number of named TCs that formed in 2019 was 29 (30-year averages from 1981 through 2010: 25.6) (Fig. 1, Table).
北西太平洋や南シナ海で発生する台風は、この海域を航行する船舶にとって最も注意すべ き自然現象です。台風についての理解を深め、災害や海難事故の防止に役立てていただくた
め、2019 年の台風について概略を紹介します。
It is vital for mariners to understand features of tropical cyclones (TCs) to prepare against sea disasters. This article summarizes the 2019 typhoon season in the western North Pacific and the South China Sea.
発生数 Number
2
-台風 存在期間
(国際標準時) Central Pressure Max Winds
中心気圧 最大風速
UTC Day Month UTC Day Month (hPa) (kt) TS Pabuk (1901) 06 01 Jan - 18 04 Jan 996 45 TY Wutip (1902) 18 19 Feb - 06 28 Feb 920 105 TS Sepat (1903) 12 27 Jun - 06 28 Jun 994 40 TS Mun (1904) 06 02 Jul - 06 04 Jul 992 35 TS Danas (1905) 06 16 Jul - 18 20 Jul 985 45 TS Nari (1906) 18 25 Jul - 06 27 Jul 998 35 TS Wipha (1907) 18 30 Jul - 12 03 Aug 985 45 TY Francisco (1908) 12 02 Aug - 00 07 Aug 970 70 TY Lekima (1909) 06 04 Aug - 18 12 Aug 925 105 TY Krosa (1910) 06 06 Aug - 12 16 Aug 965 75 STS Bailu (1911) 06 21 Aug - 18 25 Aug 985 50 TS Podul (1912) 00 28 Aug - 00 30 Aug 992 40 TY Lingling (1913) 00 02 Sep - 00 08 Sep 940 95 TS Kajiki (1914) 12 02 Sep - 12 03 Sep 996 35 TY Faxai (1915) 18 04 Sep - 00 10 Sep 955 85 TS Peipah (1916) 00 15 Sep - 12 16 Sep 1000 35 TY Tapah (1917) 00 19 Sep - 00 23 Sep 970 65 TY Mitag (1918) 00 28 Sep - 06 03 Oct 965 75 TY Hagibis (1919) 18 05 Oct - 03 13 Oct 915 105 TY Neoguri (1920) 00 17 Oct - 12 21 Oct 970 75 TY Bualoi (1921) 06 19 Oct - 12 25 Oct 935 100 STS Matmo (1922) 18 29 Oct - 06 31 Oct 992 50 TY Halong (1923) 12 02 Nov - 00 09 Nov 905 115 TY Nakri (1924) 18 05 Nov - 00 11 Nov 975 65 TY Fengshen (1925) 00 12 Nov - 12 17 Nov 965 85 TY Kalmaegi (1926) 12 14 Nov - 00 20 Nov 975 70 STS Fung-wong (1927) 00 20 Nov - 12 22 Nov 990 55 TY Kammuri (1928) 00 26 Nov - 18 05 Dec 950 90 TY Phanfone (1929) 12 22 Dec - 00 28 Dec 970 80
Tropical Cyclone Duration Peak Intensity 最盛期
表: 2019 年の台風一覧
TS、STS、TY 及び TY(猛烈な勢力)は、台風の最盛期の強さ(最大風速 34 ノット以上 48 ノット未満、48 ノット以上64 ノット未満、64 ノット以上 105 ノット未満及び 105 ノット以上)を示す。
Table: Named tropical cyclones in 2019
TS (tropical storm), STS (severe tropical storm) and TY (typhoon, very strong typhoon) and TY (violent typhoon) indicate tropical cyclone peak intensities with maximum winds reaching 34 kt to 47 kt, 48 kt to 63 kt, 64 kt to 104 kt and 105 kt or more, respectively.
日本への接近数は平年より多い15 個(平 年値11.4 個)で、上陸数は、平年値(2.7 個) を上回る5 個(第 6 号、第 8 号、第 10 号、 第15 号、第 19 号)でした。 強い勢力まで発達した台風は17 個で、そ のうち 4 個の台風(第 2 号、第 9 号、第 19 号、第 23 号)が猛烈な勢力まで発達しまし た。
Fifteen TCs approached Japan (30-year av-erage: 11.4), of which five made landfall (30-year average: 2.7).
Seventeen TCs reached typhoon intensity, of which four reached “violent typhoon” in-tensity (Table).
気象庁は、インマルサットセーフティネッ ト、ナブテックス、漁業無線、漁業気象情報、 気象庁気象無線模写通報(JMH)、テレビ・ラ ジオ及びインターネットを通じて台風に関 する情報を提供しています。船舶の安全な航 行や早期の避難のため、常に最新の台風情報 を利用していただくようお願いします。
気象庁が提供する台風情報
図 2: 2019 年の台風経路図 数字は台風番号、点線は熱帯低気圧の期間を示す。赤、橙の線は、台風第15 号、第 19 号の各経路を示す。Fig. 2: Tracks of tropical cyclones in 2019
The figures represent the last two digits of tropical cyclone identification numbers. The red and orange lines show the tracks of Faxai (1915) and Hagibis (1919), respectively.
The Japan Meteorological Agency (JMA) pro-vides information regarding TCs in many ways including SafetyNET, NAVTEX, radio fac-simile (JMH), TV, radio and the Internet. To support safe navigation and prompt evacua-tion in the event of severe weather condi-tions, please obtain and use the most recent TC information.
Typhoon Information Issued
by JMA
Typhoon Faxai (1915), which made landfall on Chiba Prefecture, brought strong winds, and Typhoon Hagibis (1919), which made landfall on the Izu Peninsula, brought heavy rain (Fig. 2). また、強い勢力で千葉市付近に上陸した台 風第 15 号は房総半島を中心に暴風による被 害をもたらし、伊豆半島に上陸した台風第19 号は、東日本や東北地方を中心に大雨による 被害をもたらしました。(図2 参照)。
4
-台風進路予報の予報円改善について
Improvement of TC track-forecast probability circles
気象庁 予報部 予報課
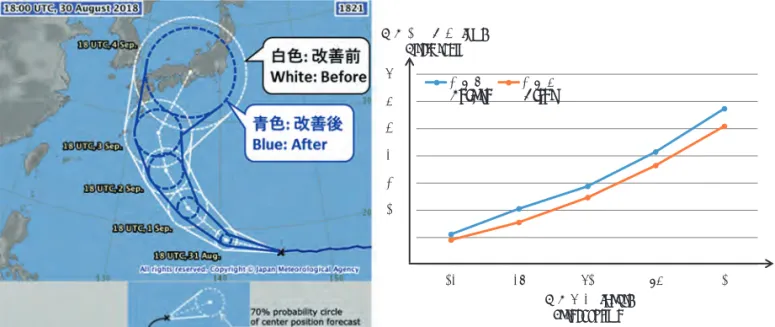
Forecast Division, Forecast Department, Japan Meteorological Agency JMA issues information on forecast relia-bility as well as forecast itself in tropical cy-clone (TC) track forecasts. Forecast reliability is expressed using probability circles to indi-cate expected TC center positions with 70% probability. JMA conducted following improve-ments on the circle radii and expression of forecast reliability in June 2019.
JMA’s TC track forecasts have improved in recent years with the adoption of a new su-percomputer in 2018, enhancement of nu-merical weather prediction (NWP) models and better utilization of model output. According to the latest TC track forecast verification re-sults, probability-circle radii can be reduced by an average of around 20% (Fig. 1).
JMA expresses forecast reliability with smaller circles for more certain forecast situa-tion. The circle radii is estimated statistically based on recent TC track forecast verification results. The previous method of determina-tion for individual categories based mainly on TC direction and speed was changed to esti-mation using variation inforesti-mation from the outputs of multiple NWP models. This enables consideration of actual atmospheric circula-tion in forecast reliability with circle radii as a metric (Fig. 2). 気象庁は、台風の進路予報において、予報 そのものに加えて、予報の信頼度に関する情 報もお伝えしています。予報の信頼度に関し ては、台風の中心が 70%の確率で入ると予 想される範囲を「予報円」として表現してい ます。気象庁は、予報円の大きさと予報の信 頼度の表現について、令和元年6 月に以下の 改善を行いました。 平成30 年に運用を開始した新しいスーパ ーコンピュータの利用や数値予報モデルの 改良及びその利用手法の改善によって、近 年、台風進路予報の精度は向上しています。 これを踏まえ、最新の進路予報の検証結果を 用いることで、予報円の半径がこれまでより も平均して約20%小さくなりました(図 1)。 予報円は、予報が適中しやすい状況で小さ く、適中しにくい状況で大きくすることで予 報の信頼度を表現しています。予報円の大き さは、過去の台風進路予報の精度を基に統計 的に算出しています。従来は主に台風の進行 方向と速度毎に算出していましたが、数値予 報モデルで進路予報を複数行った結果のば らつきを基に算出する手法に変更しました。 その結果、実際の大気の流れに応じた予報の 信頼度を予報円に反映できるようになりま した(図2)。
予報円の絞り込み
予報の信頼度をより的確に表現
Smaller probability circles
Appropriate expression of
forecast reliability
0 100 200 300 400 500 600 700 24 48 72 96 120 改善前 改善後 予報時間 [hour] Forecast time 予報円の半径 [km] Circle radii Before After 図1: 左図は、改善前後の予報円の変化例を示し、白色が改善前、青色が改善後。右図は、改善前後の 平均予報円半径の変化を示し、青色が改善前、オレンジ色が改善後。
Fig. 1: Left: Changes in probability circles
Right: Changes in mean probability circle radii
図2: 数値予報モデルによる複数の進路予報のばらつき具合と改善前後の予報円のイメージ
Fig. 2: Variation from multiple NWP model outputs and probability circles before and after
6
-海上分布予報の領域拡張について
Expansion of Marine Weather Forecast Distribution Maps
気象庁 予報部 予報課 Forecast Division, Forecast Department, Japan Meteorological Agency
The Japan Meteorological Agency (JMA) ex-panded the coverage of its Marine Weather Forecast Distribution Maps to incorporate the Ogasawara Islands on 4th June 2019.
Marine weather forecasts and warnings were not previously issued for this remote area due to a scarcity of observation data. Thanks to today’s higher resolution in weather satellite observation and more accu-rate numerical prediction, JMA now provides forecasts for the region. As standard, the forecasting resolution is 0.5 degrees (incor-porating winds, wave heights, visibility and ic-ing) with a lead time of 24 hours ahead at 6- hour intervals. 気象庁では、2019 年 6 月 4 日から、従来 の地方海上分布予報に、小笠原海域を加え て、海上分布予報という名称で分布予報の発 表を開始しました。拡張した海域は、概ね北 緯23.5 度から北緯 30.5 度、東経 138.5 度か ら146 度に相当します。 小笠原諸島近海に対しては、地方海上警 報、地方海上予報は発表していませんでした が、ひまわり8号の運用による衛星観測デー タの精密化の他、数値予報の精度向上によ り、地方海上予報区の範囲外にあたる外洋に ついても、詳細な分布予報が可能となりまし た。 海上分布予報の要素、時間間隔、解像度は、 従来の地方海上分布予報と変更なく、0.5 度 格子単位で、風、波、視程(霧)、着氷につい 左図: 海上分布予報(波浪)右図: 従来の地方海上分布予報(波浪) 左図の赤枠で囲われた海域が、今回拡張された小笠原海域を示しています。 Left Fig. : Expanded Marine Weather Forecast Distribution Maps (wave heights) Right Fig. : Previous version (wave heights)
The area outlined in red on the left incorporates the Ogasawara Islands as added in the
expanded version.
Marine Weather Forecast Distribution Maps are published online at
https://www.data.jma.go.jp/fcd/yoho/umim esh/en/ て、24 時間先まで 6 時間間隔で提供してい ます。 また、海上分布予報は気象庁ホームペー ジでご覧いただけます。 https://www.data.jma.go.jp/fcd/yoho/umim esh/jp/ 左図: 海上分布予報(風向・風速)右図: 従来の地方海上分布予報(風向・風速) 左図の赤枠で囲われた海域が、今回拡張された小笠原海域を示しています。 Left Fig. : Expanded Marine Weather Forecast Distribution Maps (winds) Right Fig. : Previous version (winds)
The area outlined in red on the left incorporates the Ogasawara Islands as added in the expanded version.
8
-概要
船舶による気象観測は、気象庁が発表す る海上警報や予報の作成、地球温暖化など の研究・調査などを行う上で重要な役割を 果たしています。本記事では、船舶からい ただいた船舶気象報の利用例を紹介しま す。船舶気象報の利用
気象情報の作成に必要となる作業はまず、 現在の気象状況、すなわち実況を把握するた めに、天気図を描くことから始まります。 天気図は、船舶等の観測データを基に、コ ンピュータのシミュレーション結果(数値予 報)で補いながら描いていきます。利用して いる観測データの中でも、洋上の気象を直接 観測している船舶の観測データは、最も重要 視されます。 それでは、天気図を描く時に、船舶気象 報がどのように利用されているか、二つの 例を通してご紹介しましょう。・利用例
1(台風および強風域の解析)
図1 は、2019 年 9 月 19 日 06UTC(日本 時間15 時)の天気図と気象衛星画像を重ね た図です。また右上の図は、同時刻のアジ ア太平洋地上天気図です。オレンジ色の円 は台風に伴う風速30 ノット以上の強風域を 示しています。この時刻に台風第17 号の発 生に関する情報を発表しました。船①で観 測された風は、風速35 ノットで台風に巻き 込むような風向となっており、台風発生に 関して、位置や強さ、強風域の大きさのIntroduction
Ships’ weather observation data play an im-portant role in marine weather warnings issu-ance, forecasting and research on global warming. This article provides examples of how such data are used.
Usage of Real-Time
Weather Reports
Weather forecasting begins with the formula-tion of weather charts to help clarify atmos-pheric conditions.
Such charts are based on in-situ observa-tion data from ships and other sources, and also involve the use of computer simulation (i.e. numerical prediction) if in-situ data are scarce. Marine weather observation data are the most reliable and valuable type.
Example 1: Typhoon Analysis and
Identification of Strong-wind Areas
Figure 1 shows a weather chart for 19 Sep. 2019 06 UTC superimposed onto a weather satellite image, with a magnified weather chart shown in the upper right. The orange circle shows an area of strong wind (30 kt or more) for the time when a formation bulletin for the year’s 17th typhoon was issued. Ship 1 reported 35 kt winds moving counter-clock-wise to the typhoon. This was a critical obser-vation in identification of the typhoon and analysis of its position/intensity.
Data from wind observations by ships 2, 3
船舶気象報の利用例の紹介
Utilization of Ships’ Real-Time Weather Reports
気象庁 予報部 予報課/地球環境・海洋部 海洋気象課 Forecast Division, Forecast Department and Marine Division, Global Environment and Marine Department
図1: 天気図に衛星画像を重ねた図、アジア太平洋地上天気図(拡大・抜粋)(右上) Fig. 1: Weather chart superimposed on a weather satellite image.
Upper right: Enlarged weather chart.
判断資料の一つとして使われました。 また、東シナ海の3 隻は、船②は 40 ノッ ト、③35 ノット、④35 ノットの風速を観測 しています。こちらは、台風からは離れて おり、台風が直接の要因ではなく、台風と 大陸の高気圧との間で気圧の傾きが急にな っていることが要因となった強風です。気 象庁予報部では同日17 時 27 分に、アジア 太平洋地上天気図上の波線で囲まれた領域 に、北または北東の風35 ノットの海上強風 警報を発表しました。
・利用例
2(前線解析)
続いて、船舶気象報を基に寒冷前線の位置 の解析精度を上げたケースです。寒冷前線 は、冷たい気団が暖かい気団に向かって移動 する際に発生する気団の境界です。 図 2 の左右図はそれぞれ 2019 年 10 月 9 日00UTC と 06UTC の天気図の寒冷前線付近 を拡大し気象衛星画像を重ね合わせた図で す。また、図2 の中央上図は、9 日 00UTC(日 本時間09 時)のアジア太平洋地上天気図をand 4 on the East China Sea indicated wind speeds of 35 kt and above in association with the steep atmospheric pressure gradient be-tween a high-pressure area over the Chinese continent and the typhoon (rather than exclu-sively with the typhoon itself). A strong-wind warning was issued for the rectangular area in the chart.
Example 2: Front Analysis
This example highlights how marine observa-tion data improved accuracy in locating a cold front (i.e., the boundary of a cold-air mass pushing into a warm-air mass).
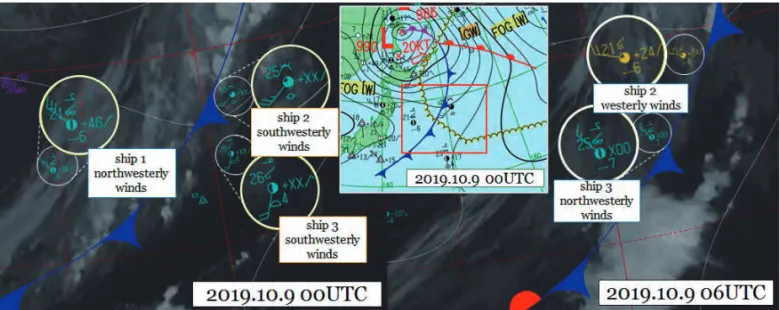
Figure 2 shows weather charts for 9 Oct. 2019 00 UTC and 06 UTC, with magnified rep-resentations superimposed on a weather sat-ellite image to the right and left and a chart for 00 UTC in the middle. A low-pressure area is observed over the Sea of Okhotsk at 49°N 144°E with a cold front extending to the area south of Tokyo.
10 -示しています。00UTC において、オホーツク 海の北緯49 度東経 144 度の低気圧は前線を 伴っており、寒冷前線が関東の南まで延びて います。 00UTC の船①は気温 21 度で北西の風、船 ②と③は、気温25 度、26 度で、南南西~南 西の風を観測しています。①は寒冷前線の冷 たい気団側、②③は暖かい気団側と判断さ れ、その間に前線を引いています。気象衛星 画像では、大まかにしかわからない前線の位 置が、船舶気象観測報により正確にわかりま した。 また②③は、00UTC では寒冷前線の東側に 位置していましたが、06UTC ではどちらも寒 冷前線の西側に位置しています。②③とも、 00~06UTC の間に寒冷前線を通過し、両船と も南南西~南西から西~北西への風向変化、 ②は摂氏25 度から 21 度へ、③は摂氏 26 度 から25 度へ、気温の低下を観測しました。 寒冷前線の通過時はこのように風向が急 変することがあり注意が必要です。
To the west of this front, ship 1 reported 21
°
C northwesterly winds, while ships 2 and 3 respectively reported 25 and 26°
C winds along with southwesterly winds at 00 UTC. These observation data contributed to identi-fication of the cold front’s position with greater precision than would have been pos-sible from weather satellite imagery alone.Ships 2 and 3 were east of the cold front at 00 UTC and west of the it six hours later due to its eastward shift during this time. Their data showed temperature decreases from 26 to 25
°
C and from 25 to 21°
C for these times, as well as wind direction changes from south-west to north-northsouth-west and south-south-west to northsouth-south-west.Cold fronts require special attention due to the associated potential for sudden changes of wind direction at sea.
図2: 天気図に衛星画像を重ねた図(左右)、アジア太平洋地上天気図(中央・拡大・抜粋) Fig. 2: Weather charts superimposed on a satellite image (Left, Right). Middle: Weather chart
2
2
0
0
1
1
8
8
年
年
秋
秋
~
~
2
2
0
0
1
1
9
9
年
年
春
春
に
に
発
発
生
生
し
し
た
た
エ
エ
ル
ル
ニ
ニ
ー
ー
ニ
ニ
ョ
ョ
現
現
象
象
Development of an El Niño event occurring
from boreal autumn 2018 to spring 2019
2018 年秋から 2019 年春にかけてエルニーニョ現象が発生し、沖縄・奄美から西日本に
かけて平年より気温が高くなりました。
An El Niño event occurring from boreal autumn 2018 to spring 2019 caused warmer-than-normal conditions in Okinawa/Amami and Western Japan.
気象庁 地球環境・海洋部 気候情報課 Climate Prediction Division, Global Environment and Marine Department, Japan Meteorological Agency
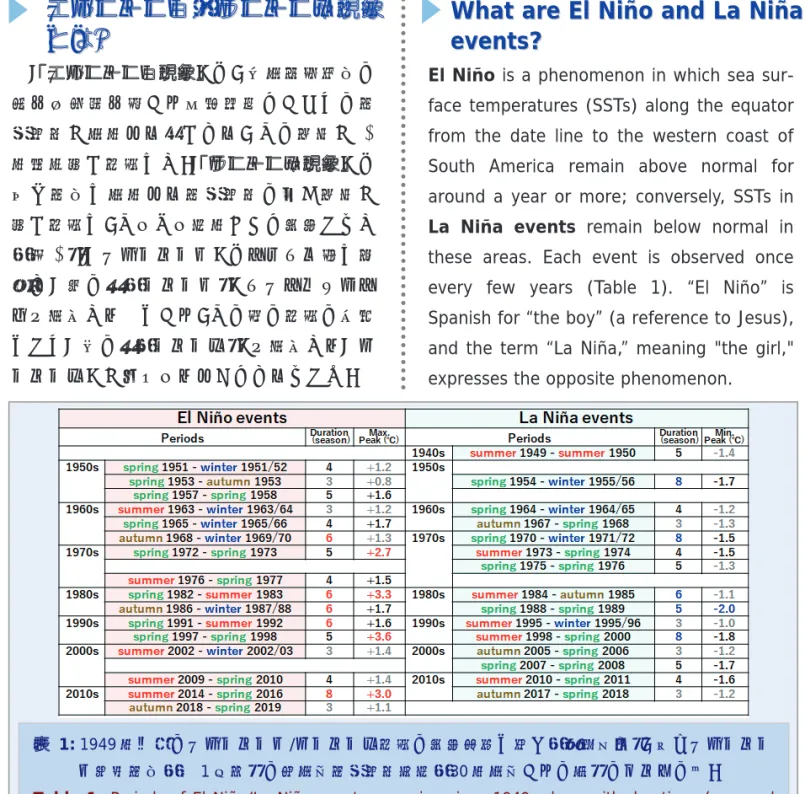
表 1: 1949 年以降のエルニーニョ/ラニーニャ現象の発生期間と長さ(季節単位)、及びエルニーニ ョ監視海域(図1 参照)の月平均海面水温指数(30 年平均からの差)のピークの値。 Table 1: Periods of El Niño/La Niña events occurring since 1949, along with durations (seasonal
units) and peak values of monthly NINO.3 SST indices (deviations from the 30-year average).
El Niño is a phenomenon in which sea sur-face temperatures (SSTs) along the equator from the date line to the western coast of South America remain above normal for around a year or more; conversely, SSTs in La Niña events remain below normal in these areas. Each event is observed once every few years (Table 1). “El Niño” is Spanish for “the boy” (a reference to Jesus), and the term “La Niña,” meaning "the girl," expresses the opposite phenomenon.
エ
エ
ル
ル
ニ
ニ
ー
ー
ニ
ニ
ョ
ョ
/
/
ラ
ラ
ニ
ニ
ー
ー
ニ
ニ
ャ
ャ
現
現
象
象
と
と
は
は
?
?
e
W
e
W
v
v
h
h
e
e
a
a
n
n
t
t
t
t
s
s
a
a
?
?
r
r
e
e
E
E
l
l
N
N
i
i
ñ
ñ
o
o
a
a
n
n
d
d
L
L
a
a
N
N
i
i
ñ
ñ
a
a
「エルニーニョ現象」は、太平洋赤道域の 日付変更線付近から南米沿岸にかけての海 面水温が平年より高くなり、その状態が 1 年程度続く現象です。「ラニーニャ現象」は 同じ海域で平年より海面水温の低い状態が 続く現象で、それぞれ数年おきに発生します (表 1)。「エルニーニョ」はスペイン語で特 別な「男の子(ニーニョ)」イエス・キリス トを意味することから、その逆の現象の呼称 として「女の子(ニーニャ)」を意味する「ラ ニーニャ」が使われるようになりました。- 12 -
図 1: 11 月の海面水温。(a) 平年値(1981~2010 年の 30 年平均)、(b) 2018 年の実況、(c) 平年 からの偏差(陰影)と実況(等値線)。白枠の四角はエルニーニョ監視海域の位置。 Fig. 1: Global SSTs for November: (a) Normals (30-year averages for the period from 1981 to 2010)
(b) SSTs observed in 2018 (c) SST anomalies from normals (shading) and SSTs observed in 2018 (contours). The white rectangle indicates the NINO.3 El Niño monitoring region.
2018 年秋から 2019 年春かけてエルニー ニョ現象が発生し、インドや東南アジア、 沖縄・奄美から西日本にかけて平年より気 温が高くなる傾向が見られました。表 1 に 示すように、秋に始まった過去 2 回のエル ニーニョ現象は、翌々年の冬まで 6 季節続 いた長寿命の現象でしたが、今回の現象は 翌年春までの3 季節という短い寿命でした。 発 生 期 間 中 の 海 面 水 温 指 数 の ピ ー ク 値 は 1949 年以降に発生した 16 回のエルニーニ ョ現象の中で2 番目に小さい値でした。 図1は平年の 11 月(a)と今回の現象の ピーク時(2018 年 11 月)の海面水温(b) を比べたもので、日付変更線の西側から南 米沿岸にかけて、1~2℃水温が高くなって います(c)。西部太平洋熱帯の水温も平年よ り高く、周辺のSST より一段と高い 30℃以 上の海域が見られました。
An El Niño event occurring from boreal au-tumn 2018 to spring 2019 caused warm-er-than-normal conditions in India, South-east Asia, Okinawa/Amami and western Japan. The previous two El Niño events also began in autumn but lasted six seasons, thereby continuing until after the subse-quent winter, while the 2018/19 event lasted only three seasons until the subsequent spring (Table 1). The peak NINO.3 SST value was the second lowest of all 16 El Niño events occurring since 1949.
Figure 1 shows SST normals for November (a), SSTs for this event from November 2018 (b) and related SST anomalies (c). SSTs around 1 – 2°C higher than normal were observed from west of the date line to the coast of South America. SSTs higher than normal and maximum 30°C SSTs were seen in the western equatorial Pacific.
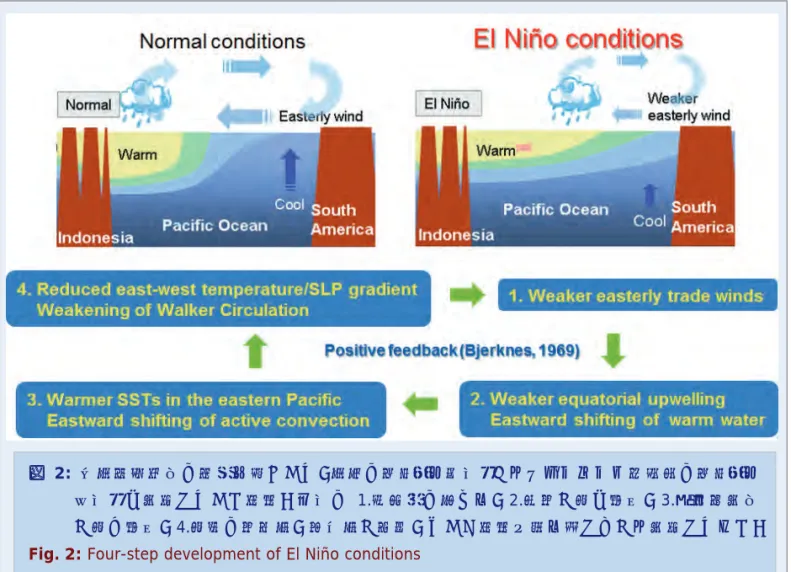
図 2: 太平洋赤道域の海面付近おいて、平常の状態(上左図)からエルニーニョ現象時の状態(上 右図)へ発達していく過程。下図の 1.貿易風の弱まり、2.暖水が東へ移動、3.対流活発域 が東に移動、4.東西の水温差、気圧差が減少、という過程を繰り返しながら発達してゆく。 Fig. 2: Four-step development of El Niño conditions
太平洋の熱帯域では、貿易風と呼ばれる 東風が吹いているため、海面付近の暖かい 海水が西側に吹き寄せられて東側の海面付 近は冷たくなっています(図2 左上)。エル ニーニョ現象が発生している時には、東風 が平常時よりも弱くなり、西部にあった暖 水が東方へ広がり、中部から東部の海面水 温は平常時よりも高くなります。平常時の 状態からエルニーニョ現象への変化は、1. 貿易風の弱まり、2.暖水の東向き移動、3. 対流活発域の東向き移動、4.東西の水温差 減少による気圧差の減少、を1~2 か月に一 度程度の頻度で何回も繰り返すことで、数 か月をかけて進行します。海洋と大気が相 互に影響しあいながら発達する状況は、西 部太平洋熱帯域での双子台風の発生やこれ に伴う強い西風などに見られます。
Easterly trade winds generally cause west-ward drifting of subsurface warm water in the tropical Pacific, and cold water emerges near the ocean surface in the eastern part (Figure 2, upper left). During El Niño events, easterlies are weaker and warm waters in the western part of the tropical Pacific ex-pand eastward, and SSTs in central-eastern parts are higher than average. The transition to El Niño conditions occurs via the iterative processes of 1) weakening of trade winds, 2) eastward shifting of warm water, 3) east-ward shifting of active convection, and 4) weakening of east-west gradients for SSTs and sea level pressure (SLP). These ocean-atmosphere interactions are seen in twin cyclone genesis and associated strong westerlies over the western tropical Pacific.
エ
- 14 - 気象庁では、エルニーニョ現象やラニー ニャ現象に伴う大気と海洋の現在の状況と 予測を、毎月10 日頃にエルニーニョ監視速 報として発表しています。詳しい情報は、 気象庁ホームページでご覧いただけます。 https://www.data.jma.go.jp/gmd/cpd/elnin o/index.html
お
お
わ
わ
り
り
に
に
A series of strong westerlies were observed during the 2018/19 El Niño event in the equatorial western Pacific. Figure 3 shows related Himawari-8 infrared images, with tropical cyclones north of the equator and mirror-images in (c) frequently observed prior to and during El Niño events. Such cloud imagery helps to clarify the charac-teristics of strong westerlies and ocean conditions in the western equatorial Pacific.
JMA monitors El Niño and La Niña events to enable reporting on current conditions, and issues its El Niño Monitoring and Outlook on or around the 10th of each month. For more information, see JMA's website.
https://ds.data.jma.go.jp/tcc/tcc/products/e lnino/index.html
C
C
o
o
n
n
c
c
l
l
u
u
s
s
i
i
o
o
n
n
今回のエルニーニョ現象発生中にも、西 部太平洋赤道域で強い西風が何度か観測さ れました。図 3 はその時の気象衛星ひまわ り8号の赤外画像です。赤道の北側にはそ れぞれ台風の渦が見られます。(c)では赤道 対称の南側にも台風(南太平洋においては サイクロンと呼ばれています)の渦が見ら れます。このような台風は双子台風と呼ば れ、エルニーニョ現象の発生前や発生中に しばしば見られます。海洋の暖水の東への 広 が り に 応 じ て そ の 発 生 場 所 も 変 化 し ま す。西部太平洋赤道域の雲の状況を観察す ることで、熱帯域の強い西風や海の状態に も思いを巡らせることができるのです。 図 3: 今回のエルニーニョ現象発生期間中に、西部太平洋赤道域で強い西風を引き起こした台風 をとらえた気象衛星ひまわり8 号の赤外画像。(a) エルニーニョ現象の発達期の 2018 年 10 月23 日、(b) 最盛期の 2018 年 11 月 20 日、(c) 最盛期後の 2019 年 2 月 18 日。Fig. 3: Himawari-8 infrared images of tropical storms bringing strong westerly winds during the
2018/19 El Niño event: (a) development stage, 23rd October 2018, (b) mature stage, 20th November 2018 (c) post-mature stage, 18th February 2019
T
w
i
n
c
y
c
l
o
n
e
s
a
n
d
w
e
s
t
e
r
-l
l
i
i
e
e
s
s
気象庁では、船員の皆様に船上での気象観 測を適切な方法で行っていただくため、ま た、船舶気象報や船舶気象観測表の内容を理 解いただき、これらを正しく報告いただける よう、様々な資料を作成し、各船舶に配布し ています。この度、「船舶気象観測指針(英 語版)」を改訂しました(2020 年 3 月発行)。 船舶管理機関・会社を通じて各船舶に配布い たしますので、最新版をご利用ください。 各資料は配布もしておりますが、以下のペ ージからもご覧いただけます。 https://marine.kishou.go.jp/jp/reference-jp.h tml
「船舶気象観測指針(英語版)
」を改訂しました
Update of Guide to Weather Observations for Ships
気象庁 地球環境・海洋部 海洋気象課 Marine Division, Global Environment and Marine Department,
Japan Meteorological Agency
図: 改訂した冊子 Fig: Revised publication
JMA’s Guide to Weather Observations for Ships, which supports appropriate marine meteorological observation by vessels at sea, was updated in March 2020.
The publication is available both in print and at
https://marine.kishou.go.jp/en/reference-en. html.
Ab
ou
t T
his
B
ull
eti
n
本誌は、船舶による精度の高い海上気象観測・通報を促進するとともに、 船舶に対し気象知識や気象情報利用の普及を行うことを目的とした広報誌 です。主として船舶乗組員の方々を対象に、海上気象観測・通報の方法や、 気象庁の提供する気象情報、海洋情報の最新の状況などをお知らせしていま す。すべての記事は、和英併記となっています。発行は、3 月と 9 月の年 2 回です。 読者の皆様のご意見を取り入れながら、さらに親しみやすい広報誌にして いきたいと思いますので、よろしくお願いします。 なお、本誌は、下記ウェブサイトからもご覧になることができます。 https://marine.kishou.go.jp/jp/fune-jp.htmlつ
い
て
This bulletin aims to promote useful marine weather observations/reports from ships and familiarize readers with weather and marine information provided by JMA. The publication mainly covers topics of interest to mariners, marine weather observations, recent announcements about JMA’s marine weather services, and more. All articles appear both in English and in Japanese. The bulletin is issued twice a year, in March and September.
We make constant efforts to improve the bulletin in order to make it more accessible to all our readers. Thank you for your continued support.
This bulletin is also available at the following website: https://marine.kishou.go.jp/en/fune-en.html 令和 2 年 3 月 31 日発行 編集兼
気
象
庁
印刷所 株式会社 総北海 東京支店 発行者 (住所) 東京都墨田区江東橋 4 丁目 25−10〒
100-8122 東京都 千代田区 大手町 1-3-4
気象庁
地球環境・海洋部 海洋気象課
「船と海上気象」担当
Marine Division, Global Environment and Marine Department
Japan Meteorological Agency
1-3-4 Otemachi, Chiyoda-ku, Tokyo 100-8122
Phone: +81 3 3212 8341 Ext. 5144 Telefax: +81 3 3211 3047
Email : [email protected] URL : https://marine.kishou.go.jp/
問
い
合
わ
せ
先
Conta
ct
us
ISSN 0429-9000
Vol. 64
No. 1
March 2020
船と海上気象
船と海上気象
横浜港に停泊するクイーン・エリザベスと出港するコスタ・ネオロマンチカ (2019.5.5)Queen Elizabeth anchored and Costa neoRomantica departing at Yokohama Port (5 May 2019)
THE SHIP AND
MARITIME METEOROLOGY
THE SHIP AND
MARITIME METEOROLOGY
気 象 庁
Japan Meteorological Agency
目
次
Contents
2019 年の台風のまとめ ・・・・・・・・・・・・・・・・・・・・・・・・・・・・・・・・・・・・・・・・・・・・ 1
台風進路予報の予報円改善について ・・・・・・・・・・・・・・・・・・・・・・・・・・・・・・・・・ 4
海上分布予報の領域拡張について ・・・・・・・・・・・・・・・・・・・・・・・・・・・・・・・・・・・ 6
船舶気象報の利用例の紹介 ・・・・・・・・・・・・・・・・・・・・・・・・・・・・・・・・・・・・・・・・・ 8
2018 年秋~2019 年春に発生したエルニーニョ現象 ・・・・・・・・・・・・・・・・・・・ 11
「船舶気象観測指針(英語版)」を改訂しました ・・・・・・・・・・・・・・・・・・・・・・ 15
Summary of the 2019 Typhoon Season ・・・・・・・・・・・・・・・・・・・・・・・・・・・・・ 1
Improvement of TC track-forecast probability circles ・・・・・・・・・・・・・・・
4
Expansion of Marine Weather Forecast Distribution Maps ・・・・・・・・・・・・・・・ 6
Utilization of Ships’ Real-Time Weather Reports ・・・・・・・・・・・・・・・・・・・・・・・ 8
Development of an El Niño event
occurring
from boreal autumn 2018 to spring 2019 ・・ 11
Update of Guide to Weather Observations for Ships ・・・・・・・・・・・・・・・・・・・ 15
第 64巻 第 1号 船 と 海 上 気 象 二 〇 二 〇 年 三 月 52000138_fune64-1#hyou1-4.indd 1-3 2020/02/25 13:30:34