Introduction
Poverty is a serious social problem. In struggling with this issue, experts have relied on various types of research to provide evidence for effective prescriptions. However, official research on poverty conducted by governments is of special value, because modern societies expect governments to assume responsibility for addressing poverty and because official research can substantially shape policy-making frameworks, as well as influencing the general public’s understanding of poverty.
Official poverty research in Japan was conducted by the former Ministry of Health and Welfare (Kōsei Shō in Japanese) from 1953 until 1965. However, after 1965, there was no governmental poverty research for several decades. In October 2009, after a regime change, the Ministry of Health, Labour and Welfare (MHLW; Kōsei-Rōdo Shō in Japanese) began this research activity again. The Democratic Party of Japan (DPJ; Minshu Tō in Japanese) called for conducting poverty research as one way to “support working poor people to become free from destitution” in its July 2009 election campaign (DPJ 2009). In compliance with this manifesto, the Ministry measured and announced its official poverty estimates beginning one month after the DPJ assumed power (DPJ 2012: 42). Poverty was defined as income less than half of the country’s median income. The indicator is called the
“relative poverty rate”, and the methodology for calculating this rate is derived from the Organization for Economic Co-operation and Development (OECD). According to the MHLW’s parliamentary secretary, it was a brave step for the government to announce officially the number of poor people in Japan. This action was intended to launch several efforts to improve the problem (MHLW 2009a). The Ministry continued to measure and announce relative poverty rates even after the DPJ lost power.
Although Japan’s poverty rate had previously been listed in an OECD report (OECD 2006), the government’s official
recognition has made this rate much more widely known, i.e., beyond researchers. At present, it is difficult to find discussions of poverty in Japan that do not include the official poverty rates (e.g., Abe 2014; Yamano 2014).
This paper explains how the Japanese government has measured and announced its relative poverty estimates since 2009. First, we explain the main reference materials reviewed.
Second, the methodology and evaluation approaches used to interpret the estimates are considered. Third, we discuss in further detail the resultant government efforts and its relative drawbacks. Lastly, we offer a concluding summary and recommend some future tasks.
Materials
This paper has primarily reviewed formal materials on the relative poverty rates that the Japanese government has issued, from 2009, when it first measured and announced the rates, through 2014. The results of the official measurement first appeared in materials distributed with a 2009 media release, and then in national statistical reports called Outlook on the Comprehensive Survey of Living Conditions (Outlook;
Kokumin Seikastu Kiso Chōsa no Gaikyō in Japanese), published in 2011 and 2014 (MHLW 2009b, 2009c, 2011a, 2014b).
The data contained in these materials were later cited in white papers issued by the central government. White papers are governmental reports produced for the purpose of “making known the political, economic and social reality as well as the present governmental policies to the general public” (Gyōsei Association Study on White Paper 2007). Each ministry selects certain issues and policies for public attention in its white papers, rather than thoroughly discussing all issues with which it is involved. Therefore, we can assume that governmental priorities can be identified by analyzing the contents of these materials.
Two kinds of white papers have discussed the poverty
How does the Japanese Government Measure and Announce Its Official Poverty Rates?
NODA Hiroya
1985 1988 1991 1994 1997 2000 2003 2006 2009 2012
% 12.0
% 13.2
% 13.5
% 13.7
% 14.6
% 15.3
% 14.9
% 15.7
% 16.0
% Relative poverty rate 16.1
Rate of children 10.9 12.9 12.8 12.1 13.4 14.5 13.7 14.2 15.7 16.3
Household of the working generation with children
Total 10.3 11.9 11.7 11.2 12.2 13.1 12.5 12.2 14.6 15.1
One adult 54.5 51.4 50.1 53.2 63.1 58.2 58.7 54.3 50.8 54.6
Two or more adults
9.6 11.1 10.8 10.2 10.8 11.5 10.5 10.2 12.7 12.4
A B
C
D
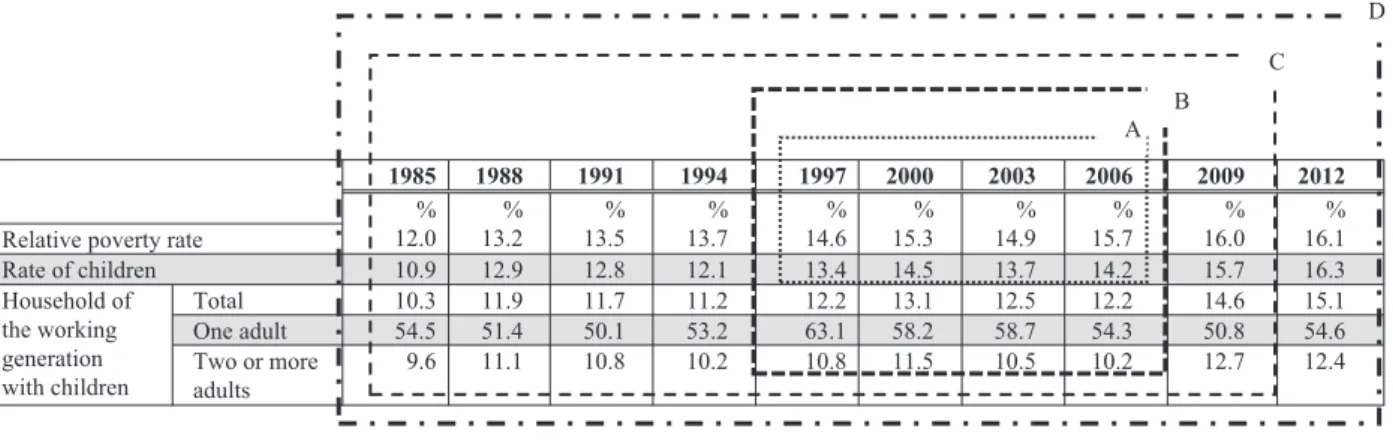
Figure 1. Poverty rates in Japan, 1985–2012
Note: “A” indicates the estimates announced in October 2009, “B” indicates the estimates announced in November 2009, “C” indicates the estimates announced in 2011, and “D” indicates the estimates announced in 2014. Data are drawn from Outlook on the Comprehensive Survey of Living Conditions in 2014 (MHLW 2014a: 18).
rate since 2010, the year following the first announcement of the national poverty rate. The first is the Annual Health, Labour and Welfare Report (Kōsei Rōdo Hakusho in Japanese), an official report written by the MHLW and submitted to the Cabinet (MHLW 2010, 2011b, 2012, 2013, 2014b). The second is the White Paper on Children and Young People (Kodomo/Wakamono Hakusho in Japanese), a legal report submitted to the Diet through the Cabinet. A national law for children requires the central government to create a national plan, Vision for Children and Young People (Kodomo/
Wakamono Bizyon in Japanese), in which it must indicate the status of and policies on child poverty. The Cabinet Office (Naikaku Hu in Japanese) is responsible for this duty (Cabinet Office 2010, 2011, 2012, 2013, 2014).
The Primary Features of the Official Poverty Rate in Japan
The Estimates
The MHLW first announced its official poverty estimates in October 2009, “following the instructions of the Minister of Health, Labour and Welfare” (MHLW 2009b). The estimates covered two population groups, i.e., total household members and children, at four benchmark years: 1997, 2000, 2003, and 2006 (MHLW 2009b).
The Ministry added estimates for three more population groups one month after this initial announcement: households of the working generation with one or more child(ren), households with one working adult and child(ren), and households with two or more working adults and child(ren).
Since then, it has announced the poverty rates for these five population groups (MHLW 2009c).
The estimates were based on income data from the extensive Comprehensive Survey of Living Conditions, conducted once every three years. The Minister then presented updates of the estimates in subsequent editions of the Outlook.
The publication, issued in July 2011, not only updated the
poverty estimate based on the income data from 2009, but also first referred to earlier benchmark years dating back to 1985, when the Comprehensive Survey of Living Conditions began. It also added data on the median income and poverty line for each year. The latest Outlook, released in July 2014, had no new information except for updates of the estimates using the income data from 2012 (MHLW 2011a, 2014a; see Figure 1). As shown in Figure 1, the overall poverty rate in 2012 was 16.1%, the highest percentage in any estimate since 1985. The rate for children was 16.3% and that for the working generation with child(ren) was 15.1%, within which the rate for households with one adult was 54.6% whereas that for households with two or more adults was 12.4% (MHLW 2014a: 18).
White papers, published by the MHLW as well as the Cabinet Office, generally cite government media releases and each edition of the Outlook. In the year following the first government announcement of the official estimates, the Annual Health, Labour and Welfare Report 2009–2010 mentioned that the Ministry had begun announcing the relative poverty rate “in order to address the poverty issue.” It reprinted charts showing the annual change of the rates for the five measured population groups from 1997 until 2006, which had been included with a media release in 2009, to describe the latest available data. It stated, “The overall relative poverty rate has been on an upward trend,” and “The poverty rate among households with one adult and child(ren) has been declining but remains at a very high level” (MHLW 2010:
169). Meanwhile, the White Paper on Children and Young People 2010 also reprinted the charts on the poverty rates for children and households with child(ren) and described the prevailing trends (Cabinet Office 2010: 31).
In the Annual Health, Labour and Welfare Report 2010–
2011, the relative poverty estimates of children were used to discuss the need to strengthen social security for the working generation in Japan. The report referred to data from Growing
Unequal? (OECD 2008), not from the Outlook published by the MHLW, comparing the income distribution among children before and after transfers and taxes (MHLW 2011b:
108–9). On the other hand, the White Paper on Children and Young People 2011 provided the same information with the same charts as did the previous paper, while adding the observation that one-parent families had a higher risk of poverty than other groups (Cabinet Office 2011: 30).
The Outlook, issued in July 2010, presented the latest rate for all five groups and the Annual Health, Labour and Welfare Report 2011–2012 referred to it. Also, in Chapter 5 (“Characteristics of Japanese Society in Comparison with International Standards”), the annual report described the trends in poverty rates before and after transfers and taxes, comparing the overall status of households at “around 1995,”
“around 2000,” “around 2005,” and the present time. These estimates were based on data from OECD. Stat (MHLW 2012:
105). The White Paper on Children and Young People 2012 also distilled the latest trends of the poverty rate from the Outlook, repeatedly mentioning the serious disadvantages faced by households with one adult and child(ren).
After the Law on Measures to Counter Child Poverty (Kodomo no Hinkon Taisaku Suishin Hō in Japanese) was enacted in June 2013, the Annual Health, Labour and Welfare Report 2012–2013 introduced a special section on “Policies against Child Poverty.” This section contained the latest poverty estimate for children only (MHLW 2013: 200). In contrast, the White Paper on Children and Young People 2013 did not change its structure at all from the previous year’s white paper. Finally, the two papers published in 2014 contained no changes in the remarks on the poverty rate (MHLW 2014b; Cabinet Office 2014).
The Methodology
The methodology for calculating Japan’s official poverty estimates was not original, as noted above, but was developed by the OECD. In order to comprehend the estimates, it is essential to understand the basics of this methodology.
Reference materials attached to media releases in October and November 2009 included short comments along with charts on the poverty line and disposable income. The materials explained that the poverty line for the estimates was set at half of the median disposable income. Therefore, the relative poverty rate was the percentage of household members who have less than half the median level of disposable income (MHLW 2009b, 2009c). Disposable income included wages and salaries, property revenue, social security cash benefits, remittances, and so on; taxes and social insurance premiums were deducted, and in-kind benefits and assets were excluded (MHLW 2009b, 2009c). There were mentions of “equivalent income,” which meant adjusted income divided by the square root of the number of household members. Almost the same comments appeared in each
edition of the Outlook issued subsequently (MHLW 2011a:
20: 51–3; 2014a: 18: 53–4).
In addition to equivalent disposable income and the poverty line, a few additional comments on the methodology were presented only in the Annual Health, Labour and Welfare Report 2009–2010. A column entitled “What is the relative poverty rate?” explained that the relative poverty estimates were both easy to calculate, since they were based purely on income, and useful in showing annual trends and making international comparisons. On the other hand, “There are things that we cannot know just by calculating a relative poverty rate, since one’s sense of values and one’s living standard will vary depending on such factors as property owned or human relations in daily life.” Nonetheless,
“Grasping the actual condition of poverty involves understanding hardship and the relative poverty rate helps us get to know it” (MHLW 2010: 174).
The subsequent editions of the Annual Health, Labour and Welfare Report made almost no mention of the methodology, nor did the series of White Papers on Children and Young People, except for an explanation of equivalent disposable income or the poverty line (Cabinet Office 2013:
29; 2014: 30).
Evaluation through International Comparisons
At a press conference held by the Minister of Health, Labour and Welfare in October 2009, he emphasized Japan’s high poverty rate in comparison to that of other countries, referring to cross-national data gathered by the OECD (MHLW 2009a).
These international data were attached as a reference in the second announcement in November 2009. The table
“International Comparison of Relative Poverty Rates (in the mid-2000s),” which was drawn from Growing Unequal?, covered poverty rates of all five population groups—overall household members, child(ren), households of working adult(s) and child(ren), households with one working adult and child(ren), and households with two or more working adults and child(ren)—in OECD countries and an average rate for each group. Apparently, all of the rates in Japan were higher than the international averages (MHLW 2009c).
Even though the Outlook never mentioned any international data, the two categories of white papers often referred to it. The Annual Health, Labour and Welfare Report 2009–2010 reprinted the same table used in the previous announcement and also noted that “the poverty rates in Japan are high among OECD countries” (MHLW 2010: 169, 171, 174). The White Paper on Children and Young People 2010 gave the same descriptions along with the same table (Cabinet Office 2010: 31–2).
In the Annual Health, Labour and Welfare Report 2010–
2011, a table presented international comparative data on income distribution before and after transfers and taxes, specifically with regard to children. According to this paper,
the data came from Growing Unequal?. The report then pointed out that Japan was unique in that its child poverty rate based on income after transfers and taxes was higher than the rate based on income before transfers and taxes (MHLW 2011b: 109). The White Paper on Children and Young People 2011 used the same table and gave the same comments as did the previous year’s white paper, and so did the 2012 and 2013 editions (Cabinet Office 2011: 30–1, 2012: 30–1, 2013: 30).
As mentioned above, the poverty rate for all households, based on income before and after transfers and taxes, appeared in the Annual Health, Labour and Welfare Report 2011–2012. It showed comparative data in 13 OECD countries and indicated that the rate based on income after transfers and taxes was the second-highest after that of the United States, whereas the rate based on income before transfers and taxes in Japan had risen consistently and had been higher than the international average since the mid- 2000s (MHLW 2012: 104–5). Also, this paper provided short comments on international child poverty comparisons, using the same table that was cited in the second announcement of 2009 (MHLW 2012: 107–8).
The 2013 and 2014 editions of the Annual Health, Labour and Welfare Report mentioned only child poverty, describing Japan’s rank among OECD countries (MHLW 2013: 200, 2014b: 272).
The White Paper on Children and Young People 2014 made a reference to international child poverty figures, citing the OECD’s Family database (Cabinet Office 2014: 30–1).
How Does the Government Understand Poverty?
Descriptions of the Official Poverty Rate
It was an epoch-making event when the Japanese government not only resumed calculating poverty rates but also began announcing these rates to the public in white papers, because there had been no official poverty measure in Japan for decades. Even though some researchers had endeavored to estimate poverty in various ways, they could not reach the broader population with the information.
The official estimates attracted considerable public attention soon after their announcement. The number of distinct population groups covered by the estimates increased from two to five in the first year. It is noteworthy that four of the five groups are directly related to children. In contrast with the Outlook, which only described general trends, the white papers picked up and focused on specific points.
Needless to say, the White Papers on Children and Young People were primarily interested in child poverty. However, the Annual Health, Labour and Welfare Report also tended to focus more heavily on child poverty, while describing general trends in the most recent year’s data.
In order to avoid creating confusion as to the meaning of the relative poverty rate, it is necessary to explain the
methodology so that people can interpret the data accurately.
Reference materials in the first and second announcements in 2009 and the Outlook in 2011 and 2014 contained brief explanations of the methodology. However, it was not mentioned in the two annual publications, except for the Annual Health, Labour and Welfare Report 2009–2010.
It is also notable that the government often evaluated the significance of the estimates by comparing them with cross- national data. The government seemed very sensitive to Japan’s international ranking. Also, it frequently made use of data from the same OECD report, Growing Unequal?.
Poverty Incompletely Understood
Although the government seemed to take a step forward by making official poverty estimates, the references to poverty rates in public materials were limited and the endeavor was incomplete in some aspects.
First, the official poverty rates presented were for every third year since 1985, not for every year, nor for any year before 1985. This is because the estimates were based on income data from the large-scale survey conducted every three years since 1985. Such trend information might be sufficient for international comparisons, but not for creating domestic policies to fight poverty. The government should try to calculate rates using available income data from other official statistics such as the National Survey of Family Income and Expenditures (Zenkoku Shōhi Zittai Chōsa in Japanese), in order to understand the trends from a different perspective.
Second, the population groups are limited. The official poverty rates have included five groups, focusing mostly on children, since the first year of the announcements. The approach seemed to follow that of OECD reports, especially Growing Unequal?, which was cited frequently in government materials. However, it is noteworthy that Growing Unequal?
described and analyzed the poverty rate not only among children and households with child(ren), but also among elderly people (OECD 2008: 137–40). In contrast, the Japanese government has made no effort to measure poverty among the elderly. Given Japan’s demographic trends and the high percentage of elderly people receiving public assistance, poverty among the elderly has become a very important issue too.
Third, the government has not expanded its range of poverty rate indicators. As OECD reports have shown, the government has the ability to describe the poverty gap (i.e., how far the poor are below the poverty line), such as by using multiple poverty lines. Presenting data on the poverty gap provides greater details on poverty trends and on the situation of people living near or under the poverty line. Such data can be useful in developing more effective programs to reduce varying levels of poverty.
These are opportunities that the government has not yet
tackled, although it has the ability to do so. The official measure of poverty in Japan is still relatively new and its applications are still in development.
Conclusion
This paper has described and discussed the official measures of poverty in Japan and their announcement to the public by the Japanese government. The MHLW, the ministry in charge of this measure, has presented relative poverty estimates for every third year since 1985 based on national statistics, but not for every year nor for any year prior to 1985. The estimates include five population groups, which focus primarily on children and exclude other groups, most notably the elderly. In its announcements through media releases and white papers, the government has tended to make only brief comments on the methodology and has discussed trends especially with regard to children. It has evaluated trends in Japan by comparison to international data from limited population groups, relying on a very small number of reference materials. Although measuring and announcing the official poverty rate initially seemed to be a big step forward for the government and was successful in garnering considerable public attention, both the actual data and the discussions of the data have been quite limited and insufficient for contributing toward building anti-poverty strategies.
Many topics remain to be discussed. First, more research on the policy process and public reactions is needed to clarify the government’s political will to focus on children and exclude other population groups. Second, other poverty indicators in addition to the relative poverty rate should receive further discussion. Although there have been some studies on levels of relative deprivation in Japan, the concept of asset poverty, which the OECD has been addressing for years, has been hardly discussed. Multiple indicators should be developed in order to improve efforts to combat poverty.
This work was supported by JSPS KAKENHI Grant Number 24730476.
References
Abe, Aya (2014) Kodomo no Hinkon II: Kaikestu-saku wo kangaeru (Child Poverty II: Discussing the measures). Iwanami Shoten. (in Japanese)
Cabinet Office (2010) Heisei 22 nen-ban Kodomo/Wakamono Hakusho
(White Paper on Children and Young People 2010). (in Japanese) Cabinet Office (2011) Heisei 23 nen-ban Kodomo/Wakamono Hakusho
(White Paper on Children and Young People 2011). (in Japanese) Cabinet Office (2012) Heisei 24 nen-ban Kodomo/Wakamono Hakusho
(White Paper on Children and Young People 2012). (in Japanese) Cabinet Office (2013) Heisei 25 nen-ban Kodomo/Wakamono Hakusho
(White Paper on Children and Young People 2013). (in Japanese) Cabinet Office (2014) Heisei 26 nen-ban Kodomo/Wakamono Hakusho
(White Paper on Children and Young People 2014). (in Japanese) Gyōsei Association to Study on White Paper (2007) Kīwādo-de-Yomu-
Hakusho-Gaido (Guide to White Papers with Keywords). Gyosei. (in Japanese)
Ministry of Health, Labour and Welfare (MHLW) (2009a) Nagatsuma- DaizinKakugi-go-Kisya-Kaiken-Gaiyō. 2009.10.20. (Summary on Press Interview of the Minister Nagatsuma after a Cabinet Meeting). (http://
www.mhlw.go.jp/stf/kaiken/daijin/2009/2r98520000001t41.html, 2015/5/18 accessed). (in Japanese)
Ministry of Health, Labour and Welfare (MHLW) (2009b) Sōtai-teki- Hinkon-ristu no Kōhyō ni stuite (On the Announcement about the Relative Poverty Rate). (in Japanese)
Ministry of Health, Labour and Welfare (MHLW) (2009c) Kodomo ga iru Geneki-Setai-in no Sōtai-teki-Hinkon-ristu no Kōhyō ni stuite.
2009.11.13. (On the Announcement about the Relative Poverty Rate of the Households of Working Generation with Child(ren)). (in Japanese) Ministry of Health, Labour and Welfare (MHLW) (2010) Heisei 22 nen-
ban Kōsei Rōdo Hakusho (Annual Health, Labour and Welfare Report 2009–2010). (in Japanese)
Ministry of Health, Labour and Welfare (MHLW) (2011a) Heisei 22 nen- ban Kokumin Seikastu Kiso Chōsa no Gaikyō (Outlook on the Comprehensive Survey of Living Conditions 2010). (in Japanese) Ministry of Health, Labour and Welfare (MHLW) (2011b) Heisei 23 nen-
ban Kōsei Rōdo Hakusho (Annual Health, Labour and Welfare Report 2010–2011). (in Japanese)
Ministry of Health, Labour and Welfare (MHLW) (2012) Heisei 24 nen- ban Kōsei Rōdo Hakusho (Annual Health, Labour and Welfare Report 2011–2012). (in Japanese)
Ministry of Health, Labour and Welfare (MHLW) (2013) Heisei 25 nen- ban Kōsei Rōdo Hakusho (Annual Health, Labour and Welfare Report 2012–2013). (in Japanese)
Ministry of Health, Labour and Welfare (MHLW) (2014a) Heisei 25 nen- ban Kokumin Seikastu Kiso Chōsa no Gaikyō (Outlook on the Comprehensive Survey of Living Conditions 2013). (in Japanese) Ministry of Health, Labour and Welfare (MHLW) (2014b) Heisei 26 nen-
ban Kōsei Rōdo Hakusho (Annual Health, Labour and Welfare Report 2013–2014). (in Japanese)
OECD (2006) OECD Economic Surveys: Japan. Volume 2006. Issue 13.
OECD (2008) Growing Unequal?: Income Distribution and Poverty in OECD Countries, OECD: Paris.
The Democratic Party of Japan (DPJ) (2009) Minshu-Tō no Seiken- Seisaku Manifesto 2009 (Manifesto on the Governmental Policies of the Democratic Party of Japan 2009). (in Japanese)
The Democratic Party of Japan (DPJ) (2012) 2009-nen Sō-Senkyo Manifesuto: Zisseki-Kensyō-nistuite (Inspection on the Manifesto Achievements of the General Election in 2009). (in Japanese)
Yamano, Ryoichi (2014) Kodomo ni Hinkon wo Oshistukeru Kuni, Nihon (Japan, the Country to Force Poverty onto Children). Kōbunsha. (in Japanese)
How does the Japanese Government Measure and Announce Its Official Poverty Rates?
NODA Hiroya This paper describes and discusses the Japanese government’s measurement and announcement of the country’s official poverty rate. The analysis relies primarily on materials issued by government ministries, such as official reports of national statistics and white papers.
The Ministry of Health, Labour and Welfare, which is in charge of measuring the poverty rate, has presented estimates for every third year since 1985, but not for every year, nor for any year before 1985. The estimates cover five population groups, with a primary focus on children and households of the working generation with child(ren), while excluding other groups such as the elderly. The official measure uses a methodology from the Organization for Economic Co-operation and Development, according to which the rate reflects the percentage of people who have less than half of the country’s median income. In its media releases and white papers, the government has tended to make only brief comments on the methodology and to describe trends primarily with reference to children and to households with children. It has evaluated trends in Japan by comparison to cross-national data for certain population groups. However, the government has not referred to poverty rates of other population groups, nor has it taken proactive steps to discuss and analyze the rates in depth from multiple perspectives.
Although measuring and announcing the official poverty rate initially seemed to be a big step forward for the government and attracted considerable public attention, both the actual data and the discussions of the data have been quite limited and insufficient for contributing toward elaborating anti-poverty strategies.
Keywords: official poverty, measurement, announcement, relative poverty rate, white paper