ICCS Journal of Modern Chinese Studies Vol.10 (1) 2017
134
Industrial Structural Changes in China from 1995 to 2015
Fu Tingting
1Abstract
The change of industrial structure in China is not only a major characteristic and consequence of economic development, but also an important factor that boosts the national economy for decades.
With the progress of science and technology, the industrial structure upgrades continuously, the consumption and alternative relationship of inputs in every sector have changed significantly. This article focuses on the industrial structural restructuring over past 20 years, from three major industries to 17 sectors. Based on 8 input-output tables of China, I use input-output analysis method to analyze the input and output relationship characteristics among 17 sectors, to reveal the internal mechanism of the industrial structural change, to find out the pillar industry and its effect on economy. Most sectors in the secondary industry have great direct and indirect effect on other sectors and economy.
Keywords: Industrial Structure; National Economic; Input-Output Analysis
I. Introduction
Apart from the noteworthy aggregate economic improvement in China, the structural feature attracts wide attention as well (Tan, 2007 [1]). Extensive studies have proved that the industrial structure is one of the significant determinants of national economic development, which accelerates the economic growth (Peneder, 2003) [2]. The evolution of industrial structure is associated with distinct transition trajectories (Borgersen & King, 2014 [3]). When it comes to the aggregate growth in China, a significant consequence of economic development is the industrial structural change (Gan, Zheng and Yu, 2011 [4]). With the rapid growth of China's economy, both the production technology and the industrial structure have upgraded. The technology plays an important role in the upgrade of industry structure (Panzar, 1989 [5];
Huang and Li, 2009 [6]). The substitute relation and the consumption of inputs in all industrial sectors have changed as the technology updated significantly. The optimization and upgrading of the technology and industrial structure is the internal reason of industrial structural change.
To adjust the industrial structure further and make the related policies, it’s necessary to have a good understanding of the changing trend of industrial structure in China.
In the existing study of the industrial structure of China, many scholars pay attention to the national economy and the industrial structure in a certain year, or the trend within a short time span. For example, Researching group of the Chinese input-output association (2007) [7] used the input-output table of 1997 and 2002 to analyze the proportion and changing trend of sectors in national economy. Wang and 論文
ICCS Journal of Modern Chinese Studies Vol.10 (1) 2017
Ge (2007) [8] used the input-output tables in 1997 and 2002 to analyze the input-output relation of industries. Liu and Cai (2008) [9]
analyzed the technological progress and industrial restructuring from 1992 to 2005. Some researchers pay attention to the industrial structures of certain industry or site. Li and Zeng (2003) [10] focused on the upgrading trends of tertiary industry’s internal structure in China.
Wu and Zhu (2014) [11] explore the structural transformation and the regional economic growth based on the input-output table of country and two provinces (Guangdong and Jiangsu). Those studies proved that the industrial structure kept changing (Chen, 2011) [12].
Many factors can induce a temporary change in a certain year. So the study of the industrial structure over long time span is very necessary.
This paper analyzes national economic structure and the industrial structural restructuring over past 20 years. With 8 input-output tables and Leontief inverse matrix, I also explore the input-output relation among industrial sectors and the changing trend according to the influence coefficients and sensitivity coefficients of 17 sectors, to reveal the internal mechanism of the industrial structural change, to find out the pillar industry
and its effect on economy.
The remainder of this paper is organized as follows. Section 2 studies three industrial structure2 in China from 1995 to 2015, and compare it with 21 countries in the world.
Section 3 explores the industrial structure of 17 sectors3 from 1995 to 2012 based on the input-output analysis. Section 4 gives the summary and conclusion.
II. Three industrial structures
It is an undeniable fact that China has experienced decades of rapid economic growth.
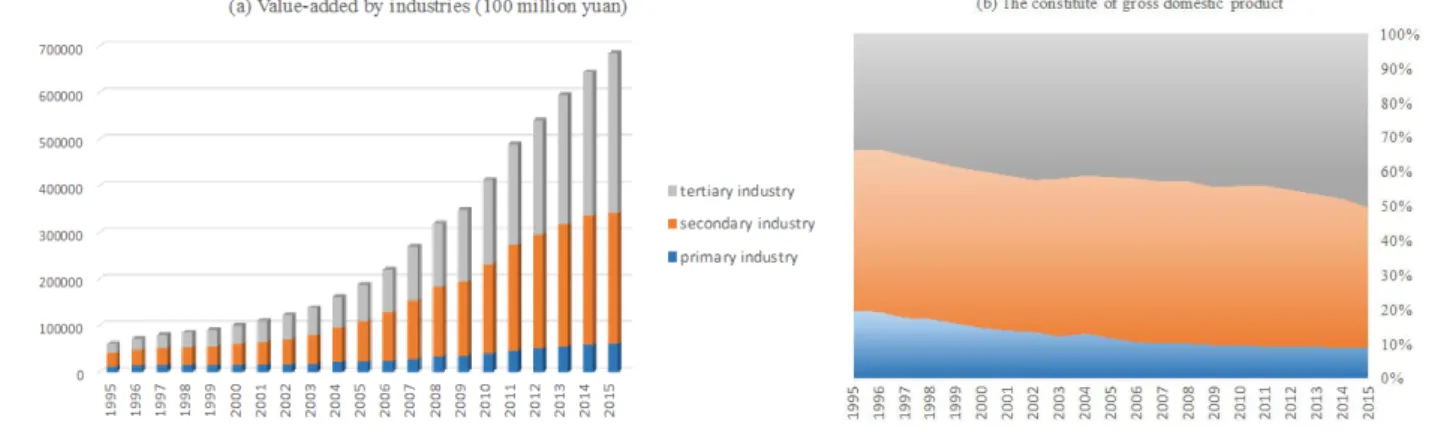
The most obvious fact is the sharply increase of gross domestic product. The composition of three industries in China also changed significantly over past 20 years. The changing trend of the industrial structure is shown clearly in Figure 1. The panel (a) of Figure 1 shows the value-added by industries. There are great improvements in all industries, while in different degree. The growths in tertiary industry and secondary industry are faster than that in primary industry. And the proportion of tertiary industry is very similar to that of secondary industry, much larger than that of primary industry. The panel (b) gives clearer picture of it. The proportion of primary industry continued to fall,
Figure 1 Constitute of GDP in China from 1995 to 2015 Notes:
ICCS Journal of Modern Chinese Studies Vol.10 (1) 2017
136 from 20% in 1995 to 9% in 2015. The percentage of tertiary industry kept increasing, from 34% in 1995 to 50% in 2015. It’s a major characteristic of industrial structural change in China.
We can’t arbitrarily judge that the proportions of primary or tertiary industry in China are too high or too low. No one can set up an optimum GDP composition applicable to every country because there are too many complicated factors behind it. Although, compared with other countries, we can have a better understanding of industrial structural feature in different developing stage. Figure 2 displays the outline of GDP compositions in 21 countries, and the average level in the world.
In most developed countries, the proportions of agriculture sector are very low, such as United
States (1.1%), Japan (1.2%), Singapore (0.0%), Germany (0.6%) and United Kingdom (0.7%), compared with relative high percentages in most developing countries, for instance, Philippines (10.3%), India (17.0%), Thailand (9.10%), Malaysia (8.5%) and China (8.9%). The high proportion of agriculture sector is also an important feature in country with a large population, like China and India. By contrast, the proportions of services sector in developed countries are high, such as United States (79.5%), Japan (71.3%), Singapore (73.6%), Germany (69.1%) and United Kingdom (80.0%), while those in developing countries are relative low, for example, Philippines (59.0%), India (45.0%), Thailand (55.1%), Malaysia (53.8%) and China
(50.2%). It is reasonable to predict that the proportion of services sector will rise and the Figure 2 Composition of GDP by sector of 22 countries in 2015
Notes:
a data source:
https://www.cia.gov/library/publications/resources/the-world-factbook/fields/2012.html
b Data in this table are calculated at current prices.
cThe data of Singapore and India are in 2014, while the others are in 2015
d The last bar in the right shows the world average level.
ICCS Journal of Modern Chinese Studies Vol.10 (1) 2017
percentage of agriculture sector will drop as the economic growth in developing countries, including China.
III. The industrial structures in 17 sectors
1. Leontief input-output method
When it comes to the interindustry relations among industrial sectors, except the direct input between every two sectors, the accumulative intermediate input among all sectors cannot be neglected as well. The input-output method is widely used in the analysis of industrial structure (Liu, 2002 [13]; Wang, 2011 [14])). This paper uses the input-output method to analyze the industrial structural restructuring in China, coving the direct and indirect input. The input-output table is an important part of the economic accounting system, fully reflecting the interaction among industrial sectors in the complete production process.
The input-output table includes the information of intermediate input and final use of every sector. When there are n sectors, the intermediate input matrix of n industrial sectors (Zn×n) plus the final demand vector (Yn×1) equals to the aggregate output vector (Xn×1), which is
Xn×1 = Zn×n + Y n×1 Eq. (1)
Zij represents the the amount of product i used as an intermediate input in the production of industry j. Xj is the aggregate output of sector j. And we can get input coefficient matrix4 A (Zn×n= AX, aij=Zij /Xj), which shows the input of product i in the production of one monetary unit of industry j’s output. According to this definition, equation (1) can be replaced by X= AX+ Y, which can be translated to
X= (I - A) -1 Y= BY Eq. (2)
in which I is identity matrix. Let B= (I - A) -1, B is Leontief inverse matrix. Its elements bij represents the value of output i required directly and indirectly to produce one additional monetary unit of industry j’s demand (Leontief, 1986 [15];
Miller, 1998 [16]), which is influenced by social,
economical and technology level. According to the results, the coefficients of Leontief inverse matrix vary slightly every year, which proves that both the production technology and the substitutional relation of inputs keeping changing.
Next, we will use Leontief input-output method, based on eight input-output tables of 17 sectors in 1995, 1997, 2000, 2002, 2005, 2007, 2010, 2012 from China Statistical Yearbook by Department of National Accounts of the National Bureau of Statistics. By comparing the influence coefficient and the sensitivity coefficient of every sector, we are able to analyze the input-output relations among industrial sectors and their variation trends, to explore the inherent mechanism of industrial structural change and find out the pillar industry supporting the economy.
2. The influence coefficient
Each sum of column in Leontief inverse matrix coefficient table indicates the input of all sectors (including direct and indirect input) in the production of one monetary unit of industry j’s final goods, representing the influence of sector j’s production on all sectors. When it’s divided by the average value of entire vertical sum in the Leontief inverse matrix, we can get the influence coefficient. The calculation formula of the influence coefficient of sector j is
ICCS Journal of Modern Chinese Studies Vol.10 (1) 2017
138 cj=Σbij /( ΣΣbij /n) Eq. (3)
in which n is the number of the sectors, and bij is the element of the Leontief inverse matrix. The
influence coefficient of sector j shows the relative influence of sector j’s production on all sectors compared with others. The higher the influence
coefficient is, the more influence the certain sector generate on others. The influence Table 1. The influence coefficients of 17 sectors in China from 1995 to 2012
2012 2010 2007 2005 2002 2000 1997 1995 Agriculture, Forestry, Animal
Husbandry & Fishery 0.73 0.72 0.72 0.72 0.78 0.77 0.76 0.75
Mining 0.86 0.92 0.90 0.91 0.82 0.81 0.87 0.91
Manufacture of Foods, Beverage
& Tobacco 0.99 1.01 0.98 0.96 1.01 0.96 1.00 0.94 Manuf. of Textile, Wearing
Apparel & Leather Products 1.20 1.20 1.21 1.15 1.21 1.17 1.12 1.29 Other Manufacture 1.08 1.11 1.07 1.08 1.06 1.07 1.05 1.20 Production and Supply of
Electric Power, Heat Power and Water
1.23 1.10 1.09 1.00 0.87 0.96 0.94 0.89
Coking, Gas and Processing of
Petroleum 1.13 1.09 1.11 1.10 1.12 1.02 1.10 1.07
Chemical Industry 1.24 1.22 1.23 1.18 1.17 1.19 1.16 1.20 Manufacture of Nonmetallic
Mineral Products 1.31 1.17 1.10 1.09 1.06 1.10 1.08 1.08 Manufacture and Processing of
Metals and Metal Products 1.12 1.24 1.24 1.21 1.21 1.24 1.24 1.18 Manufacture of Machinery and
Equipment 1.08 1.32 1.32 1.28 1.27 1.28 1.21 1.22
Construction 1.16 1.15 1.19 1.13 1.19 1.17 1.15 1.15 Transport, Storage, Post,
Information Transmission, Computer Services & Software
0.94 0.91 0.86 0.93 0.93 0.90 0.85 0.84
Wholesale and Retail Trades,
Hotels and Catering Services 0.67 0.70 0.77 0.83 0.87 0.92 0.89 0.81 Real Estate, Leasing and
Business Services 0.76 0.73 0.74 0.82 0.83 0.93 0.91 0.80 Financial Intermediation 0.68 0.62 0.60 0.71 0.72 0.61 0.75 0.76 Other Services 0.82 0.80 0.87 0.90 0.88 0.91 0.92 0.90
ICCS Journal of Modern Chinese Studies Vol.10 (1) 2017
coefficient of 17 sectors in China from 1995 to 2012 is listed in Table 1.
According to the results listed in Table 1, we can see the influence of every sector on others in 2012. The influence coefficient of Manufacture of Nonmetallic Mineral Products is highest (1.31) in 2012, proving that it had the greatest effect on the economy. The influence coefficients of Financial Intermediation and Wholesale and Retail Trades, Hotels and Catering Services are lowest, which belong to tertiary industry. The influence coefficients of 9 sectors (Manufacture. of Textile, Wearing Apparel & Leather Products; Other Manufacture; Production and Supply of Electric Power, Heat Power and Water; Coking, Gas and Processing of Petroleum; Chemical Industry;
Manufacture of Nonmetallic Mineral Products;
Manufacture and Processing of Metals and Metal Products; Manufacture of Machinery and Equipment; Construction) are higher than 1. The increase of the demand of these 9 sectors can exert great direct and indirect effect on other sectors and economy. These sectors with high-influence mainly belong to the secondary industry. They attract more attention during the industrial upgrading as potential pillar industry, and are helpful to boost the economic development compared with other sectors during the period of recession.
To explore the industrial structural change, we need pay attention to the dynamic change. The influence of many sectors from 1995 to 2012 changed remarkably. We focus on the order of the coefficients, since the influence coefficient is a relative index not an absolute index. The influence of 9 sectors increased and of 8 sectors dropped. The affect of Manufacture of Nonmetallic Mineral Products, Chemical Industry and Manufacture of Textile, Wearing Apparel &
Leather Products on other industries, which belong to the secondary industry, raised drastically in past 20 years. Their influence coefficients of 2012 ranked 1st, 2nd and 4th, while their ranks in 1995 are only 11th, 15th and 17th, showing very weak influence on other sectors in 1995. In contrast, the influence of some sectors in the primary industry and tertiary industry on other sectors decreased significantly. The coefficient of Agriculture, Forestry, Animal Husbandry &
Fishery (ranked 1st in 1995), Financial Intermediation (ranked 2nd in 1995), Real Estate, Leasing and Business Services (ranked 3rd in 1995) and Wholesale and Retail Trades, Hotels and Catering Services (ranked 4th in 1995) ranked from 14th to 17th. The impact of some industries did not change too much, such as Manufacture of Foods, Beverage & Tobacco, Electric Power, Heat Power and Water and Coking, Gas and Processing of Petroleum.
3. The sensitivity coefficient analysis
Each sum of row in the Leontief inverse matrix indicates the supplies required directly and indirectly of row sectors i when there is one unit of the final demand for all column sectors. The sensitivity coefficient5 is each sum of row in the Leontief inverse matrix divided by the average value of the entire horizontal sum in inverse matrix coefficient table. The calculation formula of the sensitivity coefficient:
ri=Σbij /( ΣΣbij /n) Eq. (4)
in which n is the number of sectors, bij is the coefficient of Leontief inverse matrix.
ICCS Journal of Modern Chinese Studies Vol.10 (1) 2017
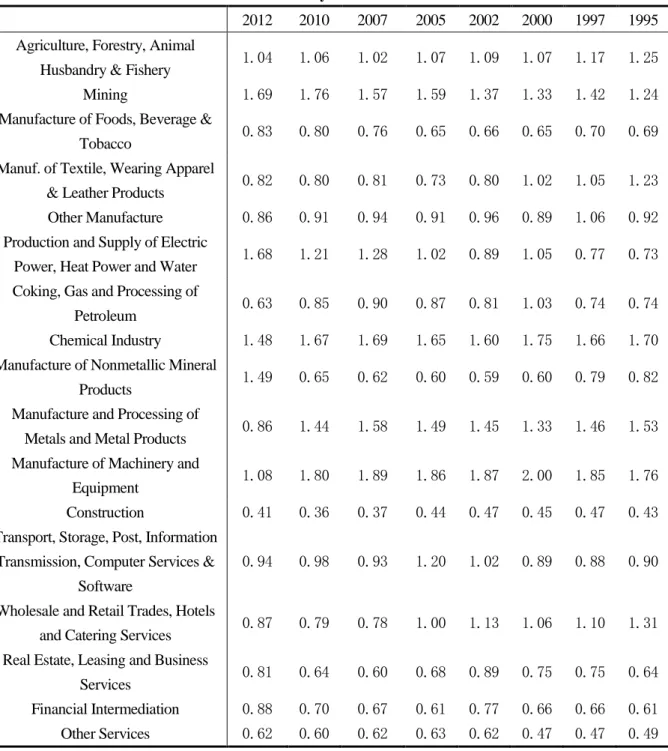
140 The sensitivity coefficients from 1995 to 2012 are shown in Table 2. The sensitivity coefficients of 6 sectors in 2012 are higher than 1, which includes Agriculture, Forestry, Animal Husbandry & Fishery, Electric Power, Heat Power and Water, Chemical Industry, Manufacture of
Nonmetallic Mineral Products and Manufacture of Machinery and Equipment. The sensitivity coefficient of Mining (1.69) is highest in 2012.
Most of the sectors with high sensitivity coefficients are in the secondary industry, which shows that the demand for these sectors from
Table 2. The sensitivity coefficients of 17 sectors
2012 2010 2007 2005 2002 2000 1997 1995 Agriculture, Forestry, Animal
Husbandry & Fishery 1.04 1.06 1.02 1.07 1.09 1.07 1.17 1.25 Mining 1.69 1.76 1.57 1.59 1.37 1.33 1.42 1.24 Manufacture of Foods, Beverage &
Tobacco 0.83 0.80 0.76 0.65 0.66 0.65 0.70 0.69 Manuf. of Textile, Wearing Apparel
& Leather Products 0.82 0.80 0.81 0.73 0.80 1.02 1.05 1.23 Other Manufacture 0.86 0.91 0.94 0.91 0.96 0.89 1.06 0.92 Production and Supply of Electric
Power, Heat Power and Water 1.68 1.21 1.28 1.02 0.89 1.05 0.77 0.73 Coking, Gas and Processing of
Petroleum 0.63 0.85 0.90 0.87 0.81 1.03 0.74 0.74 Chemical Industry 1.48 1.67 1.69 1.65 1.60 1.75 1.66 1.70 Manufacture of Nonmetallic Mineral
Products 1.49 0.65 0.62 0.60 0.59 0.60 0.79 0.82 Manufacture and Processing of
Metals and Metal Products 0.86 1.44 1.58 1.49 1.45 1.33 1.46 1.53 Manufacture of Machinery and
Equipment 1.08 1.80 1.89 1.86 1.87 2.00 1.85 1.76 Construction 0.41 0.36 0.37 0.44 0.47 0.45 0.47 0.43 Transport, Storage, Post, Information
Transmission, Computer Services &
Software
0.94 0.98 0.93 1.20 1.02 0.89 0.88 0.90
Wholesale and Retail Trades, Hotels
and Catering Services 0.87 0.79 0.78 1.00 1.13 1.06 1.10 1.31 Real Estate, Leasing and Business
Services 0.81 0.64 0.60 0.68 0.89 0.75 0.75 0.64 Financial Intermediation 0.88 0.70 0.67 0.61 0.77 0.66 0.66 0.61 Other Services 0.62 0.60 0.62 0.63 0.62 0.47 0.47 0.49
ICCS Journal of Modern Chinese Studies Vol.10 (1) 2017
entire industries is high in the progress of economic development.
From 1995 to 2012, the change of the sensitivity coefficients also reflects the industrial structural restructuring. The sensitivity of 6 sectors increased and of 8 sectors dropped. The sensitivity of some sectors raised in decades, such as Electric Power, Heat Power and Water (from 12th in 1995 to 2nd in 2012), Manufacture of Nonmetallic Mineral Products (from 10th in 1995 to 3th in 2012) and Financial Intermediation (from 15th in 1995 to 8th in 2012), becoming more sensitive to the demand of entire industries. The sectors becoming less sensitive include Manufacture and Processing of Metals and Metal Products (from 3rd in 1995 to 11th in 2012), Manufacture of Textile, Wearing Apparel &
Leather Products (from 7th in 1995 to 13th in 2012) and Wholesale and Retail Trades, Hotels and Catering Services (from 4th in 1995 to 9th in 2012). The orders of the sensitivity coefficients of other services, Real Estate, Leasing and Business Services and Construction don’t change.
4. Comprehensive analyze
When we compare Table 1 and Table 2, we find that both the influence coefficients and the sensitivity coefficients of 3 sectors (Electric Power, Heat Power and Water; Chemical Industry;
Manufacture of Nonmetallic Mineral Products) are large, which are pillar industries pushing the economic growth. They need plenty of intermediate products from other sectors during the production process and also serve as the major suppliers of intermediate products to others. For Mining, Agriculture, Forestry, Animal Husbandry
& Fishery and Wholesale, the influence coefficients are low, while the sensitivity coefficients are high. Even though the radiation
and driving power of these two sectors on entire industries is limited, the demand for these sectors is large in the development of production, especially Agriculture, Forestry, Animal Husbandry &
Fishery and Wholesale, which is vital for a populous country. To steady national economic growth, it’s necessary to develop these sectors. In contrast, for the sectors of Manufacture of Textile, Wearing Apparel & Leather Products, Construction and Manufacture and Processing of Metals and Metal Products, the influence coefficients are high, while the sensitivity coefficients are low. These sectors play a leading role in the economic, while the demand for them is relative low. For other sectors, such as Other Services, Real Estate, Leasing and Business Services, Manufacture of Foods, Beverage &
Tobacco, both the influence coefficient and the sensitivity coefficient are low. These sectors are mainly affected by consumption demand other than the input-output connection with others sectors.
IV. Conclusions and Discussion In recent years, the economic structure in China has been optimized and upgraded. Given the technological progress, the input - output relationships among industries have changed. The proportion of primary industry in GDP continued to fall, from 1995 to 2015, while that of tertiary industry kept increasing. Now, the percentage of tertiary industry in GDP is very similar to that of secondary industry, much larger than that of primary industry. In the aspect of the industrial internal structure, the policy to stimulate economic growth ought to focus on the sectors with high influence coefficient or sensitivity coefficient. Many sectors in the secondary industry have great direct and indirect effect on
ICCS Journal of Modern Chinese Studies Vol.10 (1) 2017
142 other sectors and economy, such as Electric Power, Heat Power and Water; Chemical Industry;
Manufacture of Nonmetallic Mineral Products. They attract more attention during the industrial upgrading as potential pillar industry, and are helpful to boost the economic prosperity. To steady national economic growth, it’s also necessary to develop the sector of Agriculture, Forestry, Animal Husbandry & Fishery and Wholesale, the demand for which is large in the economic development, especially for a country with a large population.
Note*
1 Graduate Department of Chinese Studies, Aichi University, Japan. It is financed by the Research Grant for Young Researchers of ICCS of Aichi University.
2 Three industries include the primary industry, the secondary industry and tertiary industry.
3 The 17 sectors include: Agriculture, Forestry, Animal Husbandry & Fishery; Mining;
Manufacture of Foods, Beverage & Tobacco;
Manuf. of Textile, Wearing Apparel & Leather Products; Other Manufacture; Production and Supply of Electric Power, Heat Power and Water; Coking, Gas and Processing of Petroleum; Chemical Industry; Manufacture of Nonmetallic Mineral Products; Manufacture and Processing of Metals and Metal Products;
Manufacture of Machinery and Equipment;
Construction; Transport, Storage, Post, Information Transmission, Computer Services
& Software; Wholesale and Retail Trades, Hotels and Catering Services; Real Estate, Leasing and Business Services; Financial
Intermediation; Other Services.
4 It’s also called direct consumption coefficient matrix, or technical coefficients matrix.
5 Or called Index of the Sensitivity of Dispersion.
*References
[1] Tan Shunfu. Status of Industrial Structure and its Adjustment in China. Management World, 2007 (6) (in Chinese)
[2] Peneder, Michael. Industrial structure and aggregate growth. Structural change and economic dynamics 2003 (14).
[3] Borgersen T A, King R M. Export-Led Growth in Transition Economies: The Role of Industrial Structure, Productivity Growth Differentials, and Cross-Sectoral Subsidies.
Eastern European Economics, 2014(52).
[4] Gan Chunhui, Ruogu Z, Dianfan Y. An Empirical Study on the Effects of Industrial Structure on Economic Growth and Fluctuations in China. Economic Research Journal, 2011(5). (in Chinese)
[5] Panzar, John C. Technological determinants of firm and industry structure. Handbook of industrial organization 1989(1).
[6] Huang Maoxing, Li Junjun. Technology choice, Upgrade of industrial structure and economic growth. Economic Research Journal, 2009(7). (in Chinese)
[7] Researching group of the Chinese input-output association. The analysis of inducing effect of final demands on national economy and sectors: the forth of researching report series on input-output tables of 2002 revising 1993 SNA. Statistical Research,2007 (1). (in Chinese)
ICCS Journal of Modern Chinese Studies Vol.10 (1) 2017
[8] Wang Yueping, Ge Yuejing. The analysis of input-output feature on the industrial structure in China. Management World, 2007(2). (in Chinese)
[9] Liu Wei, Cai Zhizhou. Technological progress, industrial restructuring and improvement of national intermediate consumption. Economic Research Journal, 2008 (4). (in Chinese)
[10] Li Jiangfan and Zeng Guojun. An Analysis on Upgrading Trends of Tertiary Industry’s Internal Structure in China. China Industrial Economy, 2003 (3) (in Chinese)
[11] Wu Fuxiang, Zhu Lei. Technological progress, structural transformation and the regional economic growth: an empirical research based on the input-output table of country, Guangdong and Jiangsu. Journal of Shanghai economic research, 2014(1) (in Chinese)
[12] Chen Shiyi. Reconstruction of Sub-industrial statistical data in China (1980—2008).
China Economic Quarterly, 2011 (3) (in Chinese)
[13] Liu Qiyun; The Research on the Method of Structural Analyses Regarding the Input output Coefficients. Statistical Research.
2002 (2) (in Chinese)
[14] Wang Zhibo. The research on the analytical method of the input-output structural change.
Statistical research, 2011(8) (in Chinese) [15] Leontief, Wassily, ed. Input-Output
Economics. Oxford University Press, 1986.
[16] Miller, Ronald E. Regional and interregional input-output analysis. ISARD, W. et al.
Methods of interregional and regional
analysis. Brookfield, Vt: Ashgate Publishing Company USA 1998.