As s es s ment of t he Hypercapni c Vent i l at ory Res pons e Meas ured wi t h t he Trans cut aneous and I ns pi red Part i al Pres s ures of CO
2
Sohei KAGAWA,Chieko FUJIWARA,Tomoko OTAKE‑OTANI,Shin KAGAYA, Masanori TAKINAMI,Yasumasa TANIFUJI,and John W.SEVERINGHAUS Department of Anesthesiology, The Jikei University School of Medicine
Department of Anesthesiology, University of California San Francisco
ABSTRACT
Purpose:The slope of the hypercapnic ventilatory response(HCVR)can be calculated from the values of transcutaneous partial pressure of CO ( tcPCO )and inspired partial pressure of CO (PCO )without measuring ventilatory volume. In this study,we examined how accurately this calculation reflects the slope derived directly from meas ured expiratory volume( ).
Methods:We assessed hypercapnic ventilatory responses in 3 men,and measured HCVR with both methods 4 times in each.
Results:We found a significant correlation between the slope calculated from tcPCO and PCO and the slope derived directly from measur ed HCVR.
Conclusion:We conclude that use of tcPCO and PCO is a valid method for estimating HCVR. (Jikeikai Med J 2005;52:59‑62)
Key words:hypercapnic ventilatory response,CO electrodes,transcutaneous
INTRODUCTION
Measuring hypercapnic ventilatory response (HCVR)in neonates is extremely difficult,because alveolar ventilatory volume cannot be measured eas- ily. Alveolar ventilatory volume is calculated from the exhaled volume of CO dur ing breathing(・
Vco) and the fractional concentration of alveolar CO (F CO )according to the following formula:
V・ =・
Vco/F co [Eq 1]
If the fractional concentration of CO in inspired gas(Fco)is added,the for mula is as follows:
V・ =・
Vco/(F co−Fco)[Eq 2]
The fractional increase in ventilation from
breathing air to breathing air/CO (VR:ventilatory ratio)is:
VR=
V (・ breathing CO in air)
V (・ breathing air) = F co F co−Fco
[Eq 3]
Hazinski et al. obtained the following equation by replacing F CO with t ranscutaneous partial pres- sure of CO (tcPCO ),which shows VR when the inspired partial pressure of CO (PCO )is added:
VR= tcPco (breathing air) tcPco−Pco (breathing CO in air)
[Eq 4]
VR is a value that is expressed as the ratio of ventilatory volume change when the ventilatory vol- ume at a steady state during air breathing is defined as 1.The increase in VR agai nst the changes in
Jikeikai Med J 2005;52:59‑62
Received for publication,January 26,2005
香川 草平,藤原千江子,大竹(大谷)知子,加賀谷 慎,瀧浪 将典,谷藤 泰正
Mailing address:Sohei KAGAWA,Department of Anesthesiology,The Jikei University School of Medicine,3‑25‑8,Nishi‑Shimbashi, Minato‑ku,Tokyo 105‑8461,Japan.
E‑mail:skagawa@pc.highway.ne.jp
59
tcPCO is the slope S of HCVR:S=VR/(T2‑T1), where T2 and T1 are the tcPCO values with and without added CO . For exampl e,the normal HCVR is about 3 L/min/mmHg. Wi th an assumed resting ventilation of 6 L/min,the slope S with the Hazinski method is 3/6=0.5/mmHg.
Thus,they calculated the slope of HCVR from the values of tcPCO and PCO wi thout measuring alveo- lar ventilatory volume.
It is not known how accurately the slope that is calculated from tcPCO ref lects the slope that is based on directly measured expi ratory volume(V ),a stan- dard indicator of HCVR. We therefore performed a study to assess the accuracy of calculating the slope from tcPCO and PCO ( the Hazinski method)by comparing it with the s lope derived from direct measurement of V .
MATERIALS AND METHODS
The protocol was approved by the ethics commit- tee of The Jikei University School of Medicine,and informed consent was obt ained from each subject. The subjects were 3 healthy men. Age,height,and weight were 40 years,176 cm,and 78 kg,respectively,
in subject a;41 years,161 cm,and 79 kg in subject b;
and 51 years,167 cm,and 63 kg in subject c. The HCVR was determined wi th both the Hazinski method and direct measur ement of V . The VR was measured 4 times with each method in each of the 3 subjects. The subjects br eathed room air and oxy- gen or a mixture of oxygen and exhaled gas through a one‑way valve attached t o a face mask in a semisit- ting position(Fowlerʼs position). The tip of the sam- pling tube was placed close to the mouth and end‑tidal CO pressure and PCO wer e measured with a cap- nometer (Capnomac Ultima Expiratory Gas Anal- yzer;Datex‑Ohmeda Division, Instrumentarium Corp.,Helsinki,Finland). The capnometer was cali- brated with dry gas and compensated for barometric pressure and vapor pressur e. Minute ventilation was measured with a hot‑wir e spirometer(Respiratory Flowmeter;Minato Medi cal Science Co., Ltd., Osaka,Japan),placed between the face mask and the respiratory circuit. The det ails of the experimental set up described in Fujiwar a et al..
Inspiratory oxygen concentration was kept higher than 50% throughout the experiment. After the skin electrode(TCM3;Radi ometer A/S,Bronsho, Denmark)was placed on the internal side of the forearm,the face mask was attached,a mixture of air and oxygen was inhaled,and t cPCO and V were measured as steady state val ues. The inspired CO was then increased in two steps of 3 to 5 mmHg each;
stabilized PCO ,tcPCO ,and V were recorded at each step. Minute ventilat ion was calculated from each tidal volume and was t raced on the chart recorder to confirm that t he value was stable for 1 minute.
For the Hazinski method,VR was calculated(Eq 4)for each HCVR test at a steady state and at the first and second steps of CO loading.From these three sets of VR data and t he tcPCO data,the slopes of the regression lines wer e obtained.
For directly measured minute ventilation,mea- sured minute ventilation was divided by steady state minute ventilation to obtai n VR. From these three sets of VR data and the t cPCO data,slopes of the regression lines were obtai ned.
Data are expressed as mean±SE. Differences
S.KAGAWA ,et al. Vol.52,No.2 60
Fig.1. The regression line between the slopes of the HCVR measured with t he Hazinski method, which measures tcPco,and with direct measure- ment of minute ventilation was Y=0.041+0.627・ X. The two slopes were strongly correlated.
(R =0.404,P=0.026;n=12).
with a P value less than 0.05 were considered statisti- cally significant. The StatView software package (Abacus Concepts,Berkeley,CA)was used for regres- sion analysis.
RESULTS
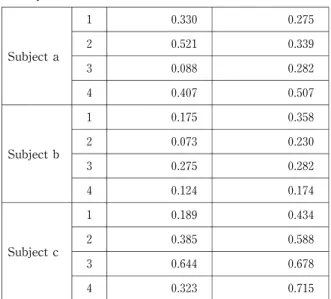
With the Hazinski method,the value of the slopes of the regression lines for HCVR obt ained from 4 measurements in each of t he 3 subjects was 0.30±
0.05/mmHg (n=12;Table 1). For directly mea- sured minute ventilation,the value of the slopes of the regression lines for HCVR obt ained from 4 measure- ments in each of the 3 subjects was 0.41±0.05/mmHg (n=12;Table 1). The slopes obtained with these two methods were significant ly correlated(R =0.404, P=0.026;n=12).
DISCUSSION
This study shows that the slope of HCVR calcu- lated from the values of transcutaneous PCO is cor- related well to the directly measured HCVR.
When HCVR is directly measured in healthy subjects without hypercapni a,the increase in ventila- tion per 1 mmHg of arterial partial pressure of CO (PaCO )is 50% of the steady state ventilation. For example,when minute vent ilation is 6 L/min,ventila- tion increases by 3 L/min,and the slope is 3 L/min/
mmHg of PaCO . If we convert these numbers to reflect the ventilatory res ponse that Hazinski et al. found based on tcPCO in newborns,ventilation would have increased from 1 to 1. 5 L/min and the slope would be 0.5 L/min/mmHg of PaCO . In our study the slope calculated from di rect measurement of minute ventilation was 0. 41±0.05(n=12),which is close to the expected value.
However,the slope we calculated on the basis of tcPCO was 0.30±0.05(n=12) . How can this low value be explained? The t cPCO is thought to reflect PaCO accurately,and ther e would be no significant error in measuring ventil ation. However,with the Hazinski method,CO cl earance is estimated with alveolar ventilation, not wi th total ventilation.
Therefore,changes in dead space may affect the
results. In other words,differences in the slopes might be due to an error in measuring PCO .Specifi- cally,there might be a difference between PCO measured at the mouth and alveolar PCO due to the effect of dead space when meas uring HCVR.
Because our subjects were in a semisitting position, this dead space effect might have been the result of the mechanism reported by Larson and Severinghaus.
Hazinski et al.have also reported that in infants the slope is between 0.22 and 0. 78. This wide range may be the result of using PCO i n both the X‑axis as the stimulus and the Y‑axi s as the response. Another explanation is that as PCO r ises,the response is computed from the difference between numbers that are approaching each ot her,so any measurement errors increase when inspi red CO is high.
Another source of error with the Hazinski method is the assumption t hat CO excretion remains constant,even when PCO i s increased. This is almost certainly incorrect to a small extent because body stores gradually incr ease at higher PCO levels.
Despite these sources of error,our directly mea- sured values were similar to values we obtained with the Hazinski method. The s lope of the values
Hypercapnic Ventilatory Response with tcPCO June,2005
Table 1.Slopes of the hypercapnic ventilatory response obtained with t he Hazinski method and with direct measur ement of minute venti- lation
Slope
Subject Test Hazinski Method Direct Measurement
1 0.330 0.275
Subject a 2 0.521 0.339
3 0.088 0.282
4 0.407 0.507
1 0.175 0.358
Subject b 2 0.073 0.230
3 0.275 0.282
4 0.124 0.174
1 0.189 0.434
Subject c 2 0.385 0.588
3 0.644 0.678
4 0.323 0.715
61
obtained with the Hazinski method and the slope of the directly measured HCVR wer e strongly correlat- ed.
We conclude that the Hazinski method is useful for estimating directly meas ured HCVR.
This work was presented at Japan Society of Anesth- esiologists,50th annual meeting,held at Yokohama, Japan,on May 31,2003.
Acknowledgment:We wish to express our gratitude to Mimi Zeiger,M.A,Uni versity of California,San Francisco,for editing the manus cript.
REFERENCES
1. Hazinski TA,Severinghaus JW,Marin MS,Tooley WH.
Estimation of the steady‑state ventilatory response to carbon dioxide in newborn i nfants using skin surface electrodes. In:Huch R,Huch A,edi tors. Continuous transcutaneous blood gas moni toring. New York and Basel:Marcel Dekker,Inc.;1983.p.432‑9J.
2. Severinghaus J. Transcutaneous blood gas analysis. Respir Care 1982;27:152‑9.
3. Fujiwara C,Shoji K,Otake T,Kagaya S,Takinami M, Kagawa S. Hypercapnic ventilatory responses mea- sured by transcutaneous PCO are more linear than those measured by end‑tidal PCO . Ji keikai Med J 2002;49:
127‑32.
4. Otake T,Fujiwara C,Takinami M,Kagaya S,Kagawa S. Transcutaneous carbon di oxide partial pressure measurement is more reliabl e than end‑tidal carbon dioxide partial pressure meas urement under controlled mechanical ventilation. Jikei kai Med J 2000;47:219‑
26.
5. Larson CP JR,Severinghaus JW. Postural variations in dead space and CO gradient s breathing air and O . J Appl Physiol 1962;17:417‑20.
S.KAGAWA ,et al. Vol.52,No.2 62