The Application of Bowhead Whale Bone
Architectural Indices to Prehistoric Whale
Bone Dwelling Sites in Alaska and the Canadian Arctic
著者(英) James M. Savelle, Allen P. McCartney journal or
publication title
Bulletin of the National Museum of Ethnology
volume 27
number 2
page range 361‑387
year 2002‑11‑20
URL http://doi.org/10.15021/00004042
The Application of Bowhead Whale Bone Architectural Indices to Prehistoric Whale Bone Dwelling Sites
in Alaska and the Canadian Arctic
James M. Savelle* and Allen P. McCartney**
アラスカおよびカナダ極北における先史鯨骨住居跡への ホッキョククジラ骨建造指数の適用
ジェイムズ・M・サベール,アレン・P・マッカートニー
An architectural utility index for bowhead whale bone, as originally devised by Savelle (1997), is modified and applied to 5 excavated and 20 unexcavated winter sites in the Canadian Arctic and Alaska at which dwell- ings constructed of bowhead whale bone occur. The results indicate that, overall, the index is a valid predictor of specific bone element use in winter dwelling construction. In addition, the results suggest that the extent of use of individual middle and lower ranked elements was apparently determined by relative numbers of bowhead carcasses available to individual site occu- pants. Finally, although absolute bone numbers are lower, bone element pat- terns in the surface bones of unexcavated sites are very similar to those of excavated sites, suggesting that the detailed recording of surface whale bone will give a reasonably accurate indication of total site whale bone use.
サベール(1997)が最初に開発したホッキョククジラ骨のための建造利用指 数を修正し,カナダ極北とアラスカにおいて発掘された冬の遺跡5ヶ所と未発 掘の冬の遺跡20ヶ所へ適用する。それらの遺跡の住居跡はホッキョククジラの 骨で建造されていた。指標を適用した結果は,全体的にその指標が冬の住居を 建造するときに特定の骨が利用されていることを示す有効な予測手段であるこ とを示している。さらに,中位ランクや下位ランクの骨を利用する範囲は,そ れぞれの遺跡の居住者が利用することができたホッキョククジラの遺骸の相対 * McGill University, Canada
** University of Arkansas, U.S.A.
Key Words : bowhead whale bone, architectural utility indices, Alaska, Canadian Arctic キーワード: ホッキョククジラの骨,建造利用指標,アラスカ,カナダ極北
的な数によって明らかに規定されていたことを,結果は示唆している。最後に,
発掘された遺跡に比べると未発掘の遺跡で見つかっている骨の総数は少ない が,地表上で見える骨のパターンは発掘された遺跡の骨のパターンに酷似して いる。このことは,地表で見える鯨骨を詳細に記録すれば,遺跡における鯨骨 利用をかなり正確に示すことができることを示唆している。
The use of bowhead and other baleen whale bones as architectural material is a hallmark of many prehistoric and historic Inuit and Yupik societies, and in the North Pacific area baleen whale bones occur, albeit in small quantities, in sites dating to as early as 6000 B.P. (see e.g., Dumond and Bland 1995; Dumond 1998). Although there is much uncertainty surrounding the derivation of whale bones at earlier pre- historic sites, certainly by the time of the emergence of Punuk culture (ca. 1200-700 B.P.) whaling as a primary subsistence activity amongst several northern societies was well established (see Whitridge 1999a for an extended review of the origins and development of Inuit and Yupik whaling). While there has been a relatively long tradition of the recording of whale bone incorporated in prehistoric dwell- ings, it is only recently that analyses have tended to extend beyond simple bone counts and description. These more recent studies have involved analyses from, for example, symbolic and social (e.g., Sheehan 1985; 1997; Patton 1996; Whitridge 1999b; Savelle 2000; Dawson 2001), animal age/size selection (e.g., McCartney 1978; 1980; McCartney and Savelle 1993; Krupnik 1993; Savelle and McCartney 1994; 1999; Savelle et al. 2001), taphonomic (e.g., McCartney 1979b; Habu and Savelle 1994; Park 1997), and technological (e.g., Reinhardt 1986; Savelle 1997;
Dawson 2001) perspectives. In this paper, and following on from Savelle (1997), we examine variation in the occurrence of bowhead whale bones at a series of prehistoric whaling sites in northern Alaska and Canada, and interpret this variation in the context of architectural utility of individual bone elements and relative whale carcass availability.
1 Whale Bone Dwellings and the Ethno- graphic Record
2 Bowhead Whale Bone Architectural and Meat Utility Indices
3 Study Areas and Data Collection 4 Application of the Indices 5 Discussion and Conclusions
1 Whale Bone Dwellings and the Ethnographic Record
The most detailed descriptions of the use of bowhead whale bones in dwell- ing construction are those relating to the early historic North Alaskan Inupiat.
These societies utilized bowhead (and other) whale bones in varying portions in the two principal types of dwellings occupied by them, domestic dwellings and kariyit (ceremonial houses; sing. karigi), as well as in other features such as storage and burial racks, and mannixsak (‘blanket toss’ supports). The semi-subterranean residential dwellings consisted of a main living space constructed primarily from wood (driftwood) and sod. This was accessed by a long, semi-subterranean entrance passage that typically incorporated bowhead whale mandibles, ribs, vertebrae and scapulae (see e.g., Murdoch 1892; Rainey 1947: 244; Spencer 1959: 51-52; Burch 1981; Lowenstein 1993: 32-33). Kariyit were generally much larger than residential dwellings, and lacked sleeping platforms, instead having seating benches along most or all walls. While most kariyit entrances were also constructed from whale bones, Sheehan (1997: 156-157) notes that the prehistoric mound 34 karigi at Utqiagvik in northern Alaska incorporated whale bones in its entire superstructure.
Whale bones functioned not only in strictly architectural contexts, but also in symbolic contexts. The symbolic function of whale bones has been discussed in detail by Lowenstein (1993), Patton (1996) and Sheehan (1997), among others.
Briefly, at least in northern Alaska, individual dwellings represented individual whales, and the extensive use of whale bones, especially mandibles, in the entrance symbolized the whale’s mouth; thus, an individual who entered a dwelling was in fact symbolically entering a whale through its mouth. This symbolism is particularly evident in the Inupiaq myth of the raven and the whale (see e.g., Lowenstein 1993:
41). According to this myth, a raven flies into the jaws of a whale and enters a dwelling, where he finds a woman on a sleeping bench tending a lamp. The woman warns the raven not to touch the lamp, and on a regular basis she leaves, returning shortly afterwards. However, at one point the raven extinguishes the lamp, and the young woman falls dead. The woman was the whale’s soul, the lamp was the whale’s heart, and she left the dwelling (whale) each time the whale breathed.
In the eastern Canadian Arctic, large semi-subterranean whale bone dwellings similar in construction to those in northern Alaska were used extensively by prehis- toric Thule Inuit (the direct descendants of prehistoric Thule in northern Alaska), but were abandoned well before the first ethnographers, and indeed most explorers, visited the area. Due to the shortage of driftwood, however, in most instances the entire superstructure was constructed from whale bones.
2 Bowhead Whale Bone Architectural and Meat Utility Indices
Bowhead whales (Figure 1) are the largest prey species ever actively hunted by any prehistoric or historic native society, with adults attaining lengths of up to 20 m and weighing in excess of 50,000 kg (Nerini et al. 1984; Reeves 1991). The bowhead architectural and meat utility indices were developed by Savelle (1997) in order to formally investigate how architectural bowhead whale bone assemblages (Figure 2) might differ from nutritionally derived assemblages (see Figure 1 for individual bone elements used in the indices). The architectural utility index (Table 1) is based on individual bowhead bone element dimensions, shape and weight, incorporates both ‘bulk’ and ‘frame’ utility, and relies on a number of data sources relating to both bowhead whales and physically very similar North Pacific right whales. Briefly, the rationale behind the derivation of the architectural utility index is that whale bones will be selected for dwelling construction in direct proportion to their usefulness as structural components. Thus, long, cylindrical and/or narrow bones, such as mandibles, maxillae/premaxillae and ribs, can be expected to be preferred over short, irregular bones in the construction of the roof superstructure, and thus they have a high ‘frame’ utility. Bones that are compact and heavy, such as crania and cervical vertebrae, on the other hand, can be expected to be preferred over other bones in the construction of the walls, and thus have a high ‘bulk’ utility.
When both utility measures are combined (see Savelle 1997), the result is an overall architectural utility index, or AUI.
The meat utility index, or MUI, is based on a meat utility index developed for smaller cetaceans (primarily odontocetes) by Savelle and Friesen (1996), with appropriate modifications to take into account differences in bowhead anatomy. The
Figure 1 Bowhead whale and skeleton (after Savelle and McCartney 1991). Labelled bone elements: cr — cranium; md — mandible; mx — maxillae and premaxillae; sc
— scapula; crv — cervical vertebrae (fused unit); thv — thoracic vertebrae; lbv
— lumbar vertebrae; cdv — caudal vertebrae; rb — ribs.
rationale for the development of the meat utility index is based on the premise that, from a subsistence perspective and other things being equal, bones that have high food values will be transported from butchering to residential bases in greater pro- portion than those with low food value. Accordingly, each bone element is assigned an index value based on the amount of meat that is associated with that element, in turn based on experimental or published data. These values are given as percent weight relative to the bone element with the largest amount of associated meat. For example, in the case of bowhead whales, lumbar vertebrae, as a unit, have the great- est amount of associated meat, and are thus given a value of 100, and values for all other bone elements are given as percentages relative to lumbar vertebrae (Table 1).
In the case of the original bowhead whale AUI and MUI values, there is a weak but negative correlation between the two indices (rs = –0.0498, P = 0.872)1). In particular, the crania, mandibles, maxillae and premaxillae, and cervical vertebrae (as a fused unit), the highest ranked elements from an architectural perspective, have very low meat utility values. Conversely, the caudal vertebrae and hyoid, while high on the meat utility index, are ranked very low on the architectural index. The indices as originally developed were applied by Savelle (1997) to a series of prehis- toric Thule Inuit features at a site (PaJs13) at Hazard Inlet on southeastern Somerset Island in the Canadian Arctic, and the results suggested that in all instances archi- tectural utility was the primary determinant in the selection of bones for feature construction.
Figure 2 Example of visible bowhead whale bone assemblage associated with unexcavated dwelling at the Deblicquy site (site 26 in Figure 3). Allen McCartney provides scale.
For the purposes of the present study, however, we have made several adjust- ments to the indices. First, as we have demonstrated previously (McCartney 1980;
McCartney and Savelle 1993; Savelle and McCartney 1994; 1998; 1999; 2000), the vast majority of bowheads represented at archaeological sites in both the Canadian Arctic and Alaska are in the yearling size range of approximately 7-9 m, which is consistent with historically-documented size selection patterns in Alaska (McCartney 1995). Accordingly, and based on traditional bowhead butchery patterns (see e.g., Spencer 1959; Worl 1980), the vast majority of flipper elements are most certainly
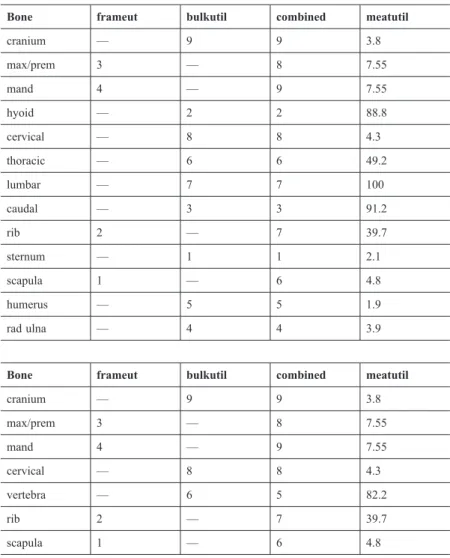
Table 1 Top: Original bowhead whale architectural utility index (‘combined’) and meat utility index (from Savelle 1997). Bottom: Modified bowhead whale architectural (‘combined’) and meat utility indices used in this study.
Bone frameut bulkutil combined meatutil
cranium — 9 9 3.8
max/prem 3 — 8 7.55
mand 4 — 9 7.55
hyoid — 2 2 88.8
cervical — 8 8 4.3
thoracic — 6 6 49.2
lumbar — 7 7 100
caudal — 3 3 91.2
rib 2 — 7 39.7
sternum — 1 1 2.1
scapula 1 — 6 4.8
humerus — 5 5 1.9
rad ulna — 4 4 3.9
Bone frameut bulkutil combined meatutil
cranium — 9 9 3.8
max/prem 3 — 8 7.55
mand 4 — 9 7.55
cervical — 8 8 4.3
vertebra — 6 5 82.2
rib 2 — 7 39.7
scapula 1 — 6 4.8
diet-related, as are the hyoid (as a rider to the tongue), and sternum, and are thus not included. Note that while at several sites in Alaska we have noted some flipper bones from adult bowheads in apparently architectural contexts, these are extremely rare. Furthermore, because these bone elements are rare generally in excavated dwellings (see e.g., Savelle 1997), and because they have four of the five lowest architectural utility values, inclusion of them in the analyses would unnecessarily skew the results in favour of the use of bones with high architectural utility, which is what we are attempting to independently demonstrate.
Second, because we rarely differentiated between thoracic, lumbar, and caudal vertebrae at the sites dealt with in this study, these are combined into one category,
‘vertebrae.’ Given the number of caudal vertebrae (22) vs thoracic (13) and lumbar (13), the resulting weighted ‘vertebrae’ category is ranked as 5 ([6 × 13 + 7 × 13 + 3 × 22]/48 = 4.89) in the architectural utility index. In the case of the meat utility index, the weighted vertebrae rank second highest, behind the hyoid ([49.2% × 13 + 100.0% × 13 + 91.2% × 22]/48 = 82.2%; note, however, that since we apply Spear- man’s rho using the meat utility indices, it is unnecessary to recalculate individual
% MUI for bone elements). Thus, the total number of bone element categories in the respective indices is reduced to 7 from 13 (Table 1). However, this does not alter the negative correlation between the two indices, and in fact considerably strengthens it (rs = –0.587; P = 0.166).
3 Study Areas and Data Collection
The primary data incorporated in the present study were collected by us during several projects undertaken between 1976 and 2001 in the Canadian Arctic and Alaska, and where appropriate, supplemented by additional data from other sources.
The data can be broadly classified into two types, each of which will be dealt with separately. The first category relates to completely or nearly completely excavated dwellings at prehistoric whaling villages. In these instances, total or near-total bone counts are available for individual dwellings. The second type of data consists of a record of all visible surface whale bones observed within and adjacent to individual dwellings at unexcavated sites. In these instances, the indices may still be applied, but with the caveat that although direct numerical comparisons between these and excavated dwellings would be inappropriate, similar use patterns may still be dis- cernable. The locations of the sites which are dealt with in this study are indicated in Figure 3 (Alaska) and Figure 4 (Canadian Arctic). The sites examined in Alaska relate to the prehistoric Birnirk, Early and Late Thule cultures, and early historic Inupiaq culture, while those in the Canadian Arctic relate to various phases of Clas- sic Thule culture (see Table 2).
It should be noted that a number of sites that we visited to document bowhead and other whale bones are not included in this study for various reasons. These
include (a) incomplete bone recording, restricted to several sites in Alaska visited in 1998, when time constraints prevented anything other than strictly recording mea- surements on selected bone elements, (b) apparent or documented extensive scav- enging of bone by recent carvers (e.g., Resolute, Cape Krusenstern), (c) difficulty in associating particular bones to particular excavated and unexcavated dwellings at some of the sites that had been previously excavated (e.g., Port Refuge, Brooman Point, Cape Walker), and (d) significant coastal erosion (e.g., site AB4 in Savelle [1989] at Aston Bay). In addition, we do not include obvious qarmat sites such as the Near site at Creswell Bay (McCartney 1978; Taylor and McGhee 1979). Finally, we acknowledge that many of the sites that we include in the analysis have been, or may have been, subjected to at least some degree of scavenging or recycling of bone during or after the period of site occupation (see e.g., McCartney 1979a, 1979b; Habu and Savelle 1994; Park 1997). In these instances recycling and/or removal is essentially impossible to quantify, although, as noted above, any obvi- ously extensively disturbed sites are not included. Thus, while our results should be viewed with the caveat that we are dealing in many cases with at least some degree of past disturbance, we feel that the investigation of the role of architectural utility in the formation of whale bone assemblages can nevertheless be instructive.
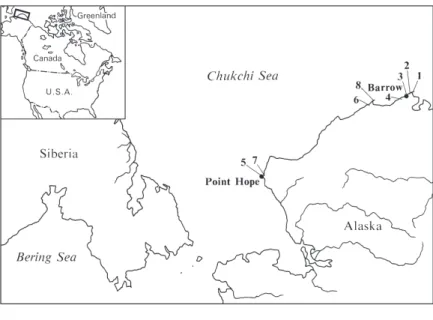
Figure 3 Locations of sites visited in Alaska in relation to the present study (from Savelle and McCartney 1998).
1. Nuwuk 5. Point Franklin
2. Birnirk 6. Nunagiak
3. Utqiagvik 7. Ipiutak
4. Walakpa 8. Tigara
Figure 4 Map of the eastern Canadian Arctic showing locations of prehistoric Thule whaling sites visited in the course of this study (from Savelle and McCartney 1994).
1. Qariarqyuk (Mount Oliver) 16. Back Bay 2 2. Ditchburn Point South 17. Back Bay 3 3. Ditchburn Point North 18. Back Bay 1 4. Hazard Inlet North (PaJs-13) 19. Cape Walker
5. Cape Garry 20. ‘Beach sites’
6. Idlout Point South 21. Radstock Bay 7. Idlout point North 22. Resolute
8. Learmonth 23. Porden Point
9. Near 24. Port Refuge
10. Quoak 25. Brooman Point
11. ‘Beach sites’ 26. Deblicquy
12. Batty Bay 27. Black Point
13. Port Leopold 28. ‘Beach sites’
14. Aston Bay South 28. Cape Evans 15. Aston Bay North (6 sites) 30. Fellfoot Point
N.B. ‘Beach sites’ consist primarily of bowhead whale flensing locations and caches. C — inferred ‘core’ whaling area; I — inferred ‘intermediate’ whaling area; P — inferred ‘peripheral’
whaling area.
4 Application of the Indices
Excavated Dwellings. We deal with excavated bowhead bone assemblages from dwellings at five different sites in Alaska and the Canadian Arctic: Birnirk, Cape Garry, Learmonth, Hazard Inlet, and Porden Point.
Birnirk: Ford (1959) excavated or tested a total of six of the 16 dwelling mounds at the Birnirk site, adjacent to the community of Barrow in 1932. We visited the site in 1996 (Savelle and McCartney 1998), and use bone totals we recorded for his dwellings ‘A’ and ‘H’, which, on the basis of Ford’s (1959) descriptions and our site inspection, appeared to have been the most completely excavated. These bones were situated in and adjacent to the respective mounds.
Cape Garry: McCartney excavated three dwellings at Cape Garry in 1976 (McCartney 1979a), and revisited the site for more detailed, osteometric studies of selected bones in 1978 (McCartney 1978). Savelle visited the site in 1988. Our bones counts are derived from McCartney’s (1978; 1979a) reports.
Learmonth: Taylor excavated one house at the Learmonth site in 1961 (Taylor and McGhee 1979) , and McCartney excavated three houses there in 1976 (McCartney
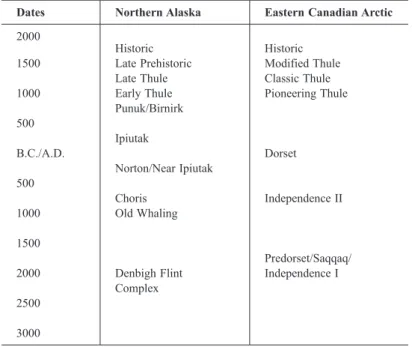
Table 2 Generalized chronological framework for Alaska and the Canadian Arctic (after Whitridge 1999a).
Dates Northern Alaska Eastern Canadian Arctic
2000 Historic Historic
1500 Late Prehistoric Modified Thule
Late Thule Classic Thule
1000 Early Thule Pioneering Thule
Punuk/Birnirk
500 Ipiutak
B.C./A.D. Dorset
Norton/Near Ipiutak
500 Choris Independence II
1000 Old Whaling
1500 Predorset/Saqqaq/
2000 Denbigh Flint Independence I
Complex 2500
3000
1979a), and visited the site again in 1978 as part of the osteometric study noted above (McCartney 1978). The bone totals used here are based on those recorded by McCartney in 1976 and 1978 for his excavated houses, and by McCartney for Taylor’s previously excavated house (which represent minimal figures only).
Hazard Inlet: Six winter dwellings and a ceremonial structure were excavated by Savelle in 1990 and 1991. Details of the whale bone associated with these dwellings have been reported in Habu and Savelle (1994) and Savelle (1997).
Porden Point: Three dwellings were excavated by McGhee in 1976 and 1977 (McGhee 1977), while a further 10 dwellings were excavated by Park in 1984 and 1985 (Park 1989; 1997). Although we visited the site in 1988, complete bone counts were not possible, since some of the bone had apparently either been removed follow- ing excavation or had been buried during backfilling. Accordingly, in this study we rely on Park’s (1989) compilation, which is derived from his own excavations and McGhee’s report. Note, however, that there is a lack of consistency between the numbers given in Park (1989) and those given in Park (1997) for the same dwell- ings and for the site overall.
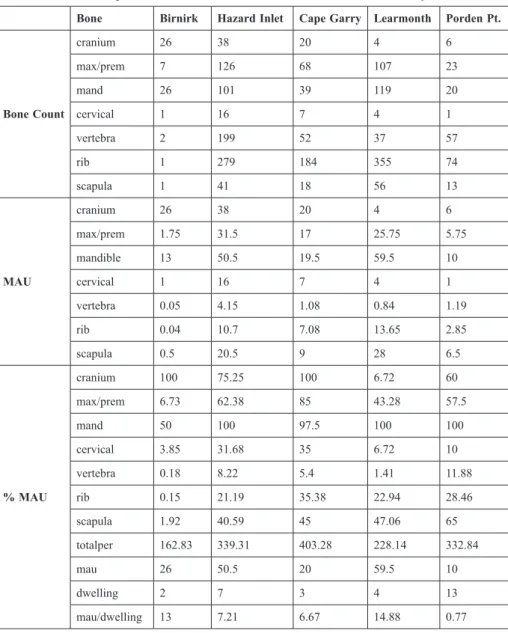
Results. For each site, the original bone element totals (combined for all dwellings), minimal animal units (MAU)2), and conversion of MAU to % MAU2), follow- ing standard zooarchaeological procedures and rationale (see e.g., Binford 1978;
Metcalfe and Jones 1988; Lyman 1994), are presented in Table 3. In addition, and as an indication of the relative skeletal completeness, we also present the sum of all % MAU values for each site (Table 3). A higher total % MAU will indicate less selection for specific bone element types (that is, proportionately more of each skeleton is represented). Since for every assemblage at least one element has a % MAU of 100%, it follows that assemblages with very low % MAU totals will con- sist of primarily one bone element type and few of the other bone element types.
An assemblage with a high % MAU total, on the other hand, would indicate that most bone types were being used in relatively high proportions. Since a total of 7 bone element types are being considered in the present study, the % MAU totals can vary from 100% (only one bone type used) to 700% (all bones from every carcass were used). Finally, we provide what might be termed a whale carcass ‘availability’
index. This is simply the highest MAU divided by the number of dwellings (Table 3), and, other factors being equal, serves as a relative indicator of the number of whale skeletons available to site occupants for consumption and dwelling construction relative to the number of dwellings.
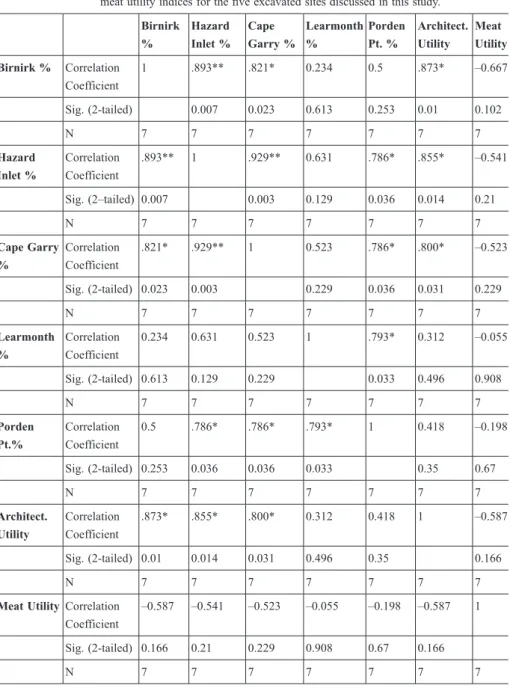
While there is considerable variation between sites, all nevertheless show a positive correlation between AUI and % MAU (Table 4), with three (Birnirk, Hazard Inlet and Cape Garry) having Spearman’s correlation coefficients of .800
or greater and significant at the .05 level. The correlation between the bowhead MUI and % MAU, on the other hand, is weakly to moderately negative in all cases (Table 4). Scatterplots of % MAU against AUI are given in Figure 5, and illustrate not only the positive correlations in each case, but also a sharp increase in the slope as the highest ranked elements are approached, indicating the importance of both frame and bulk utility in dwelling construction. The one exception is the Learmonth
Table 3 Bowhead whale bone raw counts, MAU conversions, and % MAU and MAU/
dwelling conversions for the five excavated sites discussed in this study.
Bone Birnirk Hazard Inlet Cape Garry Learmonth Porden Pt.
Bone Count
cranium 26 38 20 4 6
max/prem 7 126 68 107 23
mand 26 101 39 119 20
cervical 1 16 7 4 1
vertebra 2 199 52 37 57
rib 1 279 184 355 74
scapula 1 41 18 56 13
MAU
cranium 26 38 20 4 6
max/prem 1.75 31.5 17 25.75 5.75
mandible 13 50.5 19.5 59.5 10
cervical 1 16 7 4 1
vertebra 0.05 4.15 1.08 0.84 1.19
rib 0.04 10.7 7.08 13.65 2.85
scapula 0.5 20.5 9 28 6.5
% MAU
cranium 100 75.25 100 6.72 60
max/prem 6.73 62.38 85 43.28 57.5
mand 50 100 97.5 100 100
cervical 3.85 31.68 35 6.72 10
vertebra 0.18 8.22 5.4 1.41 11.88
rib 0.15 21.19 35.38 22.94 28.46
scapula 1.92 40.59 45 47.06 65
totalper 162.83 339.31 403.28 228.14 332.84
mau 26 50.5 20 59.5 10
dwelling 2 7 3 4 13
mau/dwelling 13 7.21 6.67 14.88 0.77
Table 4 Spearman’s rank order correlations of % MAU against architectural and meat utility indices for the five excavated sites discussed in this study.
Birnirk
%
Hazard Inlet %
Cape Garry %
Learmonth
%
Porden Pt. %
Architect.
Utility
Meat Utility Birnirk % Correlation
Coefficient
1 .893** .821* 0.234 0.5 .873* –0.667
Sig. (2-tailed) 0.007 0.023 0.613 0.253 0.01 0.102
N 7 7 7 7 7 7 7
Hazard Inlet %
Correlation Coefficient
.893** 1 .929** 0.631 .786* .855* –0.541
Sig. (2–tailed) 0.007 0.003 0.129 0.036 0.014 0.21
N 7 7 7 7 7 7 7
Cape Garry
%
Correlation Coefficient
.821* .929** 1 0.523 .786* .800* –0.523
Sig. (2-tailed) 0.023 0.003 0.229 0.036 0.031 0.229
N 7 7 7 7 7 7 7
Learmonth
%
Correlation Coefficient
0.234 0.631 0.523 1 .793* 0.312 –0.055
Sig. (2-tailed) 0.613 0.129 0.229 0.033 0.496 0.908
N 7 7 7 7 7 7 7
Porden Pt.%
Correlation Coefficient
0.5 .786* .786* .793* 1 0.418 –0.198
Sig. (2-tailed) 0.253 0.036 0.036 0.033 0.35 0.67
N 7 7 7 7 7 7 7
Architect.
Utility
Correlation Coefficient
.873* .855* .800* 0.312 0.418 1 –0.587
Sig. (2-tailed) 0.01 0.014 0.031 0.496 0.35 0.166
N 7 7 7 7 7 7 7
Meat UtilityCorrelation Coefficient
–0.587 –0.541 –0.523 –0.055 –0.198 –0.587 1
Sig. (2-tailed) 0.166 0.21 0.229 0.908 0.67 0.166
N 7 7 7 7 7 7 7
**Correlation is significant at the .01 level (2-tailed).
*Correlation is significant at the .05 level (2-tailed).
site, at which crania are severely under-represented. However, in this instance the 86 crania at the nearby fall whaling camp consisting exclusively of qarmats (the Near site — see Taylor and McGhee 1979 and McCartney 1978) are most certainly derived from the same whales as those represented at the Learmonth site.
Not only are the highest ranked elements present in proportionately greater frequencies, but there is also a relatively strong negative correlation between MAU/
dwelling (the whale ‘availability’ index) and the total of the % MAUs for each site
Figure 5 Scatterplots of architectural index against % MAU values for excavated sites discussed in this study.
(rs = –0.600, P = 0.285; Figure 6). The above relationship is especially evident when comparing vertebrae and ribs, the lowest and medium ranked elements respec- tively, with mandibles, the highest (with crania) ranked element (Figure 7). This is reminiscent of the ‘bulk’ and ‘gourmet’ strategies in animal butchery and transport as identified by Binford (1978), in which, other factors being equal, the greater the number of animals available, the more selective the removal and transport of high utility parts. In the case of architectural utility, then, the suggestion can be made that the greater the relative availability of whale carcasses (that is, the higher the MAU/dwelling), the greater the selectivity for higher utility elements (that is, the lower the % MAU total).
Figure 6 Scatterplot of aggregate % MAU values against MAU/dwelling for the five excavated sites discussed in this study.
Figure 7 Scatterplot of % MAU values for mandibles, ribs and vertebrae against MAU/dwelling for the five excavated sites discussed in this study.
Unexcavated Dwellings. A total of 20 sites containing unexcavated dwellings are examined in this study, four in Alaska and 16 in the Canadian Arctic (Figures 3 and 4). The sites in the Canadian Arctic were visited by us in 1988 (Savelle revisited the Quoak site in 2001) and the northern Alaska sites in 1996. However, Whitridge (1999b) mapped in detail all whale bones at the Mount Oliver site in 1992, and we use his data for that site.
Results. The original bone element totals (combined for all dwellings), minimal animal units (MAU), and conversion of MAU to % MAU, summed % MAU values, and MAU/dwelling for each site are presented in Table 5. As with the excavated dwellings, while there is considerable variation between sites, all nevertheless show a positive correlation between AUI and % MAU, with nine having correlation coefficients of .800 or greater and significant at the .05 level, and the remainder moderately strong correlations. Again as with the excavated sites, the correlation between the bowhead MUI and % MAU, is weakly to moderately negative in the majority of cases (15 out of 20), and very weakly positively correlated in the remaining five (Table 6). Scatterplots of % MAU against AUI are given in Figure 8, and again illustrate not only the positive correlations in each case, but also a sharp increase in the slope as the highest ranked elements are approached.
Furthermore, as with the excavated dwellings, there is a strong negative corre- lation between MAU/dwelling (the whale ‘availability’ index) and the total of the % MAUs for each site (Figure 9; rs = –0.637, P = 0.003). Again, as with the excavated sites, this relationship is especially evident when comparing vertebrae and ribs, the low and medium ranked elements respectively, with mandibles, the highest (with crania) ranked element (Figure 10). Again, this is reminiscent of the ‘bulk’ and
‘gourmet’ strategies in animal butchery and transport as discussed above.
Note, however, that in a number of instances, crania are greatly under- represented relative to mandibles. In the case of Tigara, the symbolic return of the skull to the sea at the time of butchering has been well documented (see e.g., Larsen and Rainy 1948; VanStone 1962; Worl 1980; Lowenstein 1993). This may have been the case in several of the other instances with extremely low crania % MAU values. However, as indicated in Table 7 and Figure 11, there is a very weak, but negative, correlation between crania and MAU/dwelling (rs = –.087; P = .714). This would suggest that, while crania retain the highest ‘bulk’ utility rating, they should be given a lower utility value than mandibles in the combined utility ranking given by Savelle in the original study (see Table 1).
Bone Nuwuk Utqiag-vik Nunag-iak Tigara Mt.
Oliver
Ditch-burn A
Ditch-burn B
Idlout South
Idlout North
Quoak Batty Bay
Port Leopold
Radstock Bay
Aston Bay 4
Aston Bay 5
Aston Bay 12
Aston Bay 17
Cape Evans
Debliquy Black Pt.
Bone Count
cranium 7 19 22 3 40 20 1 7 3 48 1 4 11 8 7 0 1 2 26 1
max/pre 3 7 13 3 344 66 8 12 4 70 26 22 59 25 7 5 19 4 73 10
mand 24 78 96 272 517 35 9 17 8 220 52 38 84 20 22 3 36 7 119 26
cervical 0 0 2 0 17 5 1 2 0 2 0 1 1 3 3 1 0 0 7 1
vertebra 0 4 8 1 324 70 29 16 16 17 8 59 20 24 1 13 7 23 132 25
rib 3 22 1 25 421 119 17 13 12 77 136 184 63 92 8 21 25 16 356 45
scapula 0 3 3 15 113 25 1 2 1 23 6 13 9 1 1 1 1 1 22 9
MAU
cranium 7 19 22 3 40 20 1 7 3 48 1 4 11 8 7 0 1 2 26 1
max/pre 0.75 2 3.25 0.75 86 16.5 2 3 1 17.5 6.5 5.5 14.75 6.25 1.75 1.25 4.75 1 18.25 2.5
mand 12 39 48 136 258.5 17.5 4.5 8.5 4 110 26 19 42 10 11 1.5 18 3.5 59.5 13
cervical 0 0 2 0 17 5 1 2 0 2 0 1 1 3 3 1 0 0 7 1
vertebra 0 0.08 0.17 0.02 6.75 1.46 0.6 0.33 0.33 0.35 0.17 1.23 0.42 0.5 0.02 0.27 0.14 0.48 2.75 0.52
rib 0.12 0.85 0.04 0.96 16.2 4.58 0.65 0.5 0.46 2.96 5.23 7.07 2.42 3.54 0.31 0.81 0.96 0.62 13.69 1.73
scapula 0 1.5 1.5 7.5 56.5 12.5 0.5 1 0.5 11.5 3 6.5 4.5 0.5 0.5 0.5 0.5 0.5 11 4.5
% MAU
cranium 58.33 48.72 45.83 2.2 15.47 100 22.22 82.35 75 43.64 3.85 21.05 26.19 80 63.64 0 5.56 28.57 43.7 7.69
max/pre 6.25 4.62 6.77 0.06 33.27 82.5 44.44 35.29 25 15.91 25 28.95 35.12 62.5 15.91 83.33 26.39 32.14 30.67 19.23
mand 100 100 100 100 100 87.5 100 100 100 100 100 100 100 100 100 100 100 100 100 100
cervical 0 0 4.17 0 6.58 25 22.22 23.53 0 1.82 0 5.26 2.38 30 27.27 66.67 0 0 11.76 7.69
vertebra 0 0.2 0.35 0.01 2.61 7.29 13.42 3.92 8.32 0.32 0.64 6.47 0.99 5 0.19 18.07 0.81 7.71 4.62 4
rib 0.96 2.17 0.08 0.71 6.27 22.9 14.51 5.88 11.53 2.69 20.12 37.21 5.77 35.4 2.79 53.87 5.33 13.19 23.01 13.31
scapula 0 3.85 3.13 5.51 21.86 62.5 11.11 11.76 12.5 10.45 11.54 34.21 10.71 5 4.55 33.33 2.78 7.14 18.49 34.62
totalper 165.54 159.55 160.33 108.98 186.05 387.69 227.93 262.73 232.36 174.83 161.14 233.15 181.17 317.9 214.35 355.27 140.86 188.76 232.25 186.54
mau 12 39 48 136 25.5 20 4.5 8.5 4 110 26 19 42 10 11 1.5 18 7 59.5 13
dwelling 6 16 12 7 57 12 8 5 5 24 7 17 12 5 5 5 9 9 24 13
mau/dwl 2 2.44 4 19.43 4.54 1.67 0.56 1.7 0.8 4.58 3.71 1.12 3.5 2 2.2 0.3 2 0.78 2.48 1
Table 6 Spearman’s rank order correlations of % MAU against architectural and meat utility indices for the 20 unexcavated sites discussed in this study.
Arch Utility Meat Utility Arch Utility Meat Utility Arch. Utility Correlation 1.000 –.587 Quoak % Correlation .800* –.396
Coefficient Coefficient
Sig. (2-tailed) .166 Sig. (2-tailed) .031 .379
N 7 7 N 7 7
Meat Utility Correlation –.587 1.000 Batty Bay % Correlation .346 .270
Coefficient Coefficient
Sig. (2-tailed) .166 Sig. (2-tailed) .448 .558
N 7 7 N 7 7
Nuwuk % Correlation .830* –.150 Port Leopold %Correlation .200 .270
Coefficient Coefficient
Sig. (2-tailed) .021 .749 Sig. (2-tailed) .667 .558
N 7 7 N 7 7
Utqiagvik % Correlation .673 –.216 Radstock Bay %Correlation .727 –.270
Coefficient Coefficient
Sig. (2-tailed) .098 .641 Sig. (2-tailed) .064 .558
N 7 7 N 7 7
Nunagiak % Correlation .873* –.541 Aston Bay 4% Correlation .917** –.255
Coefficient Coefficient
Sig. (2-tailed) .010 .210 Sig. (2-tailed) .004 .582
N 7 7 N 7 7
Tigara % Correlation .364 –.144 Aston Bay 5% Correlation .946** –.582
Coefficient Coefficient
Sig. (2-tailed) .423 .758 Sig. (2-tailed) .001 .102
N 7 7 N 7 7
Mt. Oliver % Correlation .618 –.342 Aston Bay 12%Correlation .346 .162
Coefficient Coefficient
Sig. (2-tailed) .139 .452 Sig. (2-tailed) .448 .728
N 7 7 N 7 7
Ditchburn A %Correlation .855* –.667 Aston Bay 17%Correlation .636 .018
Coefficient Coefficient
Sig. (2-tailed) .014 .102 Sig. (2-tailed) .124 .969
N 7 7 N 7 7
Ditchburn B %Correlation .844* –.182 Cape Evans % Correlation .600 .162
Coefficient Coefficient
Sig. (2-tailed) .017 .696 Sig. (2-tailed) .154 .728
N 7 7 N 7 7
Idlout South %Correlation .946** –.577 Debliquuy % Correlation .837* –.288
Coefficient Coefficient
Sig. (2-tailed) .001 .175 Sig. (2-tailed) .019 .531
N 7 7 N 7 7
Idlout North %Correlation .673 –.216 Black Pt. % Correlation .312 –.055
Coefficient Coefficient
Sig. (2-tailed) .098 .641 Sig. (2-tailed) .496 .908
N 7 7 N 7 7
*Correlation is significant at the .05 level (2-tailed).
**Correlation is significant at the .01 level (2-tailed).
Figure 8 Scatterplots of architectural index against % MAU values for the 20 unexcavated sites discussed in this study.
Figure 8 (continued)
Figure 8 (continued)
Figure 10
Scatterplot of % MAU values for mandibles, ribs and vertebrae against MAU/dwelling for the 20 unexcavated sites discussed in this study.
Figure 9
Scatterplot of aggregate % MAU values against MAU/dwelling for the 20 unexcavated sites discussed in this study.
Figure 11
Scatterplot of % MAU values for crania against MAU/dwelling for the 20 unexcavated sites discussed in this study.
Table 7 Spearman’s rank order correlations of % MAU for individual bone elements and MAU/dwelling for the 20 unexcavated sites discussed in this study.
CRANIA MAX/PRE MAND CERV VERT RIBS SCAP TOTPER MAU DWELL MAU/DWL CRANIA Correlation 1.000 .074 –.378 .135 –.092 –.230 –.256 .397 –.197 –.289 –.087 Coefficient
Sig. (2-tailed) .755 .100 .571 .701 .329 .277 .083 .405 .217 .714
N 20 20 20 20 20 20 20 20 20 20 20
MAX/PRE Correlation.074 1.000 –.338 .544** .724** .657** .383 .768** -.411 -.265 -.513* Coefficient
Sig. (2-tailed) .755 .144 .013 .000 .002 .096 .000 .072 .259 .021
N 20 20 20 20 20 20 20 20 20 20 20
MAND Correlation –.378 –.338 1.000 –.262 –.219 –.219 –.378 –.378 –.060 –.060 .139 Coefficient
Sig. (2-tailed) .100 .144 .264 .354 .354 .100 .100 .803 .801 .558
N 20 20 20 20 20 20 20 20 20 20 20
CERV Correlation .135 .544* -.262 1.000 .389 .484* .440 .660** –.205 –.213 –.215 Coefficient
Sig. (2-tailed) .571 .013 .264 .090 .031 .052 .002 .386 .367 .362
N 20 20 20 20 20 20 20 20 20 20 20
VERT Correlation –.092 .724** –.219 .389 1.000 .798** .617** .713** –.517* –.170 –.711*
Coefficient
Sig. (2-tailed) .701 .000 .354 .090 .000 .004 .000 .020 .473 .000
N 20 20 20 20 20 20 20 20 20 20 20
RIBS Correlation –.230 .657** –.219 .484** .798** 1.000 .695** .681** –.311 –.088 –.489* Coefficient
Sig. (2-tailed) .329 .002 .354 .031 .000 . .001 .001 .182 .712 .028
N 20 20 20 20 20 20 20 20 20 20 20
SCAP Correlation –256 .383 –.378 .440 .617** .695** 1.000 .502* .048 .260 -.232 Coefficient
Sig. (2-tailed) .277 .096 .100 .052 .004 .001 . .024 .840 .269 .325
N 20 20 20 20 20 20 20 20 20 20 20
TOTPER Correlation .397 .768** –.378 .660** .713** .681** .502* 1.000 –.553* –.352 –.637*
Coefficient
Sig. (2-tailed) .083 .000 .100 .002 .000 .001 .024 .011 .128 .003
N 20 20 20 20 20 20 20 20 20 20 20
MAU Correlation –.197 –.411 –.060 –.205 –.517* –.311 .048 –.553* 1.000 .812** .886**
Coefficient
Sig. (2-tailed) .405 .072 .803 .386 .020 .182 .840 .011 .000 .000
N 20 20 20 20 20 20 20 20 20 20 20
DWELL Correlation –.289 –.265 –.060 –.213 –.170 –.088 .260 –.352 .812** 1.000 .491*
Coefficient
Sig. (2-tailed) .217 .259 .801 .367 .473 .712 .269 .128 .000 .028
N 20 20 20 20 20 20 20 20 20 20 20
MAU/DWL Correlation–.087 -.513* .139 –.215 –.711** –.489* –.232 –.637** .886** .491* 1.000 Coefficient
Sig. (2-tailed) .714 .021 .558 .362 .000 .028 .325 .003 .000 .028
N 20 20 20 20 20 20 20 20 20 20 20
*Correlation is significant at the .05 level (2-tailed).
**Correlation is significant at the .01 level (2-tailed).
5 Discussion and Conclusions
Until recently, archaeological whale bone had been noted at various whaling- related prehistoric sites in Alaska and Canada, but beyond cursory descriptions, had rarely been subjected to any detailed analyses. In this paper, we add to the growing body of literature that deals with archaeological whale bone in a broader context, in this instance within an architectural framework. The major conclusions of our study may be summarized as follows:
1. The architectural utility indices for bowhead whale bone as originally devised by Savelle (1997), overall, offer a valid predictor of the extent of incorpora- tion of specific bone elements in winter dwelling construction. However, the inclu- sion of flipper elements, and the hyoid and sternum, as in the original indices, is probably unrealistic, except in the case of adult bowheads. Furthermore, our results indicate that crania are not such important structural elements as the original rank- ing would suggest. In this context, the symbolic disposal of bowhead crania into the sea by historic, and as demonstrated in this study, prehistoric, Inuit at Tigara is consistent with a lower architectural ranking.
2. The extent of use of individual middle and lower ranked elements can generally be predicted by the relative numbers of bowhead carcasses available to individual site occupants. That is, lower carcass availability, as measured by the average bowhead MAU/dwelling per site, results in a relative increase in the use of lower ranked bone elements, analogous to ‘bulk’ as opposed to ‘gourmet’ strategies in meat utility contexts.
3. The study indicates that while absolute numbers of individual whale bone elements will be lower in unexcavated than excavated dwellings, similar trends in bone element use are nevertheless clearly demonstrated by surface bone counts.
This is presumably a reflection of the fact that higher ranked bone elements are also the largest, and thus more likely to remain visible following dwelling collapse and/or overgrowth by vegetation. Accordingly, detailed recording of surface whale bone will give a reasonably accurate indication of total site whale bone use.
Acknowledgments
The data on which this paper is based was collected during several different projects conducted by us. The various agencies which supported these projects are the Northern Environmental Protection Branch, Department of Indian and Northern Affairs (Canada) (McCartney’s 1976 and 1978 field work in the Canadian Arctic), the Social Sciences and Humanities Research Council of Canada (McCartney’s and Savelle’s research in 1988 in the Canadian Arctic, and Savelle’s research there in 1989-1994), the National Science Foundation and the North Slope Borough (McCartney’s and Savelle’s research in Alaska in 1996 and 1998), the Polar Continental Shelf Project (McCartney’s research in the Canadian Arctic in 1976 and 1978, McCartney and Savelle’s research there in 1988, and Savelle’s research there