GEOGRAPHICAL REPORTS
OF TOKYO METROPOLITAN UNIVERSITY 55 (2020) 49–59
TRANSITION AND POTENTIAL OF THE LAND FUNCTION OF THE “TOKUSHACHI” (BARE LANDS)
IN THE SETO DISTRICT, AICHI, JAPAN
Suguru MYOGA
Abstract The mountain forests of the Seto District, Aichi Prefecture, Japan had been plundered as sources of fuel for 1,000 years, leaving a wasteland of bare hills. However, the carbon content of the degraded land at least 75 years after vegetation recovery in late Taisho period (1920’s) was 4.9 to 8.5%. These data suggest that, even in non-productive wastelands like those represented by the bare hills, the land function potential is not necessarily extinguished:the functionality of such bare lands their functionality can be restored by applying appropriate treatments.
Keywords: land function, bare land, Seto ceramic, sabo, afforestation
1. Introduction
The Japanese terms tokushachi and hageyama are commonly translated as “bare lands” and
“bare hills” in English, respectively. Generic bare lands and bare hills arise under natural conditions or anthropogenic pressure; however, the terms tokushachi and hageyama refer specifically to areas deforested by humans. Japan's three major bare hill areas are located in Okayama, Shiga, and Aichi Prefectures, (Ministry of Agriculture, Forestry and Fisheries website). Chiba (1954a, 1954b, 1954c, 1954d) discussed the process of deforestation in the mountains of Okayama Prefecture (Seto Inland Sea region); these areas were transformed into bare lands due to fuel demand (employed in salt production) and the construction of surrounding villages.
The bare lands of Aichi Prefecture are located in correspondence of Seto City, 20 km northeast of Nagoya, which is a major city at the center of the Chubu economic zone. The Seto District occupies part of the Owari hill lands east of the Nobi Plain and is surrounded by small mountains.
There is a Neogene Pliocene formation called the Seto Group in the hills. The strata is rich in high- quality porcelain clay and silica sand, which are raw materials for ceramics and glass, respectively (Committee of Compilation of Seto City 1986).
The history of Seto City is strictly linked to that of ceramics. In fact, ceramic production began in this area in the second half of the 10th century, and that of the famous Koseto (old Seto) pottery in the 12th century. At that time, ceramic production was not geographically limited to a single place as it is now. Rather, people roamed in search of fuel and clay (i.e., the raw material for pottery production); moreover, they built their kilns and produced their wares close the sources of such materials. After the kilns were built, the surrounding forest was cut down to collect firewood (used as fuel), leaving bare land. Around the 9th century, the Seto District was home to secondary forests of konara oak (Quercus serrata) and other species. By the 13th century, however, a regression Miller, R. Z., Watts, A. J. R., Winslow, B. O., Galloway, T. S., and Barrows, A. P. W. 2017. Mountains to the
sea: River study of plastic and non-plastic microfiber pollution in the northeast USA. Marine Pollution Bulletin 124: 245–251.
Nadmitov, B., Hong, S., Kang, I. S., Chu, J. M., Gomboev, B., Janchivdorj, L., Lee, C. H., and Khim, J. S.
2015. Large-scale monitoring and assessment of metal contamination in surface water of the Selenga River Basin (2007–2009). Environmental Science and Pollution Research 22: 2856–2867.
Napper, I. E., and Thompson, R. C. 2016. Release of synthetic microplastic plastic fibres from domestic washing machines: Effects of fabric type and washing conditions. Marine Pollution Bulletin 112: 39–45.
Nel, H. A., Dalu, T., Wasserman, R. J., and Hean, J. W. 2019. Colour and size influences plastic microbead underestimation, regardless of sediment grain size. Science of the Total Environment 655: 567–570.
Pazos, R. S., Maiztegui, T., Colautti, D. C., Paracampo, A. H., and Gómez, N. 2017. Microplastics in gut contents of coastal freshwater fish from Río de la Plata estuary. Marine Pollution Bulletin 122: 85–90.
Peng, G., Xu, P., Zhu, B., Bai, M., and Li, D. 2018. Microplastics in freshwater river sediments in Shanghai, China: A case study of risk assessment in mega-cities. Environmental Pollution 234: 448–456.
Peters, C. A., and Bratton, S. P. 2016. Urbanization is a major influence on microplastic ingestion by sunfish in the Brazos River Basin, Central Texas, USA. Environmental Pollution 210: 380–387.
Piperagkas, O., Papageorgiou, N., and Karakassis, I. 2019. Qualitative and quantitative assessment of microplastics in three sandy Mediterranean beaches, including different methodological approaches.
Estuarine, Coastal and Shelf Science 219: 169–175.
PlasticsEurope. 2015. Plastics - the facts 2015. An analysis of European plastics production, demand and waste data. Brussels: The Association of plastics Manifacturers in Europe.
Pouchert, C, J. 1985. The Aldrich library of FTIR spectra. 1st edition. Wisconsin: Milwaukee.
Rajagopalan, B., Lall, U., and Tarboton, D.G. 1997. Evaluation of kernel density estimation methods for daily precipitation resampling. Stochastic Hydrology and Hydraulics 11: 523–547.
Rezania, S., Park, J., Din, M. F. M., Mat T. S., Talaiekhozani, A., Kumar, Y. K., and Kamyab, H. 2018.
Microplastics pollution in different aquatic environments and biota: A review of recent studies. Marine Pollution Bulletin 133: 191–208.
Sadri, S. S., and Thompson, R. C. 2014. On the quantity and composition of floating plastic debris entering and leaving the Tamar Estuary, Southwest England. Marine Pollution Bulletin 81: 55–60.
Shabaka, S. H., Ghobashy, M., and Marey, R. S. 2019. Identification of marine microplastics in Eastern Harbor, Mediterranean Coast of Egypt, using differential scanning calorimetry. Marine Pollution Bulletin 142: 494–503.
Shruti, V. C., Jonathan, M. P., Rodriguez-Espinosa, P. F., and Rodríguez-González, F. 2019. Microplastics in freshwater sediments of Atoyac River basin, Puebla City, Mexico. Science of the Total Environment 654:
154–163.
Vermeiren, P., Muñoz, C. C., and Ikejima, K. 2016. Sources and sinks of plastic debris in estuaries: A conceptual model integrating biological, physical and chemical distribution mechanisms. Marine Pollution Bulletin 113: 7–16.
Vroom, R. J. E., Koelmans, A. A., Besseling, E., and Halsband, C. 2017. Aging of microplastics promotes their ingestion by marine zooplankton. Environmental Pollution 231: 987–996.
Wesch, C., Bredimus, K., Paulus, M., and Klein, R. 2016. Towards the suitable monitoring of ingestion of microplastics by marine biota: A review. Environmental Pollution 218: 1200–1208.
Yang, L., Qiao, F., Lei, K., Li, H., Kang, Y., Cui, S., and An, L. 2019. Microfiber release from different fabrics during washing. Environmental Pollution 249: 136–143.
Zheng, Y., Li, J., Cao, W., Liu, X., Jiang, F., Ding, J., Yin, X., and Sun, C. 2019. Distribution characteristics of microplastics in the seawater and sediment: A case study in Jiaozhou Bay, China. Science of the Total Environment 674: 27–35.
transition (i.e., the opposite of a natural succession process) was well underway, and the region had almost completely reverted to a woodland of Japanese red pine (a pioneer species) (Seto City Buried Cultural Property Center 2001). It is thought that deforestation progressed rapidly during this period, during which the Seto ceramic industry faced a sudden increase in demand. The historical background for this regression transition was the rise of the samurai class (from the end of the 12th century) and tighter regional control by them, as well as increased agricultural productivity due to the spread of double cropping, cows, and horses, which led to flourishing economic activity between cities and rural areas and the opening of regular markets. In the Edo period, the land was governed by the Owari clan. In the Owari Junkoki (Higuchi 1822), compiled during the Kansei and Bunsei period (1792–1822) (Fig. 1), it is suggested that the government practiced some form of forest conservation, leading to the establishment of a “sunadome” (erosion control) forest (today called a “sabo forest”).
Fig. 1 Description of Sabo forest (denoted by an arrow) in the Owari Junkoki.
(Taken from Higuchi 1822)
The Hoei earthquake, which dealt a major blow to the ceramic industry, hit Seto City in 1707.
In response to this event, the Owari clan provided funding for the reconstruction of the ceramic industry and grants of firewood; Instead, it was agreed that the potters who received the aid would be obliged to deliver the products to the Owari clan. These so-called “official kilns”, authorized by the Owari clan, openly engaged in a large-scale felling of pine trees for the production of fuel. As a result, a large amount of sediment accumulated in the river and caused frequent flooding in the basin. In 1782, a new system was used to plant pine and alder trees (Aichi Prefecture 1914). This represented the first conservation and flood control project conducted in the Seto District after a long deforestation history since the 12th century. Unfortunately, however, deforestation did not stop completely. People in Kyushu initiated the production of porcelain, creating an increasing demand for blue and white ware (which is esthetically pleasing against a white background), while the demand for ceramic ware from Seto contracted. Consequently, people in Seto shifted to the production of porcelain, which was in higher demand. Ceramic can be fired using hardwood and pine branches; however, since hard porcelain has a higher firing temperature than ceramic, it requires the use of other types of fuel. In Seto, high-quality trunks of Japanese red pine with high resin content were used as fuel; as a result, numerous pine trees were cut down in that period (Committee of
Compilation of Seto City 1993).
The Seto-yaki (Seto ware) system of the time had some problems. The so-called “setomono”
(Seto pottery), or “hongyo-yaki” (daily earthenware), was fired in kilns that only the eldest son of each family could inherit. This system did not allow a second or younger son to start its own business and restrained the excessive production of ceramics or the procurement of raw materials and fuel within the local area. However, the production of porcelain was conducted in shinsei-yaki (newly made wares): new kilns could be opened even by the second son of a family. Moreover, some potters switched from hongyo-yaki to shinsei-yaki. Therefore, porcelain production, which began in the Bunka period at the end of the Edo era, soon surpassed pottery production. Due to the social instability from the end of the Edo period to the Meiji restoration, no authority could regulate the deforestation and secret harvesting of trees. This resulted in a complete exhaustion of forests by the mid-1870s (Aichi Prefecture 1914).
Johannis de Rijke, a Dutch water engineer who arrived in Japan in 1873 following the request of the government, was shocked by the appearance of the Seto District when he visited the Tono region. Based on a plan proposed by de Rijke, the Meiji government invested public funds in erosion control and replanting for three years, starting in 1878. In that period, several dams and other structures were built to contrast erosion and improve sediment control (due to budget constraints, large-scale hillside planting was not carried out until 1900); moreover, some efforts have been undertaken to restore the bare landscape up to the present day (Aichi Prefecture 2005). The demand for firewood increased in this context and the ceramic industry, which had been one of the major causes of deforestation, started to have difficulties in securing fuel. This was probably related to the fact that, at the same time, the Seto blue and white porcelain has become an important export product.
Starting in 1901, there was a shift (on a trial basis) from the use of nobori (“hill climbing”) kilns (i.e., connected multi-chambered pottery kilns built on a slope that typically consume large amounts of firewood) to coal-fired kilns. By the early 20th century, coal kilns had become the most common type of kilns in Japan (Matsumura 1931).
As a result of this shift, the demand for timber started to decline and the creation of bare land temporarily stopped. By the time construction began, during the second phase of the forest management project in 1936, the recovery was remarkable. The vegetation planted in the Meiji era had grown, accompanied by new vegetation. However, at the end of the Second World War, the Seto District was once again subjected to overcutting and destruction due to fuel shortages. Further deforestation occurred after the war: the lack of food caused the clearing and cultivation of new land on the mountainside; meanwhile, the lack of fuel for households and the ceramic industry drove the cutting of more trees. In 1950, the production of ceramics in Seto City had a value of 2.143 billion yen (more than 20% of domestic production, which amounted to 9.887 billion yen). In 1952, more than half of the total production in Aichi Prefecture was directed to exports, while in 1950 it equaled to more than 80% (Committee of Compilation of Seto City 2010). Immediately after the end of the war, Seto ware enjoyed a dominant market share both in Japan and overseas.
The Annual Report of the Forestry Agency shows that the forest area in Japan has not changed over the last half century. However, timber volume has increased 2.8 times in 50 years and approximately 6 times in planted forests (MAFF Forestry Agency 2010, 2019). In other words, Japan's forests are becoming enormously rich. We have long stopped using forests as an energy resource, as was the case with Seto City, during which time the forests grew tremendously.
To what extent has the bare land around Seto City recovered following the vegetation restoration transition (i.e., the opposite of a natural succession process) was well underway, and the region had
almost completely reverted to a woodland of Japanese red pine (a pioneer species) (Seto City Buried Cultural Property Center 2001). It is thought that deforestation progressed rapidly during this period, during which the Seto ceramic industry faced a sudden increase in demand. The historical background for this regression transition was the rise of the samurai class (from the end of the 12th century) and tighter regional control by them, as well as increased agricultural productivity due to the spread of double cropping, cows, and horses, which led to flourishing economic activity between cities and rural areas and the opening of regular markets. In the Edo period, the land was governed by the Owari clan. In the Owari Junkoki (Higuchi 1822), compiled during the Kansei and Bunsei period (1792–1822) (Fig. 1), it is suggested that the government practiced some form of forest conservation, leading to the establishment of a “sunadome” (erosion control) forest (today called a “sabo forest”).
Fig. 1 Description of Sabo forest (denoted by an arrow) in the Owari Junkoki.
(Taken from Higuchi 1822)
The Hoei earthquake, which dealt a major blow to the ceramic industry, hit Seto City in 1707.
In response to this event, the Owari clan provided funding for the reconstruction of the ceramic industry and grants of firewood; Instead, it was agreed that the potters who received the aid would be obliged to deliver the products to the Owari clan. These so-called “official kilns”, authorized by the Owari clan, openly engaged in a large-scale felling of pine trees for the production of fuel. As a result, a large amount of sediment accumulated in the river and caused frequent flooding in the basin. In 1782, a new system was used to plant pine and alder trees (Aichi Prefecture 1914). This represented the first conservation and flood control project conducted in the Seto District after a long deforestation history since the 12th century. Unfortunately, however, deforestation did not stop completely. People in Kyushu initiated the production of porcelain, creating an increasing demand for blue and white ware (which is esthetically pleasing against a white background), while the demand for ceramic ware from Seto contracted. Consequently, people in Seto shifted to the production of porcelain, which was in higher demand. Ceramic can be fired using hardwood and pine branches; however, since hard porcelain has a higher firing temperature than ceramic, it requires the use of other types of fuel. In Seto, high-quality trunks of Japanese red pine with high resin content were used as fuel; as a result, numerous pine trees were cut down in that period (Committee of
work proposed by de Rijke? Furthermore, how has the bare land coexisted alongside functioning forests up to the present day? This study considers the land function characteristics of the bare lands of Seto City through an analysis of the current state and the historical recovery of forests.
2. Research Methods
The Shirasaka District, located at the east of Seto City, is situated on hills formed by the intrusion of granite at the base of Mt. Sanage (elevation 629 m). This district features exposed granite that has undergone deep weathering, leading to the formation coarse-grained sand with the texture of corn flour. This sand consists of fine gravel, coarse sand, and other sediments. The coarse sand tends to resist consolidation, leading to severe erosion in the presence of running water. Soil types include a range of brown forest soils on a granite substrate. In this study, we conducted a series of vegetation and soil profile surveys, as well as soil analyses, to estimate the soil carbon storage. The study was based on the information sampled at 11 sites in 2002 within the research forests of the Ecohydrology Research Institute (ERI), the University of Tokyo (Shirasaka District; Fig. 2b), whose historical evolution (e.g., land use and forest conditions) is well understood. The ERI research forests were originally established by the University of Tokyo under the name of “University Experimental Forest in Aichi”.
Fig. 2 Location of Seto City (a) and the vegetation-soil survey sites in Shirasaka District (b).
Old forest sites A–D, Young forest sites E–I, Strong deforested sites J, K. Rectangular area denotes the area shown in Fig. 5.
The survey sites were selected based on comparative aerial photography, so to determine the carbon accumulation linked to changes in vegetation over time at the same point. An aerial photograph taken in 1977 (the oldest available) was compared to a color aerial photograph of the same area taken 20 years later in 1998. The comparative survey site (i.e., “Forest Area”) was selected since it was covered with vegetation in 1977, 1998, and 2002; the comparative survey site labeled
“Recovery Area” was selected since it was bare in 1977, but vegetated by 1998; finally, the comparative survey site labeled “Bare Area” was selected since it was bare from 1977 to 1998 and has remained bare to this day.
Soil samples were collected at the following depths: 0–5 cm, 5–10 cm, 10–20 cm, 20–30 cm, and 30–50 cm. Meanwhile, at the sites selected by comparative aerial photography, other soil samples were collected at the following depths: 0–4 cm, 10–14 cm, 25–29 cm, 40–44 cm, and 60– 64 cm. In both cases, 400-cc soil cylinders were used for sampling and the litter on the surface was removed at the time of collection. The samples were then air-dried and separated into roots, gravel, and fine soil using a 2 mm sieve. After raw humus was removed from the soil, the samples were thoroughly air-dried and ground in an agate mortar with a pestle. Two dispensing spoons of fine soil per sample were hence passed through a 100-mesh sieve and analyzed. These fine soil samples were weighed and wrapped in Sn foil; then, their carbon content (Cg g-1) was measured by dry combustion, using a CNS element analyzer (NA1500, Carlo-Elba). The amount of soil carbon per unit area, needed to estimate the amount of carbon accumulation in the soil, was determined as follows:
C = W × R × 10000 (1)
where C is the carbon content of the soil over an area of 1 ha and up to a depth of 1 m (t C ha-1 m-1), W the soil dry weight (g cm-3), and R the carbon content (g C g-1).
3. Results and Discussion
3.1 Types of forest cover at the survey sites
Site A corresponds to a coniferous artificial forest of cypress planted about 75 years ago in the research forests of Shirasaka District and used as a control zone for testing afforestation density.
Sites B and C are the upper and lower slopes, respectively, of a sample forest of evergreen oak which has been left unmanaged since the establishment of the research forests. Site D corresponds to the basin of a flow-measuring weir in Shirasaka District. After the establishment of this weir, the site transformed into a broadleaved woodland composed mainly of konara oak (Quercus serrata) and longstalk holly (Ilex pedunculosa). In Shirasaka area, A, B, C and D points belong to old forest site.
Site E corresponds to a broadleaved woodland of Japanese red pine (Pinus densiflora) at the bottom of a bare ridge. Sites F and G are represented by broadleaved woodlands composed mainly of konara oak, expanding near the ruins of a Seto pottery kiln. Site H is represented by a broadleaved woodland.
Its vegetation is composed mainly of Japanese alder (Alnus japonica) and began to grow about 30–
40 years ago. Sites I correspond to sparse woods composed mainly of Japanese clethra (Clethra barbinervis) and black pine (Pinus thunbergii), which were planted approximately 30 years ago to support erosion control. Sites E to I were classified as young forest site. SiteJ is a sparse forest that has been invaded by vegetation for about 30 years. The point K is a bare land(tokusyachi). These two correspond to strong deforested site.
Historical photos of the Recovery Area show a decrease in the bare land areas from 1977 to 1998: by 1987 vegetation had established and soon after, by 1989, the whole area was completely covered with vegetation (Fig. 3).
The Forest Area currently corresponds to a broadleaved forest of ring-cupped oak (Quercus glauca), snake-bark maple (Acer rufinerve), Japanese cleyera (Cleyera japonica), and camellia (Camellia japonica), among others. The Recovery Area, instead, currently corresponds to a forest of scattered red pines mixed with a broadleaved forest of Japanese andromeda (Pieris japonica), spicebush (Lindera umbellata), and camellia (Camellia japonica), among other species. Aerial work proposed by de Rijke? Furthermore, how has the bare land coexisted alongside functioning
forests up to the present day? This study considers the land function characteristics of the bare lands of Seto City through an analysis of the current state and the historical recovery of forests.
2. Research Methods
The Shirasaka District, located at the east of Seto City, is situated on hills formed by the intrusion of granite at the base of Mt. Sanage (elevation 629 m). This district features exposed granite that has undergone deep weathering, leading to the formation coarse-grained sand with the texture of corn flour. This sand consists of fine gravel, coarse sand, and other sediments. The coarse sand tends to resist consolidation, leading to severe erosion in the presence of running water. Soil types include a range of brown forest soils on a granite substrate. In this study, we conducted a series of vegetation and soil profile surveys, as well as soil analyses, to estimate the soil carbon storage. The study was based on the information sampled at 11 sites in 2002 within the research forests of the Ecohydrology Research Institute (ERI), the University of Tokyo (Shirasaka District; Fig. 2b), whose historical evolution (e.g., land use and forest conditions) is well understood. The ERI research forests were originally established by the University of Tokyo under the name of “University Experimental Forest in Aichi”.
Fig. 2 Location of Seto City (a) and the vegetation-soil survey sites in Shirasaka District (b).
Old forest sites A–D, Young forest sites E–I, Strong deforested sites J, K. Rectangular area denotes the area shown in Fig. 5.
The survey sites were selected based on comparative aerial photography, so to determine the carbon accumulation linked to changes in vegetation over time at the same point. An aerial photograph taken in 1977 (the oldest available) was compared to a color aerial photograph of the same area taken 20 years later in 1998. The comparative survey site (i.e., “Forest Area”) was selected since it was covered with vegetation in 1977, 1998, and 2002; the comparative survey site labeled
“Recovery Area” was selected since it was bare in 1977, but vegetated by 1998; finally, the comparative survey site labeled “Bare Area” was selected since it was bare from 1977 to 1998 and has remained bare to this day.
photographs of the bare land appear as no vegetation, but young trees such as Japanese red pine (Pinus densiflora), Japanese andromeda (Pieris japonica), and longstalk holly (Ilex pedunculosa) were sometimes found on site.
Fig. 3 Condition of afforestation from aerial photos in 1977 and 1998.
○: Forest area, △: Recovery area, □: Bare area. The location of the study area is shown in Fig. 2.
3.2 Carbon accumulation in the soil
The soil carbon content in the surface layer (0–4 cm depth) of the Shirasaka District was measured in samples collected from both bare land and restored vegetation areas. The samples from the bare lands presented a maximum carbon content of 0.27%, while those from the regions where revegetation had continued for at least 76 years presented contents of 4.9%–8.5%. The carbon content of soil previously collected from the islands of Ehime Prefecture (Nakashima 1969) was lower than 1% in districts where the afforestation rehabilitation work was done less than 4 years before, but close to 10% in districts where such work was done 15 years before. These islands are similar to the Seto District for having a granite basement; moreover, in both cases the vegetation was restored on bare land, although the soil carbon accumulation in the Seto District was somewhat lower than on those islands.
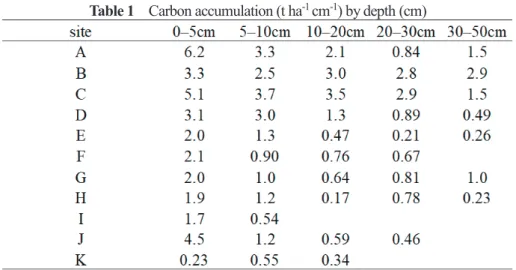
Table 1 shows the carbon accumulation (g ha-1 cm-1) in the soil profile at each site in the Shirasaka District. At each site, the amount of carbon accumulation was higher in the top layer and decreased with depth. Exceptions were found in the lower horizon (40 cm) of sites A and H (which corresponds to a young forest). Since Site H is located close to a tree nursery, its soil may have been mixed with topsoil brought from another place when the nursery was created; in any case, the current vegetation became well established after the creation of the nursery. At Site B, the A horizon was found to extend down to a depth of 44 cm, with no noticeable vertical decreases in carbon
accumulation. At Site C, located in the same sample forest of evergreen oak of Site B, we noticed a noticeable decrease in carbon accumulation with depth: the surface layer reflected a higher carbon accumulation. Since Site C is at the bottom of the slope, its different carbon accumulation compared with other sites is likely due to the downward movement and deposition of organic soil layers along slope. Site D, which corresponds to a relatively old forest located on a gentle slope, exhibited lower carbon accumulation values than other sections.
Table 1 Carbon accumulation (t ha-1 cm-1) by depth (cm)
Perhaps, since Site D is the basin of a stream with a water weir, the accumulation of carbon may have been affected by the runoff of topsoil when the water rises. Site E (a vegetated area at the bottom of a bare ridge) exhibited a clearer growth of the A-horizon than Site K (bare land); however, Site E showed a marked decrease in the amount of accumulation from the surface layer to the lower layer, and the overall carbon accumulation across all layers was relatively small. Sites F and G corresponding to relatively new forest areas, exhibited almost identical carbon accumulation values in the surface layers. The lowest layer of Site G showed a slightly higher carbon accumulation than the upper layers, perhaps due to its location at the bottom of a slope and the infiltration of humus into the sandy substrate (caused by the deep weathering of granite).
Site I underwent afforestation for the purpose of erosion control; in this area the vegetation established slowly, perhaps because the local terrain is naturally vulnerable to collapse and soil erosion. Similar disturbances may explain the low amount of carbon accumulation after a long time from the afforestation. Site K exhibited a higher carbon accumulation value for the lower layers, rather than for the top layer, perhaps because it is represented by bare land containing roots but no litter. Site J, which has the same soil characteristics of Site K but also some vegetation cover, exhibited a high carbon accumulation value in the top layer, probably due to the residue fraction of litter. In fact, the sandy soil layer (similar to that of Site K) provided good drainage, keeping the organic matter dry and preventing its decomposition. The plot of Fig. 4 shows the carbon accumulation rate in soil against the elapsed time since tree planting, excluding Site J.
3.3 Changes in carbon accumulation
In the Shirasaka District, the tree species compositions were different even when the forest covers presented similar degrees of development. Overall, the amount of carbon accumulation photographs of the bare land appear as no vegetation, but young trees such as Japanese red pine
(Pinus densiflora), Japanese andromeda (Pieris japonica), and longstalk holly (Ilex pedunculosa) were sometimes found on site.
Fig. 3 Condition of afforestation from aerial photos in 1977 and 1998.
○: Forest area, △: Recovery area, □: Bare area. The location of the study area is shown in Fig. 2.
3.2 Carbon accumulation in the soil
The soil carbon content in the surface layer (0–4 cm depth) of the Shirasaka District was measured in samples collected from both bare land and restored vegetation areas. The samples from the bare lands presented a maximum carbon content of 0.27%, while those from the regions where revegetation had continued for at least 76 years presented contents of 4.9%–8.5%. The carbon content of soil previously collected from the islands of Ehime Prefecture (Nakashima 1969) was lower than 1% in districts where the afforestation rehabilitation work was done less than 4 years before, but close to 10% in districts where such work was done 15 years before. These islands are similar to the Seto District for having a granite basement; moreover, in both cases the vegetation was restored on bare land, although the soil carbon accumulation in the Seto District was somewhat lower than on those islands.
Table 1 shows the carbon accumulation (g ha-1 cm-1) in the soil profile at each site in the Shirasaka District. At each site, the amount of carbon accumulation was higher in the top layer and decreased with depth. Exceptions were found in the lower horizon (40 cm) of sites A and H (which corresponds to a young forest). Since Site H is located close to a tree nursery, its soil may have been mixed with topsoil brought from another place when the nursery was created; in any case, the current vegetation became well established after the creation of the nursery. At Site B, the A horizon was found to extend down to a depth of 44 cm, with no noticeable vertical decreases in carbon
seems to be the largest in the oldest forest stands, smaller in the newer stands, and minimum in the poorest stands, regardless of the tree species composition. Table 2 shows the carbon accumulation in the soil horizon between 0–30 cm depth and the estimated annual carbon accumulation at each survey site.
Fig. 4 Shift of carbon accumulation rate(t ha-1 y-1)by forest age Table 2 Annual carbon accumulation up to 30 cm depth
For sites A to D, the carbon accumulation period (time) was set according to the age of the forest stand based on its history in the research forest. For Site A, the carbon accumulation period was set
Site Age Carbon accumulation (t ha-1) Annual carbon accumulation (t ha-1 y-1)
A 75 77.2 1.0
B 80 87.8 1.1
C 80 108 1.4
D 70 52.5 0.75
E 40 23.1 0.58
F 40 29.3 0.73
G 40 29.9 0.75
H 40 25.0 0.63
I 30 11.2 0.37
to 75 years because according to the Aichi Exercise Forest Forestry Work Diagram, cypress was planted there in 1927. The carbon accumulation periods of sites B and C were set to 80 years, since they represented sample forests of evergreen oak that have been left unmanaged since the establishment of the research forests. The carbon accumulation periods of Site D was set instead to 70 years, since this area has been left unmanaged since the establishment of the flow-measuring weir. For these old forest sites, the forest age was set short, even though some vegetation may have existed beforehand. Meanwhile, it can be safely assumed that no large carbon accumulations occurred before than the identified time periods; in fact, the restoration of the bare areas did not reach full speed until 1922, after the establishment of the research forests. The annual carbon accumulations estimated considering initial soil accumulation conditions equal to those of the bare areas are the following: 35.3 t ha-1 in the Forest Area, 21.6 t ha-1 in the Recovery Area, and 18.4 t ha- 1 in the Bare Area.
The annual accumulations obtained in this study are twice as high as those calculated for old forest stands (sites A–D) and almost equal to those calculated for 30–40 years old stands (sites E–I) by Sakai et al. (2003). However, the annual carbon accumulation values obtained in this study for 20-year-old forest stands (selected from aerial photographs) were significantly greater. As mentioned earlier, the Recovery Area was covered with vegetation in 1988. Assuming that the recovery took about 20 years starting from a bare state, and based on the difference with the carbon accumulation in the current bare land (site K), the annual carbon accumulation was estimated to be of 0.16 t ha-1 y-1. This value is slightly lower compared to those in Table 1, supporting the assumption that the amount of carbon accumulation increased after the forest was grown to a certain extent; in other words, the amount of accumulation should have been small while the forest was young. In the case studied by Sakai et al. (2003), the organic matter decomposition may have occurred more quickly and easily than in the present study because the trees were planted in the sandy loam of the nursery. Overall, this variety of results illustrates the difficulty of reproducing actual forest soil phenomena in experiments using nursery soil.
4. Concluding Remarks
By 2005, about 130 years after the observations of de Rijke regarding the extent of forest devastation in the Seto District, the entire region had recovered to such a degree that nature conservation organizations opposed the Aichi Prefecture in hosting the 2005 World Exposition in the name of protecting existing forest resources. Forest vegetation is supported by soil. In fact, the results of soil analysis have shown that bare land in the Seto area can be restored after more than 100 years of forest conservation work.: with proper care, it is possible to restore the productive function of lands that had become bare and non-productive; however, humans should support this processin a way appropriate for the situation. It is unlikely to obtain similar results by leaving the land as it is.
Since the 11th century, the forest of the Seto District, which was being steadily devastated, had been a commons for local residents (see Fig. 1 in Higuchi 1822). As Chiba (1954a, 1954b, 1954c, 1954d) pointed out, such tragedy of the commons was a nationwide phenomenon, not limited to the Seto District. The economy of Okayama, located next to the Seto Inland Sea, was based on the salt- making industry, which caused another tragedy of the commons (Chiba 1954a, 1954b, 1954c, 1954d). Meanwhile, the Seto District, which represented the place of origin of good quality clay, spent huge amounts of effort and money to recover from the human-induced devastation and seems to be the largest in the oldest forest stands, smaller in the newer stands, and minimum in the
poorest stands, regardless of the tree species composition. Table 2 shows the carbon accumulation in the soil horizon between 0–30 cm depth and the estimated annual carbon accumulation at each survey site.
Fig. 4 Shift of carbon accumulation rate(t ha-1 y-1)by forest age Table 2 Annual carbon accumulation up to 30 cm depth
For sites A to D, the carbon accumulation period (time) was set according to the age of the forest stand based on its history in the research forest. For Site A, the carbon accumulation period was set
Site Age Carbon accumulation (t ha-1) Annual carbon accumulation (t ha-1 y-1)
A 75 77.2 1.0
B 80 87.8 1.1
C 80 108 1.4
D 70 52.5 0.75
E 40 23.1 0.58
F 40 29.3 0.73
G 40 29.9 0.75
H 40 25.0 0.63
I 30 11.2 0.37
managed to preserve its ceramic industry to this day. The inability to use firewood as fuel hindered the use of clay; therefore, the depletion of firewood should have put the Seto District's ceramic industry at risk.
The restoration of bare areas depends heavily on the character of the local community, as discussed by Chiba (1954a, 1954b, 1954c, 1954d). Although Seto was a “developed region” with a very advanced economy, the local people tackled the commons’ destruction with a serious sense of crisis. As a matter of fact, they left no margin for individual interests. In other areas, such as Okayama, the forest was considered only as a source of private fuel, whereas in the Seto District, similar territories were used to generate local benefits beyond private gain. In other words, the extinction of the Seto forest would have caused the destruction of the district’s function.
Today, the Seto forest lost its function as the energy source as a result of the fuel revolution. In other words, the maintenance of the function of the Seto area was not dependent on the condition of the forest. Moreover, these forests are not exploited anymore to support the ceramic industry, but serve as environmental resources, independent from the economic resources of the Seto District (like other forests throughout Japan). For example, The Science Council of Japan (2001) evaluated the multifaceted functions of agriculture and forests in relation to the global environment and human life, estimating a total value of 670 billion yen as economic resources, and of 70 trillion yen as environmental resources.
As we mentioned at the beginning, due to the abandon of using forests, the domestic forests have become flooded with environmental resources and their functions were restored. Not only the Seto forest that has recovered from the devastation, but also the Japanese forest is coming at a time when it should fulfill its function. Nevertheless, many people are still reluctant to cut down forests.
It is also a well-known fact that forests, of course, have many problems, such as forestry management problems that cannot be avoided in order to utilize their functions.
If we cannot bridge the gap between these preconceived notions and the current reality, it will be very difficult to establish a basis for discussions on the practical use of forests. That would be very unfortunate, both for the forests regenerated from bare land and for those who use them.
References
Aichi Prefecture ed. 1914. Aichikenshi 1,2 (History of Aichi Prefecture, Volume I and II), Aichi: Seto City.*
Aichi Prefecture. 2004. Hageyama hukkyu no 1seki, Hoffman koji to Hagigoten (A Century of Rehabilitation for the Bare Hills_Hoffman’s Work and the Hagi Goten), Aichi:Aichi Prefectural Agriculture, Forestry and Fisheries Department Forest Conservation Section.*
Chiba T. 1954a. The bare hills surrounding the Okayama District (1). Geographical Review of Japan 27: 48–58.**
Chiba T. 1954b. The bare hills of the Okayama District (2). Geographical Review of Japan 27: 158–
166.**
Chiba T. 1954c. The bare hills of the Okayama District (3). Geographical Review of Japan 27: 255–
262.**
Chiba T. 1954d. The bare hills of the Okayama District (4), Geographical Review of Japan 27: 374–
384.**
Committee of Compilation of Seto City. 1986. Setoshishi Shiryohen 2 Shizen (History of Seto City.
Reference 2, Nature), Aichi: Seto City.*
Committee of Compilation of Seto City. 1993. Setoshishi Tojishihen 5 (History of Seto City. Ceramic history 5), Aichi: Seto City.*
Committee of Compilation of Seto City. 2010. Setoshishi Tsushihen Ge (History of Seto City. Volume of General history 2), Aichi: Seto City.*
Higuchi Y. 1822. Owari Junkoki (Local topography of Owari district). https://websv.aichi-pref- library.jp/wahon/detail/30.html (Dec. 19, 2019).*
MAFF Forestry Agency. 2010. Annual Report of Forestry Agency. Tokyo: National Forestry Improvement Promotion Association.*
MAFF Forestry Agency. 2019. Annual Report of Forestry Agency. Tokyo: National Forestry Improvement Promotion Association.*
MAFF. Afforestration projects in the Meiji era. http://www.rinya.maff.go.jp/j/kouhou/archives/
tisan/tisan.html (Nov. 30, 2019).*
Matsumura H. 1931. Tojikisekitangama ni tsuite (On coal kiln for pottery and porcelain). Journal of Japan Society of Ceramic Industry 39: 690-692.*
Nakashima T. and Fushimi T. 1969. On the Forest Soil after Afforestation by the Rehabilitation Works for the Bare Land in the Setouchi Region (I), Journal of the Japanese Forestry Society 51: 175–182.**
Sakai H., Inagaki M, Takahashi M, Noguchi K. and Tanaka T. 2003. Changes in carbon and nitrogen accumulation in the soil after afforestation on nursery soils. Japanese Journal of Forest Environment 45: 93–98.**
Science Council of Japan. 2001. Chikyukankyo, ningensekatsu ni kakawaru nogyo oyobi shinrin no tamenteki na kinou no hyoka ni tsuite (Toshin) (A reply on evaluation of multi-functions of agriculture and forest related to the global environment and human life).
http://www.scj.go.jp/ja/info/kohyo/division-5.html (Dec. 19, 2019).*
Seto City Buried Cultural Property Center. 2001. Hirokute 18, 20, 30, go kamaato: Hakurankai entoransu eria seibi ni kakaru maizobunkazai hakkutsuchosa (Hirokute 18/20/30 Kiln Site:
Excavation Survey of Buried Cultural Properties for Expo Entrance Area Development). Aichi:
Seto City Buried Cultural Property Center.*
(*: in Japanese, **: in Japanese with English abstract) managed to preserve its ceramic industry to this day. The inability to use firewood as fuel hindered
the use of clay; therefore, the depletion of firewood should have put the Seto District's ceramic industry at risk.
The restoration of bare areas depends heavily on the character of the local community, as discussed by Chiba (1954a, 1954b, 1954c, 1954d). Although Seto was a “developed region” with a very advanced economy, the local people tackled the commons’ destruction with a serious sense of crisis. As a matter of fact, they left no margin for individual interests. In other areas, such as Okayama, the forest was considered only as a source of private fuel, whereas in the Seto District, similar territories were used to generate local benefits beyond private gain. In other words, the extinction of the Seto forest would have caused the destruction of the district’s function.
Today, the Seto forest lost its function as the energy source as a result of the fuel revolution. In other words, the maintenance of the function of the Seto area was not dependent on the condition of the forest. Moreover, these forests are not exploited anymore to support the ceramic industry, but serve as environmental resources, independent from the economic resources of the Seto District (like other forests throughout Japan). For example, The Science Council of Japan (2001) evaluated the multifaceted functions of agriculture and forests in relation to the global environment and human life, estimating a total value of 670 billion yen as economic resources, and of 70 trillion yen as environmental resources.
As we mentioned at the beginning, due to the abandon of using forests, the domestic forests have become flooded with environmental resources and their functions were restored. Not only the Seto forest that has recovered from the devastation, but also the Japanese forest is coming at a time when it should fulfill its function. Nevertheless, many people are still reluctant to cut down forests.
It is also a well-known fact that forests, of course, have many problems, such as forestry management problems that cannot be avoided in order to utilize their functions.
If we cannot bridge the gap between these preconceived notions and the current reality, it will be very difficult to establish a basis for discussions on the practical use of forests. That would be very unfortunate, both for the forests regenerated from bare land and for those who use them.
References
Aichi Prefecture ed. 1914. Aichikenshi 1,2 (History of Aichi Prefecture, Volume I and II), Aichi: Seto City.*
Aichi Prefecture. 2004. Hageyama hukkyu no 1seki, Hoffman koji to Hagigoten (A Century of Rehabilitation for the Bare Hills_Hoffman’s Work and the Hagi Goten), Aichi:Aichi Prefectural Agriculture, Forestry and Fisheries Department Forest Conservation Section.*
Chiba T. 1954a. The bare hills surrounding the Okayama District (1). Geographical Review of Japan 27: 48–58.**
Chiba T. 1954b. The bare hills of the Okayama District (2). Geographical Review of Japan 27: 158–
166.**
Chiba T. 1954c. The bare hills of the Okayama District (3). Geographical Review of Japan 27: 255–
262.**
Chiba T. 1954d. The bare hills of the Okayama District (4), Geographical Review of Japan 27: 374–
384.**
Committee of Compilation of Seto City. 1986. Setoshishi Shiryohen 2 Shizen (History of Seto City.
Reference 2, Nature), Aichi: Seto City.*