UNDERSTANDING THE INFLUENCE OF DRIVING SATISFACTION ON TOURISM ACTIVITIES AND OVERALL SATISFACTION: THE CASE OF DESARU JOHOR MALAYSIA
A DOCTORAL DISSERTATION SUBMITTED TO
THE GRADUATE SCHOOL OF URBAN ENVIRONMENTAL SCIENCES
IN PARTIAL FULFILLMENT OF THE REQUIREMENT FOR THE DEGREE OF DOCTOR OF TOURISM SCIENCE
DEPARTMENT OF TOURISM SCIENCE
BY
SAFIZAHANIN BINTI MOKHTAR
SEPTEMBER, 2016
ACKNOWLEDGEMENT
Without the blessing and grace of Allah S.W.T nothing that we attempt will ever be realized. With sincere appreciation I would like to share my gratefulness to all individuals and group of people that have been very helpful since the beginning of my study.
Firstly, I would like to express deepest gratitude to my supervisor, Professor Tetsuo Shimizu for the valuable guidance and advice with significant ideas and suggestions until the end of this study. Without his guidance, much of the important information in this research would be rumpled. I am also very grateful to my dissertation reading committee Assoc. Prof. Taketo Naoi, Prof. Susumu Kawahara and Assoc. Prof. Yu Okamura for their useful comments and advices on my research and my future research and teaching works.
I gratefully acknowledge Tokyo Metropolitan Government and Tokyo Metropolitan University for providing me the Asian Human Resources Fund (AHRF) scholarship throughout the duration of my doctoral studies.
To the respondents, enumerators, and government officials, thank you for your kind assistance and cooperation. My sincere appreciation also extends to my culture and nature based tourism colleagues, and others who have provided assistance at various occasions. The sweet friendship, view and tips indeed are valuable.
Lastly, to my beloved family members and my husband, thank you very much for
your understanding, kindness and support. I would like to wish everyone happy
always.
ABSTRACT
Motivation and objectives of the research
Transport is one of the essential elements of tourism that takes tourist to the destination and providing methods of moving around within the destination area.
Destination and overall tourist satisfaction has been a topic of significant researches in tourism field. A lot of previous studies examining the relationship between destination characteristics and then further investigated the connection of destination satisfaction to the destination revisit intention, destination loyalty, and other tourism metrics. On the other side, previous studies in scenic tourism shows that many researches have more interest in understanding the profile of the tourists and their travel motivation. However, these studies targeted only motor touring tourists and assessed tourist satisfaction to the specific scenic routes and facilities. Previous studies understand tourist overall satisfaction, however, these studies neglected to understand the influenced of driving for self-drive tourists especially the drivers that drive to the destination to the tourism activities and overall satisfaction.
It was frequently observed that private car share in the destination among
domestic traveler in Malaysia is almost eighty percent during weekends and
holidays. Severe congestion in the access and egress part to major tourism
destinations will lead to delay in arrivals. Such bad driving experiences predicted to
have an effects to the tourist activities or overall satisfaction. Therefore, the
objectives of this study are, 1) to identify the important driving satisfaction factors in
highway, en route to/from the destination and within the destination road segments,
2) to examine the effects of driving satisfaction to the tourism activities and overall
satisfaction and to understand the driver behaviors and satisfaction toward the
proposed model and 3) to propose a policy or strategies for roadway facilities and
service improvement in Malaysia.
Research methodology
Two questionnaire surveys were conducted among Malaysian self-driving tourists. The first survey was conducted through online survey to the various government and private institutions, aiming to find the factors that are important for driving satisfaction to be included in the second survey. The survey was conducted in January 2015 and one hundred and three participants answered the survey sheet. The questionnaire outlined multi-component driving satisfaction such as speed, driving comfort, road safety infrastructure, low travel cost and beautiful natural surroundings. Chi square analysis was used to analyze 23 factors related to driving satisfaction among the three types of road segment: ‘on the highway’, ‘en route to/from the destination’ and ‘within the destination’. Then Mann-Whitney test conducted to understand the differences among the group of demographic profiles, car ownership and driving experiences, attitudes toward car and driving preferences.
The present finding outlines seven important driving satisfaction factors in
highway and eight factors in the destination road segment to be further examined in
second survey. The result revealed that these factors: - less traffic volume, less
number of stop at intersection and driving at preferred speed (speed factor),
experiencing beautiful natural and townscape along the route (beautiful natural and
surrounding factor), quality of road surface and a good road design for safety (road
safety infrastructure factor), a well-developed route network and good technical
support during unforeseen situation and good traveler information services (driving
comfort factor), availability of parking space and comfortable rest area and related
services along the routes (roadside facilities factor) are most striking driving factors
to be observed for Desaru self-drive tourists.
Case study
The second survey conducted at Desaru beach area, Johor, Malaysia from July to August 2015. The aim of this survey is to evaluate the relationship between driving satisfaction and tourism activities and overall tourist satisfaction in Desaru, one of tourism destination in Malaysia. Convenient sampling was used to select four hundreds qualified self-drive to answer the questionnaire survey. The target respondents mainly for the self-drive tourists that driving a car in the majority of road segments and also performed tourism activities. The questionnaire design in this survey was divided into four sections, the respondents’ attitudes toward car and driving preferences, the driving satisfaction on highway and within the destination, the tourism activities satisfaction and the demographic background. A Structural Equation Model (SEM) was used to analyze the study hypotheses/ the relationship between driving satisfaction (on highways and within the destination road segment), tourism activities satisfaction, and overall satisfaction. This main target in this model is to examine the direct or indirect relationship of driving satisfaction to tourism activities and overall satisfaction.
Findings
The hypothesized model was assessed with the structural equation model,
and exhibited a good fit; based on the chi-squared statistics = 266.602, with 119
degrees of freedom, it displayed a statistically significant level of 0.00.and had
RMSEA= 0.60, AGFI= .880, GFI= 0.92, PNFI= 0.69, CFI= 0.93, TLI= 0.91, and
NFI= 0.88. The standardize coefficients were used to determine the relationship
existed among the construct and all the hypotheses. It was found that the overall
driving satisfaction in highway and the destination road segments does not
significantly influence overall tourist satisfaction in Desaru. The finding reflected
consistent result from previous studies which indicated that for the short distance
trip, traveler usually have neutral to positive driving behaviors. In addition,
interesting result demonstrated that the highway overall satisfaction has significant influence to the tourism activities satisfaction. Rating on a good road design for safety have the greatest influenced for Senai Desaru Expressway overall satisfaction (ᵦ = 0.88). Moreover, the aspect of quality of road surface (ᵦ =0.80) and a good technical support during unforeseen situation (ᵦ =0.79) are both significant and positively related to driving satisfaction. It can be concluded that the greater the safety infrastructure on highway lead to the greater significant for highway overall satisfaction (HOS) in the case of Senai Desaru Expressway. However, in contrast the overall driving satisfaction (DOS) within the destination is not significantly effect to the tourism activities. However, the driving factors (driving at preferred speed (ᵦ
=0.73), a good technical support during unforeseen situation (ᵦ =0.62), and well developed road network (ᵦ =0.65) in this road segment shows significant positive relationship to the overall in the destination driving satisfaction. This indicated that self-drive tourists are demanded to experience good road infrastructure within the destination which expected to enhance the driving speed. Total effects of HOS (ᵦ = 167) go on tourism activities is statistically significant at (P = 0.008) but the total effect to overall satisfaction (ᵦ = -0.34) was not statistical significant (P = 0.40).
The differences in SEM-path model satisfaction was then examined to a given set of driver behaviors (attitudes towards cars and driving preferences).
Overall, it was found that drivers are significantly different in satisfaction at each
path model. A good road safety design (path H4) was critical driving satisfaction
factor for tourism trips on highway for all drivers. Risky group of driver have larger
driving satisfaction factors in order to achieve the driving satisfaction as well as
tourism activities and overall satisfaction. Moreover, drivers that has less important
attitude on car means independence and bad for environment have positive effect
between driving on highway and satisfaction with tourism activities. Only drivers
that feel green energy is important in their driving has negative effect between
highway driving satisfaction and tourism activities. Drivers that have important
feeling on driving is bad for environment, and adventurous seeking have negative
effect between driving on destination and satisfaction to the tourism activities. Those drivers feel important in listening music while driving have positive effect between driving on destination and satisfaction to the tourism activities.
Suggestions for policy improvements
This study found that the existing transport tourism related policies indicated that the national government highly focus on the congestion or speed related management. Therefore, based on findings this study suggested that the national government should also highlighted the road safety infrastructure management in some conditions in order to improve the domestic tourism. Moreover, the differences in drivers background profiles, attitudes toward car and driving preferences also important input in further develop transport tourism related policies.
This study makes noteworthy contribution in enhancing our understanding of the driving satisfaction factors that important to increase that increase drivers driving satisfaction for the tourism trips. Speed, beautiful natural and surrounding, road safety infrastructure, driving comfort, and roadside facilities factors was emerged from the first survey as an important factor to be further investigated. This study understand that overall driving satisfaction on highway have significant effects to the tourism activities satisfaction compare to the overall tourist satisfaction.
Generally, safety aspect of good road safety design (path H4) was critical factor for tourism trips especially on highway road segments to all drivers’ behaviours.
Moreover, this study found that risky group of driver have larger driving satisfaction
factors in order to achieve satisfaction. Current focus on existing transport tourism
related policies highly targeted to reduce the congestion or speed related
management. Therefore, consistent with study findings, it should be more proposal
on the road safety infrastructure management in some destination in order to improve
the tourism activities and overall tourist satisfaction by the Malaysia national
government.
The results presented in this study may facilitate the improvements in the transportation and tourism planning. In the future, further investigations into different tourism destinations and travel distances are needed to enhance on understanding of overall driving satisfaction to tourism activities and overall satisfaction.
Keywords: driving satisfaction, self-drive tourist, tourism activities satisfaction
and overall satisfaction
TABLE OF CONTENTS PAGE
ACKNOWLEDGEMENT ii
ABSTRACT iii
TABLE OF CONTENTS ix
LIST OF TABLES xii
LIST OF FIGURES xiii
LIST OF ABBREVIATIONS xiv
LIST OF SYMBOLS xiv
LIST OF APPENDICES xv
1 INTRODUCTION TO RESEARCH
1.1 Background of study 1
1.2 Problem statement 4
1.3 Research objectives 6
1.4 Research questions 7
1.5 Thesis organization 7
2 DRIVING AND TOURISM ACTIVITIES SATISFACTION 2.1 Tourism activities satisfaction 9
2.2 Tourism and travel mode 10
2.3 Self-drive and driving satisfaction 11
2.4 Hypotheses 13
3 IDENTIFICATION OF IMPORTANT FACTORS
3.1 General framework 16
3.2 Group of factors 17
3.3 Sampling method and questionnaire structure 18
3.3.1 Data analysis 18
3.4 Background of respondent 19
3.4.1 Sample profiles 20
3.4.2 Drivers attitudes toward car 21
3.5 Driving satisfaction factors on highway, en route to
and from the destination and within the destination 23
a. Demographic characteristics 23 b. Car ownership and driving experiences 24
c. Attitudes toward car 24
d. Driving preferences 25
3.6 Summary 30
4 SECOND SURVEY AND EXPLORATORY RESULTS
4.1 Study framework 35
4.2 Study area 39
4.3 Questionnaire design 43
4.4 Sampling design 45
4.5 Data management and analysis 46
4.6 Background of respondents 47
4.7 Trip characteristics 50
4.8 Scenario basis situation 53
4.9 Summary 58
5 THE EFFECTS OF DRIVING SATISFACTION, TOURISM ACTIVITIES AND OVERALL SATISFACTION
5.1 Introduction to SEM Model 59
5.2 SEM model fits 64
5.2.1 Measurements models and hypotheses
relationship 65
5.2.2 Hypotheses results 66
5.3 SEM path model and drivers behaviors 69 5.4 The effects of driving satisfaction on the tourism activities and overall satisfaction
5.4.1 Attitudes toward car 74
5.4.2 Driving preferences 79
5.5 Conclusion 84
6 CONCLUSION AND RECOMMENDATIONS
6.1 Conclusion 86
6.1.1 Objective 1 86
6.1.2 Objective 2 87
6.1.3 Objective 3 89
6.1.4 Objective 4 90
6.2. Study limitations and future research 94
REFERENCES 97-100
Appendices A - F 102-167
LIST OF TABLES
TABLE NO TITLE PAGE
3.1 Category of driving satisfaction factors 17
3.2 Sample profiles 20
3.3 Summary of Mann-whitney analysis on highway 26 3.4 Summary of on enroute to/from the destination 27 3.5 Summary Mann-whitney analysis within the destination 28 3.6 Important factors for highway road segment 33
3.7 Important factors for destination segment 33
4.1 Respondent profiles 48
5.1 Highway: KMO 60
5.2 Highway: Component matrix 60
5.3 Destination: KMO 61
5.4 Destination: Component matrix 62
5.5 Standardized factor loadings of measurement model 65
5.6 Results of hypotheses test 68
5.7 Summary of z-statistics test on the -ATC 71-72
5.8 Summary of z-statistics test on the –ATC 73
5.9 Summary of total effects –ATC 76
5.10 Summary of direct effects –ATC 77
5.11 Summary of indirect effects –ATC 78
5.12 Summary of total effects –DP 81
5.13 Summary of direct effects –DP 82
5.14 Summary of indirect effects –DP 83
LIST OF FIGURES
FIGURE NO TITLE PAGE
1.1 Passenger car per 1000 people in 2009 and 2010 2 1.2 Private car registered in Malaysia 2005-2011 2 1.3 Transportation mode by domestic tourist 3
2.1 Hypotheses model path 15
3.1 Research framework 16
3.2 Boxplot on attitude toward car 22
3.3 Summary of important driving satisfaction factors 31 3.4 Summary of important driving satisfaction factors 32
4.1 Research framework 38
4.2 Site location 40
4.3 Places of attractions close to Desaru 41
4.4 Senai Desaru Expressway (SDE) 42
4.5 Details on driving satisfaction and tourism activities 44
4.6 Employment fields 49
4.7 Trips purposes 50
4.8 Influencing person or factors to Desaru 51
4.9 Annual tourism trips by mode of transport 52
4.10 The usage of SDE 53
4.11 Changes in driving satisfaction level from home to Desaru 54 4.12 Changes in driving satisfaction level from Desaru to home 55 4.13 Changes in tourism activities satisfaction 56 4.14 Changes in tourism activities satisfaction 57
5.1 SEM model 63
5.2 Overall model fits 64
6.1 Tourist origin 95
6.2 Respondent’s past experiences on E22 96
LIST OF ABBREVIATIONS
HOS - Highway overall satisfaction
DOS - Destination overall satisfaction
OVS - Overall satisfaction
TA - Tourism activities satisfaction
SDE - Senai Desaru Expressway
LIST OF SYMBOLS
𝑝̂ - The sample proportion
x - The characteristics of interest
n - Sample size
α - Type I error, significant level
β - Type II error
P - The population proportion
H
0- The null hypothesis
H
I- The alternative hypothesis
Z
- The normal test statistic
LIST OF APPENDICES
APPENDIX TITLE PAGE
A Online questionnaire survey 102
B Chi square test 109
C Mann Whitney test result 118
D Desaru survey questionnaire 126
E Drivers group differences based on z statistics 139
F Total effects, direct and indirect effects 152
CHAPTER 1
INTRODUCTION TO RESEARCH
1.1 Background
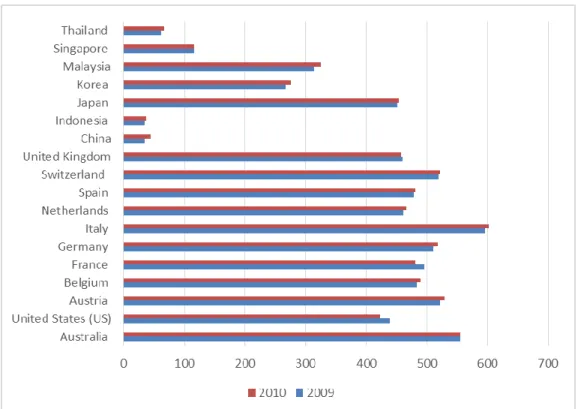
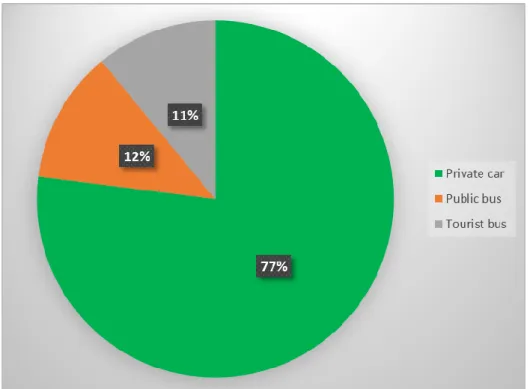
According to a recent World Bank report, as of 2011, Malaysia had the highest level of car ownership in Southeast Asia, with 341 cars per 1000 people (figure 1.1 and 1.2). The same report also showed that there are, on average, about 70 vehicles per kilometer of road (World Bank, 2015). Furthermore, reports from national planning agencies consistently show the necessity of private car usage in daily activities throughout Malaysia were at the ratio of 70 to 30 percent of private car usage compare to other mode of transport (JPBD, 2010). Despite previous evidence of private car usage in national planning, the Iskandar Regional Development Authority (IRDA) reported that nearly 80% of domestic tourists travelled by car to the tourism destinations (figure 1.3). This situation is consistent with (Denstadli & Jacobsen, 2011), (Prideaux and Calson, 2011) which stressed that the use of a private car for holiday travel is a common choice due to convenience factor.
Since car usage is common for all travel purposes in Malaysia, therefore
during the tourism peak period, most of the drivers experienced to be involved in
traffic congestion, time consuming for using parking lots and service area, longer que
to reach the toll gate and also delay in arrival to the destinations. These occurrences
not only hinder the total journey but expected may cause the self-driving tourist
frustration, fatigue or dissatisfaction while driving to the tourist destinations or to do
tourism activities.
Figure 1.1: Passenger car per 1000 people in 2009 and 2010 Source: World Bank, 2015
0 100000 200000 300000 400000 500000 600000
1 2 3 4 5 6 7
Series1 537900 458294 468512 537092 513954 585304 594610
Private car registration 2005-2011
Figure 1.2: Private car registration in Malaysia from 2005 to 2011
Source: Road Transport Department Malaysia, 2014
Figure 1.3: Domestic tourist transportation mode to the destination Source: IRDA, 2009
Moreover, the arrival of domestic tourist by private car to the destination is expected to growth annually. This trends consistent with the growth in car ownership in Malaysia. Therefore, to reduce the impact of the above mentions situation, the attention to improve the level of service on the access and egress route network has been recognized by the national government in the review policy document titled
“Strategic Review of Malaysia’s Tourism Industry Policy and Implementation”
(SRMTIPI) (Ministry of Tourism Malaysia, 2013). This document shows that the government have an interest to improve the self-driving journey for the new tourism destinations by given more focus to the road infrastructure improvement. However, this study found that the document lacks to include more aspect of drivers’
preferences while driving for tourism trips.
Therefore the aim of this study was to incorporate and examine driving
satisfaction, both on the highway and within the destination in evaluating of overall
tourist satisfaction. This paper contributes to our understanding of overall tourist
satisfaction by providing insights into how drivers are likely to vary with regard to
tourist activities and levels of overall satisfaction. The findings of this study will help not only to increase overall tourist satisfaction in getting to and from tourist destinations but will also suggest guidelines for suitable policies and tourism development plans relating to road infrastructure design and relevant improvement along routes to tourist destinations.
1.2 Problem Statement
A large number of tourism studies have been conducted in order to examine the impact of various characteristics of tourism destinations on overall tourist satisfaction or dissatisfaction (Chi and Qu 2008; De Rojas and Caman 2008; Kozak and Rimmington 2000). These studies showed that overall tourist satisfaction is strongly related to elements such as accommodation, food and restaurants, attractions, weather, natural environment, transportation, and shopping facilities.
Furthermore, Chi and Qu (2008) showed that high levels of tourist satisfaction can have a positive impact on destination loyalty (i.e., intent to revisit). However, few studies have examined the effects of specific tourist travel mode experiences on overall satisfaction. The aforementioned studies fail to evaluate basic travel satisfaction as proposed by Clawson and Knetsch (1971), which takes into account pre-trip, en-route, in-destination and return trip experiences for travellers.
On the other hand, studies focusing on scenic tourism routes have investigated tourist satisfaction in the travel phrases mentioned above. Del Bosque &
Martín (2008); Assaker et al. (2011); Hardy (2003); Denstadli & Jacobsen (2011);
and Taylor & Prideaux (2008) examined self-drive tourist driving satisfaction regarding the aspects of tourism novelty seeking, theme tourism and drive tourism.
Denstadli & Jacobsen (2011) found that driver satisfaction with scenic routes is highly influenced by driving motivation and the quality of roadside facilities. This study also found that the roadside facilities also contribute to destination loyalty.
This finding is consistent with Hardy (2003), who revealed that, in the context of
driving satisfaction and touring routes, relevant tourism route developments and
higher quality of driving performance factors are likely to increase intention to revisit
among different travel phrases is ignored. Similarly, the above studies focusing on overall tourist satisfaction focused only upon specific tourism routes and related tourism destination factors.
However, reliable evidence has also been found to indicate that self-drivers’
satisfaction differs before the trip compared to during the trip (Ettema et al., 2013).
This study assessed the effects of road conditions on driver satisfaction using the travel satisfaction scale. The results of this study indicated that the satisfaction travel scale was influenced by traffic safety, annoyance with other road users, fatigue, distraction by billboards, and lack of speed and freedom over lane choice. These findings are consistent with those of Flannery et al. (2006), who suggested that comprehensive assessment of roadway level-of-service (LOS) should include drivers’ expectations, road operational condition, population density, pavement quality and landscape quality factors that correlate well with customer satisfaction.
Thus far, the method for measuring the roadway performance is based only on the LOS performance of the roadway itself. Furthermore, several studies have attempted to address the limitations of conventional LOS assessment by taking the driver’s perspective into account (Hussain et al., 2014). For example, Sakai et al.
(2011) produced LOS metrics consistent with drivers’ subjective evaluations.
However, this study analysed customer satisfaction in terms of drivers’ perceptions only with respect to specific traffic flow segments and the number of highway lanes.
In addition, the study evaluated a limited set of metrics, including speed, freedom in driving, traffic interference, amenities and convenience. Interestingly, the results showed major differences between the new LOS model evaluation and that of the Highway Capacity Manual (HCM 2000) for the selected road section.
Many interesting findings on the factors contributing to overall tourist satisfaction and driver satisfaction have been reported by Ettema et al. (2013);
Denstadli & Jacobsen (2011); and Hardy (2003). However, most studies do not
comprehensively examine the effects of driving conditions on tourist satisfaction. For
example, previous studies have shown that self-drive tourists are affected by
infrastructure, transport facilities design, traffic operation, scenic highway environments, and tourism destination characteristics upon overall satisfaction.
Therefore this study aims:
To understand the effect of driving satisfaction to the tourism activities and tourist overall satisfaction.
The finding of this study then later will be helped to improve the existing country’s tourism and transportation related policies.
1.3 Research Objectives
The objectives of this research are:
1. To understand the driving satisfaction factors that important to increase the self-drive tourist driving satisfaction in the highway, link to the destination and within the destination.
2. To examine the effects of driving satisfaction to the tourism activities satisfaction and overall tourist satisfaction in the study area by using structural equation modelling.
3. To understand the differences between the drivers behaviors and satisfaction toward the path model.
4. To propose a policy or strategies improvement in the existing policy plan.
To achieve the above aims and objectives, this study ought to answer the following questions:
1. What are the factors that are important to increase drivers’ driving satisfaction?
2. What is the effect of driving satisfaction to the tourism activities satisfaction and the overall tourist satisfaction in study area?
3. What is the effect of overall satisfaction path model to different group of drivers?
4. How the study results can be adopted for suggestion in policy improvement?
1.5 Thesis Organization
This thesis has been organized as follows:
Chapter 2 contains a comprehensive literature review of related researches. Firstly, studies that related to the overall tourist satisfaction and driving satisfaction was investigated in order to construct the study hypotheses and to proposed study method. Then, the proposed study framework was subtracted after understand the interrelationship among the subjects.
Chapter 3 provides an overview of first survey. Firstly this topic explained the
framework of the first study objectives, then followed by the method and
determination of the most important driving satisfaction factors to be included in the
second survey.
study area, questionnaire design, sampling method and technique. The respondents demographic and travel characteristics were explained in percentages to show the information on the variables.
Chapter 5 revealed the results on SEM path analysis. This chapter introduce the model and shows summary factor loading results and hypotheses test. Moreover, drivers attitudes toward car and driving preferences also checked to the SEM model in further understand the differences among two groups of drivers.
Chapter 6 encompasses the overall study conclusions, the contribution of the study
on the policies improvements and limitations in this study for future research.
CHAPTER 2
DRIVING AND TOURISM ACTIVITIES SATISFACTION
This chapter present the reviewed of the main studies that applied in evaluating tourist overall satisfaction. In addition, this chapter also outline the study variables and hypotheses deducted.
2.1 Tourism activities satisfaction
The aim of this study is to evaluate tourist overall satisfaction. Previous studies in tourist overall satisfaction widely recognized that various destination activities and experience elements, including accommodation, food and restaurants, attractions, weather, natural environment, transportation, and shopping facilities, among others, affect tourist's overall satisfaction or dissatisfaction (Chi & Qu, 2008;
Kozak, 2002; Kozak, 2001; and Kozak & Rimmington, 2000;Ragavan et al. 2014).
In these studies, transportation was highlighted as one of the important attributes to the overall tourist satisfaction.
Transportation attributes was measured in the aspect of availability and performance of public transportation. However, the effects of public transportation performance towards road conditions and experiences was less emphasize in previous studies. Moreover, tourists that use public transportation in the destination less effected with road conditions and performance compare to those who drive to or within the destination. Previous tourism studies failed to include road conditions experiences in transportation attributes in evaluating overall tourist satisfaction.
Therefore, this study would like to evaluate the tourist overall satisfaction in the
combination of destination activities and road condition experiences satisfaction by
focusing to the self –driving tourists.
Transport is important part of tourism. Transport normally the element of tourism that takes tourist to the destination, linking the generating region to the destination area and providing methods of moving around within the destination area.
In the tourism trips, the travel to the destination is mean getting from “A to B” and there are often differ form of transport modes involved of number of ways such as coaches, trains, planes and self-drive vehicle. Self-drive vehicles differs in term as its more independent, flexible and dispersed (less directly engaged within tourism transport industry).
Transportation or road research usually based on the assumption that the goal of the road user is to reach the destination safely in order to undertake activities at the destination. However, Prideaux & Carson (2011), found that the self-drive tourists’ trips is based on the perceived values of experiences which include the combination of speed, cost, convenience, novelty, distance and destination.
Moreover, the nature of the self-drive tourism trips impact to the destination differently and associated with users of particular regions, demographics, history, culture and infrastructure. Compare to other countries, self-drive tourism in Malaysia often associated with privately owned vehicles travelled for tourism purposes.
The effects of self-driving tourists in Malaysia have gained attention with the
regard to the driving speed and convenience in the access or egress part to the
tourism destination by the national government in major road infrastructure
development. However, it was found that the existing infrastructure or policy plan
less highlighted to the aspect of driving experiences toward travel cost, driving
comfort and convenience, road infrastructure needs, novelty seeking, travel distance
and destination attractions connectivity. Therefore, this study explores the effect
between the driving experiences toward those aspects in understanding the driving
satisfaction, activities satisfaction and overall satisfaction.
Driving activities are essential for tourism because it shows the ability for tourists to move between the generating and destinations region, as well as to move around (Saenz-de-Miera & Rossello, 2012). Moreover, Guiver et al. (2008), said that the utility of the tourism journey may only be undertaken occasionally or only once compare to a daily journey which commonly have one specific location, time and can be repeated on a daily or weekly basis. Compare to the journeys to work, tourism journey usually involved with many number of possible destinations and can be decided in spontaneous time. Therefore, the interest in understanding traveler driving experiences and assessment to the satisfaction particularly in tourism destinations has been given more focused in scenic routes and recreational vehicle topic.
Denstadli & Jacobsen, (2011); and Hardy, (2003) have evaluated driving and overall satisfaction. These studies primarily focused on the tourism destination routes. Denstadli & Jacobsen (2011) found that self-driving tourists’ satisfaction with scenic routes is highly influenced by the driving motivation factors and the provision of roadside facilities. This finding is consistent with Hardy (2003) and which revealed that, in the context of tourist routes, relevant route developments and higher quality driving experiences are likely to increase self-driving tourists' satisfaction.
These studies successfully showed the relationship between road conditions and overall self-drive tourist satisfaction. Denstadli & Jacobsen (2011), measured attribute satisfaction based on self-drive tourist experiences on landscapes and attractions, outdoor recreation, off the beaten track, suitable road and a variations of travel experiences. This study magnified route facilities and the quality of those facilities along the route. Toilets, rest areas, trails and visual experience (quickest route, beautiful view, interesting landscape and natural attractions) were significantly important in the case of scenic highway.
In the case of normal highway, Ettema et al., (2013) showed road conditions
influenced to car drivers’ satisfaction. The drivers in this study indicated their
subjective evaluation of specific points of the roads to the following road conditions
such as crowded, unsafe, limited speed, annoyed by other drivers, insulted by other
driving in four highway of Netherlands. This study evaluated drivers subjective well- being (SWB) using satisfaction with travel scale (STS) method. The results showed that the recreational trip purposes have positively and higher score for SWB.
Ettema et al., (2013), shows reliable evidence indicated that drivers’
satisfaction differs before the trip compared to during the trip. The output of this study is consistent with Flannery et al. (2006), who suggested that comprehensive assessment of roadway level-of-service (LOS) should include a combination of drivers’ expectations, road operational condition, population density, road pavement and landscape quality factors that correlated well with customer satisfaction. Thus far, the method for measuring the roadway performance is based only on the LOS performance of the roadway itself. Furthermore, several studies have attempted to address the limitations of conventional LOS assessment by taking the driver’s perspective into account (Hussain et al., 2014).
An example, Sakai et al. (2011) produced new LOS metrics by including drivers’ subjective evaluations while driving. This study included customer satisfaction in terms of drivers’ perceptions with respect to the specific traffic flow segments and the number of highway lanes as an additional factors to the existing LOS metrics (speed, freedom in driving, traffic interference, safety, amenities and convenience). Interestingly, the results showed major differences between the new LOS model evaluation and the Highway Capacity Manual (HCM 2000) for the selected road section.
Flannery et al. (2006); Sakai et al. (2011) and Hussain et al., (2014) revealed
the effects on LOS metrics and drivers’ subjective evaluations to the driving
performance and satisfaction. These studies successfully showed the impact of
performance on LOS to the drivers in limited point of highway segment. However,
we found that the evaluation on specific drivers or travel purposes in this study was
neglected. Moreover, this study also found that the effect on level of service
performance in the tourism routes has been discussed in route facilities and
development perspectives. This study found that there is a gap between studies in
tourism and transportation theme on the evaluation of overall satisfaction.
effect on driving performance to one group of drivers (tourism purposes self-drive tourists) in different road segments. This study not only evaluate the effects on driving satisfaction performance, but also evaluate the driving satisfaction performance to the tourism activities satisfaction and overall tourist satisfaction.
In order to evaluate the study model, this study borrowed the concept in transportation studies in measuring drivers’ satisfaction towards level of service performance. This study adopted the LOS metrics (speed, freedom in driving, traffic interference, safety, amenities and convenience) in measuring the driving satisfaction.
Moreover, this study also borrowed the concept in tourism studies in evaluating tourism activities and overall tourist satisfaction. As previous studies in scenic routes mixed between driving experiences and limited tourism activities, this study also evaluate limited number of tourism activities.
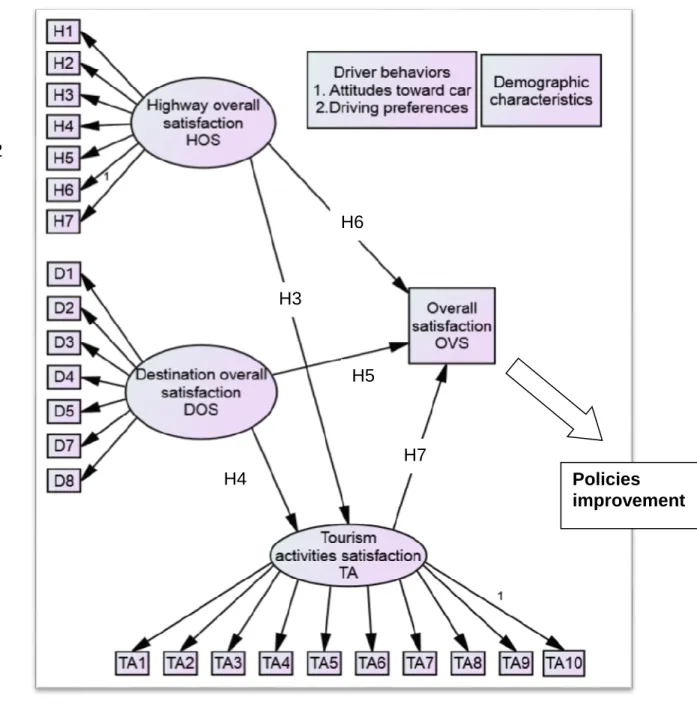
2.4 Hypotheses
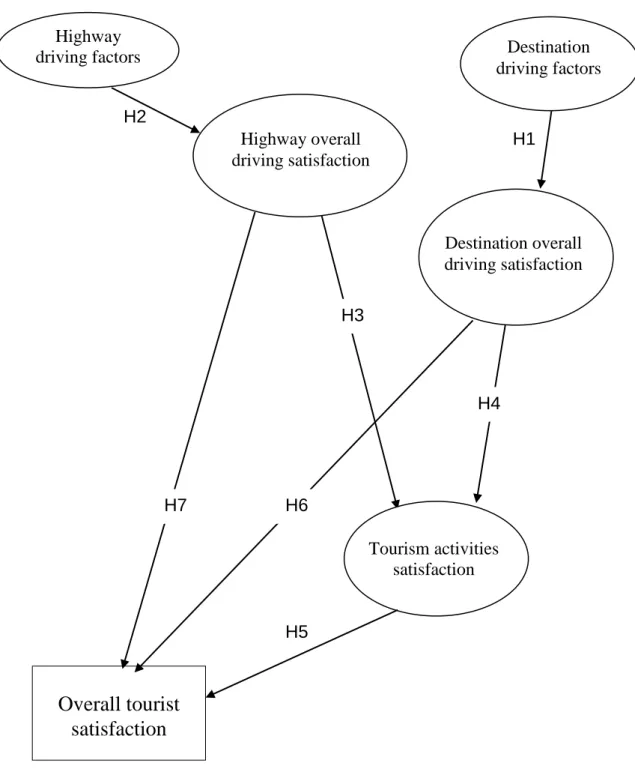
The model shown in figure 2.1 below based on the previous overview and depicts the relationship that were investigated in this study. The overall structure builds based on overall tourist satisfaction studies and describes the effect between attributes driving satisfaction in two road segments (highway and within the destination segments), tourism activities satisfaction and overall tourist satisfaction.
This structure has not previously been addressed both in tourism and transportation studies. Driving satisfaction in different road segments for tourism trips and their satisfaction with tourism activities satisfaction is proposed to be crucial determinants of overall satisfaction. The following new hypotheses included driving satisfaction and overall satisfaction are then suggested as follows:
H
1: At the tourist destination, driving satisfaction factors have significant effects on overall destination driving satisfaction
H
2: Highway driving satisfaction factors have significant effects on overall highway driving satisfaction
H
3: Overall highway driving satisfaction has significant effects on tourism activity satisfaction
H
4: Overall destination driving satisfaction has a significant effect on tourism activity satisfaction
H
5: Overall, destination driving satisfaction has a significant effect on overall tourist satisfaction
H
6: Overall, highway driving satisfaction has significant effects on overall tourist satisfaction
H
7: Tourist activities satisfaction has a significant effect on overall tourist
satisfaction
Figure 2.1: Hypotheses model path
Overall tourist satisfaction
H2
H4 H3
H6 H7
H5
Tourism activities satisfaction
Destination overall driving satisfaction
H1 Highway overall
driving satisfaction
Destination driving factors Highway
driving factors
CHAPTER 3
IDENTIFICATION OF IMPORTANT FACTORS IN ORDER TO INCREASE THE SELF-DRIVE TOURIST IN HIGHWAY, EN-ROUTE TO OR FROM
THE DESTINATION AND WITHIN THE DESTINATION
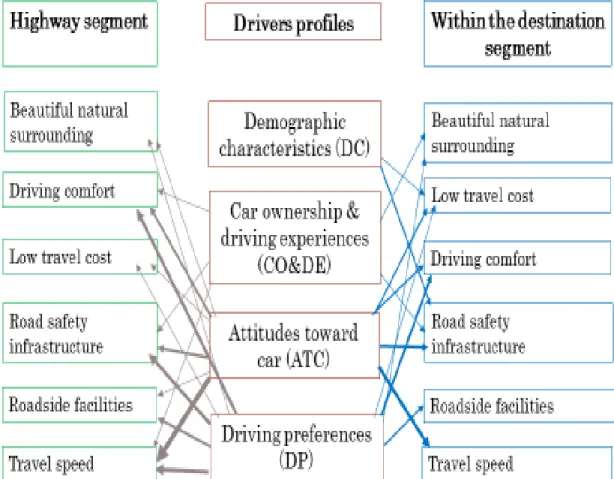
3.1 General framework
The aim of this chapter is to understand the important driving satisfaction factors to be included in the second survey. To understand the overall research, this study was conducted to the following framework shown in figure 3.1:
Figure 3.1: Research framework
1) Drivers background variables
Demographic characteristics
Car ownership and driving experience
Attitudes toward cars
Driving preferences
2) Driving satisfaction factors (23 same driving satisfaction factors)
Highway
En-route to /from the destination
Within the destination
Important factors to be included in second survey
segments: ‘highway’, ‘en route to/from to the destination’, and ‘within the destination’. Demographic characteristics, car ownership and driving experience, attitudes towards car and driving preferences are taken into account in order to understand the influences of different driver behaviors upon various driving satisfaction factors. Finally, the most important of driving satisfaction factors for each road segment included for the second survey.
3.2 Group of factors
There are mixed driving satisfaction factors summarized accordingly to the respective category, Table 3.1. These factors classed adopted from previous studies that assessed roadway level-of-service (LOS).
Table 3.1: Category of driving satisfaction factors
Driving satisfaction factors Category of factors
1. Experiencing beautiful natural and town scape along the route Beautiful natural surrounding 1. Cheap travel costs
2. Discounted price on highway fares
Low travel cost 1. More direct highways or links to enable better access to and
from the destination
2. Congestion information through various media during journey 3. Usage of familiar routes in road segments
4. Driving in good weather conditions 5. Visible signage during the journey 6. Appropriate traffic signal settings
Driving comfort
1. Quality of road surface
2. More than two lanes on roadway to facilitate car movement 3. Physically divided roadway to support car movement in
dangerous areas 4. Flat, straight roadways
Road safety infrastructure
1. Easily available parking facilities at rest stops
2. Comfortable rest areas, attractions and related services along the route
Roadside facilities
1. Drive at preferred speed on leisure trip 2. Reduce driving speed or stop less frequently 3. Speed while driving
4. Low levels of road construction to improve traffic movement 5. Arriving at the destination within the expected time
6. Driving in lower traffic volume
7. Consistency of travel time to the destination 8. Optimizing roadway width to ease congestion
Travel speed
3.3 Sampling method and questionnaire structure
In this research, online questionnaire was conducted to equal number of male and female drivers aged 18 and older in private companies and Malaysian universities. The questionnaire sheet was distributed through email and social networking site. Convenience sampling was applied in order to make sure equal number of participant from both gender. One hundred and three respondents answered to the online questionnaire within one month survey period in January 2015.
The questions items divided into three sections 1) attitudes toward car 2) important factors for driving satisfaction on highway, en-route to/from the destination and within the destination 3) and the demographic characteristics of respondents (refer to Appendix A). For section one respondent were asked about their agreement to the attitudes towards car and driving preferences in five-point scales. For section two, respondents were asked about their driving satisfaction based on their experiences on the previous tourism trip and evaluated how the conditions important in achieving their driving satisfaction. The driving satisfaction is measured with five-point scale where 1= unimportant, 2= little important, 3= moderate important, 4= important and 5= very important. The twenty three driving items from various aspects which include road infrastructure, safety, traffic conditions, road design, driving experience and level of service was rated based on their previous 6 months tourism trip driving experiences at each of road segments.
3.3.1 Data analysis
SPSS version 22 was used for data management and analysis. Chi-square tests of independence were used to determine the relationships between driving satisfaction factors and demographic profiles; attitudes toward cars; and driving preferences on the highway, en route to/from the destination and within the destination. Data analysis was carried out as described below for each road segment.
Example of hypothesis statement for each of variables:
Demographic characteristics (gender, age group, education and household income level)
• Ho=Demographic characteristics (example: age) and (driving satisfaction factor: driving at preferred speed) car are independent.
• H1=Demographic characteristics (example: age) and (driving satisfaction factor: driving at preferred speed) are not independent.
• Significant threshold: P = 0.05
The significant dependent factors then further evaluated by looking at differences between different groups using the Mann-Whitney test (refer to Appendix B).
3.4 Background of respondent
The discussion of the results begins with a brief explanation of respondent profiles, then followed by the results of the important driving satisfaction factors on highway, enroute to/ from the destination and within the destination.
3.4.1 Sample profiles
Young adults (55.3%), including both male (50.5%) and female (49.5%) drivers, were the tourists who have used private vehicles for holidays in Malaysia.
Both men and women generally reported acceptable driving experience (i.e., 1–10
years of driving experience) and driving between 1–10 times per year for tourism
trips. Nearly 80% of drivers were highly educated, and more than half were full-time
workers (Table 3.2). Drivers mainly fell into the middle (RM2,000–RM5,000) and
high (RM6,000 or more) categories of gross household income. The majority of the
drivers came from households including four or fewer persons, which is similar to
the average national household size about 4.3 persons (Penny et al., 2011).
Note: Total respondents = 103
Table 3.2: Sample profiles
Characteristics Percentage (%) Characteristics Percentage (%)
1.Gender 2.Car ownership
Male 50.5 No 15.5 Female 49.5 Yes 84.5
3. Age level 4.Education level
Young 55.3 (Below 30 years)
Non-graduate 20.4 Old 44.7
(31 years & above)
Graduate 79.6
5.Employment 6.Household size
Not employed 31.1 4 persons and less 70.3 Employed 68.9 5 persons and more 29.7 7.Driving experience 8.Annual tourism trips
1 to 10 years 67.0 1 to 10 trips 83.5 More than 10 years 33.0 More than 10 trips 16.5 9.Household income level
Lower income level 25.2
Middle income level 42.7
Upper income level 32.0
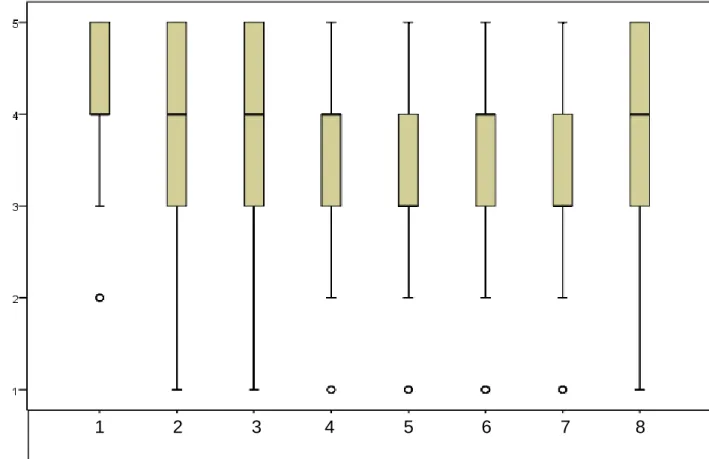
This figures suggests that overall drivers have high level on the attitudes toward car (figure 4.1). Six items in the data set shows that the median scores is four indicated that the respondents strongly believed that driving car is important thing in my life (1), driving a car means independence (2), driving a car is a part of growing up (3), I can afford the responsibilities to have a car (4), driving a car carries some risk to lives (6) and driving a car with green energy is important for me (8).
Moreover, the box plot is comparatively tall suggested that drivers hold a quite different opinions on the drivers’ attitudes to the driving a car means independence (2), driving a car is a part of growing up (3) and driving a car with green energy is important for me (8). Compare to the driving car is important thing in my life (1), this box plot is comparatively short. It’s indicated that the Malaysian drivers believed car highly important for them. This result reflected with the current situation where car highly used for every travel purposes.
The same shape occurred for the drivers with attitude that I can afford the
responsibilities to have a car (4), I feel lost without car (5), driving car carries some
risk to lives (6) and driving car is bad for the environment (7). Its shows that many
drivers have similar views at certain parts of the scales but different distribution on
the opinions toward the individual attitudes.
1 2 3 4 5 6 7 8
Figure 3.2: Boxplot on Attitude toward Car
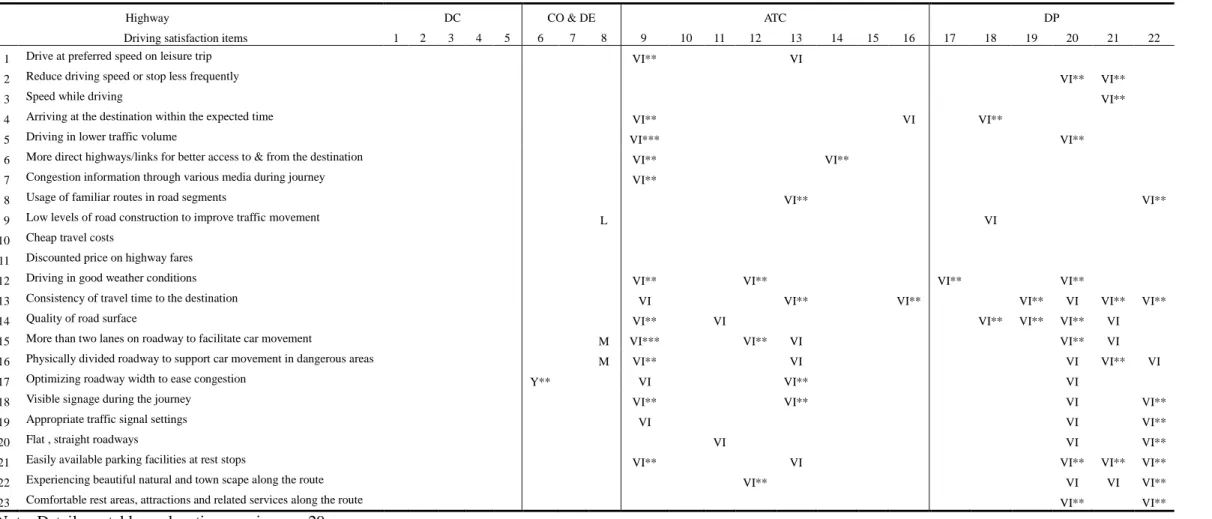
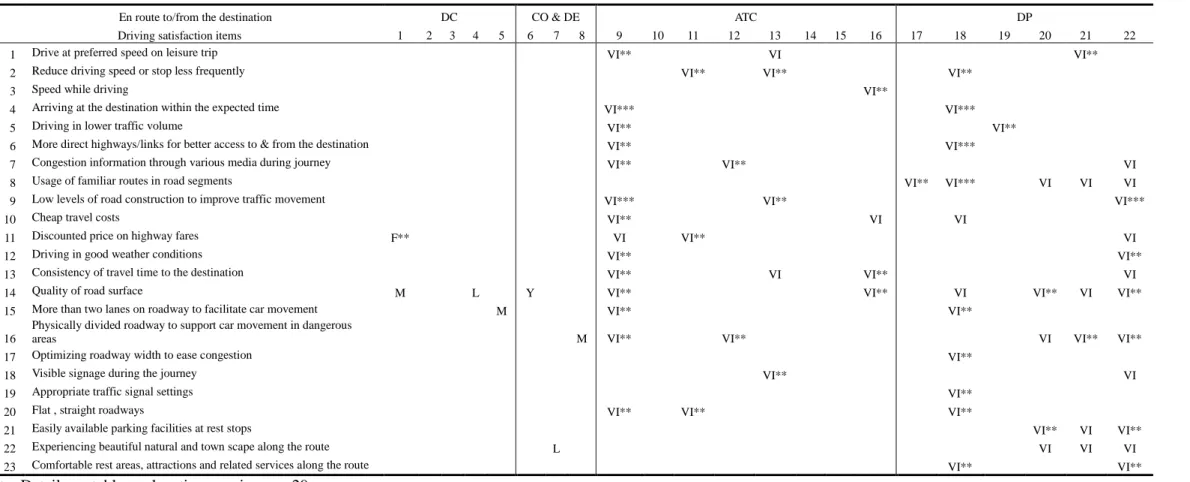
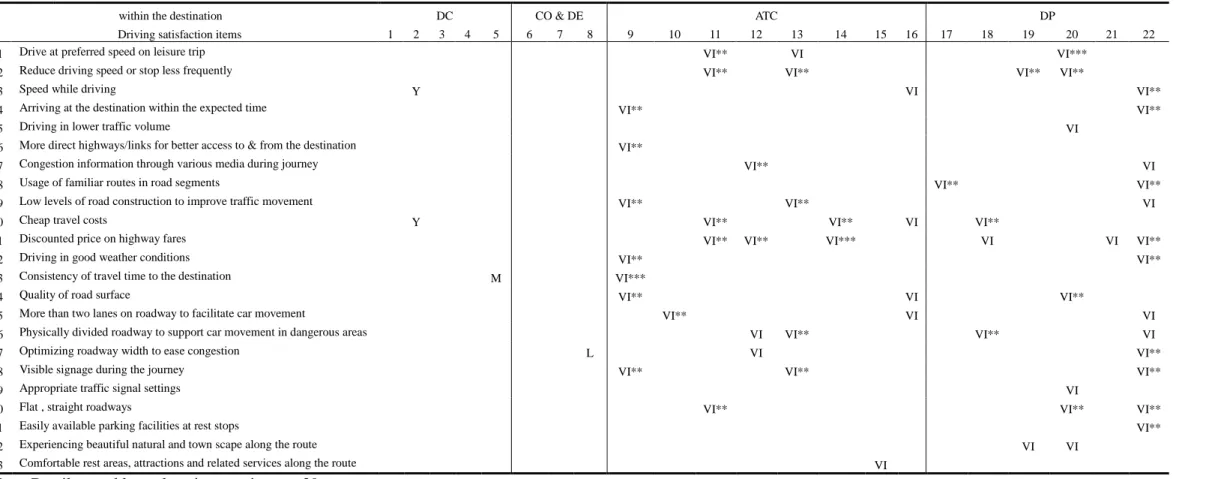
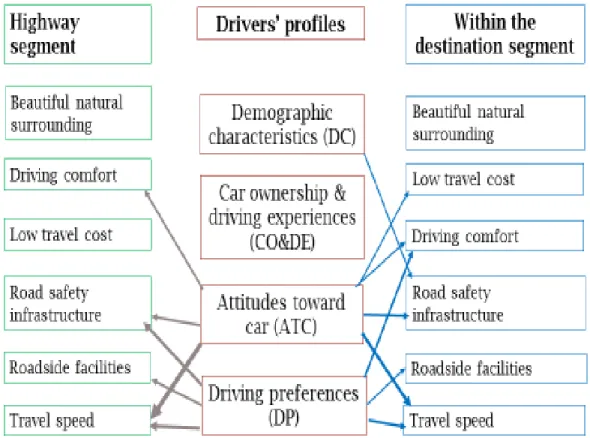
destination and within the destination
This section summarizes the significant dependent driving satisfaction factors and its group effects on the highway, en route to/from the destination and within the destination based on the driver’s background demographic characteristics (DC), car ownership and driving experience (CO & DE), attitudes toward cars (ATC) and driving preferences (DP) (refer to Table 3.3, Table 3.4 and Table 3.5).
(a) Demographic characteristics
Overall, the demographic characteristics have a little relationship on driving satisfaction factors among all road segments, particularly the highway. However, this study found that factors such as discounted highway fare (χ
2= 6.683, df = 2, P = 0.035), and the quality of road surface (χ
2= 7.735, df = 2, P = 0.021) have significant relationship to increase driving satisfaction for female drivers and male in the ‘en route to/from the destination’ road segment. Discounted highway fare factor is more important for female driver (Mdn =56.93), U=1074, z = -2.27, P < 0.05. and the quality of road surface level did not significantly different to the driver (Mdn male
=52.56), (Mdn female =51.43), U=1297, z = -0.33, P > 0.05. In addition, the important on the quality of road surface and a number of lanes did not significantly different for income (Mdn L=50.41, Mdn H= 55.38) and household size (Mdn 4=
48.49, Mdn 5= 56.95) level.
Moreover, the important to have consistency in travel time to the destination (χ
2= 7.047, df = 2, P = 0.029) especially in tourism area did not significantly different for the tourist with less than 4 (Mdn =50.33) or more family members (Mdn
= 52.58). Finally the travel speed factors (speeding while driving) and travel cost (χ
2= 6.676, df = 2, P = 0.036) are more important within the destination compared to
other road segments to all drivers.
(b) Car ownership and driving experience
The results showed that there is no significant different between occasional and frequent self-driving tourist in evaluating the important factors in highway road segment. The ease of journey factors such as low levels of road construction (U = 404, z = -0.510, P > 0.05), more than two lanes on roadway (U = 413, z = -0.340, P >
0.05) and physically divided roadway (U = 408, z = -0.432, P > 0.05) significantly important to increase the driving satisfaction in highway. In addition, the presence of beautiful natural and urban landscapes (χ
2= 12.39, df = 3, P = 0.015) and the quality of road surface (χ
2= 7.041, df = 2, P = 0.03) was important on the en route to/from the destination compared with other road segments. However, these factors did not differ significantly from the car ownership, driving experiences level and total annual tourism trips.
(c) Attitudes toward car
Table 3.3, 3.4 and 3.5 illustrate that there are significant differences between drivers who responded that ‘driving cars is an important thing in my life’ and those who had other attitudes. Interestingly, these results show that drivers who perceived cars as being important in their lives manifest a large number of factor influences to their driving satisfaction. These factors include driving speed, travel time, safety infrastructure, ease of driving and availability of good road network connectivity.
The result shows that most of these factors are very important to increase
driving satisfaction particularly ‘on the highway’ and ‘en route to/from the
destination’ road segments as the results show that most of the mean rank score are
more than 50.00 (Mdn = 50.00 >). Furthermore, the drivers who responded ‘I feel
lost without a car’ on the highway segment shared similar driving satisfaction factors
but less influenced by the driving speed factor. On the other hand, this result also
showed that there are more factors affecting driving satisfaction for self-drive tourists
in the ‘within the destination’ road segment, regardless of their attitudes toward cars.
The present findings show that, in general, drivers who prefer performance (Doing well in life) are affected by various driving satisfaction factors in the ‘en route to/from the destination’ and ‘within the destination’ road segments. This group of drivers agrees on the importance of road safety infrastructure, viewing beautiful panoramas during the journey, and having good parking and service area facilities on the highway and en route to/from the destination. However, not only that, factors such as travel time (‘speed while driving,’ ‘arriving at the destination within the expected time’), road safety infrastructure (‘more than two lanes on roadway to facilitate car movement,’ ‘physically divided roadway’ and ‘suitable roadway width’), cost (‘discounted price on highway fare’) and ease of transit (‘congestion information through various media for a smoother journey,’ ‘driving with visibility signs’, ‘flat and straight roadways’ and ‘easily available parking’) are more important to drivers with the same driving preferences within the destination than in the other two road segments.
The second major finding shows that, many factors have a strong influence to
increase driving satisfaction on the highway for drivers with ‘practical
considerations’. Furthermore, drivers that ‘enjoy listening to music, news and talk
shows’ while driving place great importance factors on the ‘en route to/from the
destination’ road segment. Overall, this section indicates that the factors that
influence to the overall driving satisfaction is varied depending on driving
preferences.
Table 3.3: Results of Mann-Whitney analysis on ‘highway’ road segment
Note: Details on table explanations are in page 29
Highway DC CO & DE ATC DP
Driving satisfaction items 1 2 3 4 5 6 7 8 9 10 11 12 13 14 15 16 17 18 19 20 21 22
1 Drive at preferred speed on leisure trip VI** VI
2 Reduce driving speed or stop less frequently VI** VI**
3 Speed while driving VI**
4 Arriving at the destination within the expected time VI** VI VI**
5 Driving in lower traffic volume VI*** VI**
6 More direct highways/links for better access to & from the destination VI** VI**
7 Congestion information through various media during journey VI**
8 Usage of familiar routes in road segments VI** VI**
9 Low levels of road construction to improve traffic movement L VI
10 Cheap travel costs
11 Discounted price on highway fares
12 Driving in good weather conditions VI** VI** VI** VI**
13 Consistency of travel time to the destination VI VI** VI** VI** VI VI** VI**
14 Quality of road surface VI** VI VI** VI** VI** VI
15 More than two lanes on roadway to facilitate car movement M VI*** VI** VI VI** VI
16 Physically divided roadway to support car movement in dangerous areas M VI** VI VI VI** VI
17 Optimizing roadway width to ease congestion Y** VI VI** VI
18 Visible signage during the journey VI** VI** VI VI**
19 Appropriate traffic signal settings VI VI VI**
20 Flat , straight roadways VI VI VI**
21 Easily available parking facilities at rest stops VI** VI VI** VI** VI**
22 Experiencing beautiful natural and town scape along the route VI** VI VI VI**
23 Comfortable rest areas, attractions and related services along the route VI** VI**