Stable isotope and element characteristic analyses of tea ( Camellia sinensis ) and application to origin
traceability
Qiang Han
Department of Chemistry, Graduate School of Science and Engineering, Tokyo Metropolitan University, 1-1 Minami-Osawa, Hachioji-Shi, Tokyo 192-0397, Japan
[ A THESIS FOR THE DEGREE OF DOCTPR OF SCIENCEI]
September 2014
茶葉の安定同位体及び元素分析およびそ の産地判別に関する研究
韓
強
首都大学東京 博士(理学)学位論文(課程博士)
論 文 名 茶葉の安定同位体及び元素分析およびその産地判別に
関する研究(英文)
著 者 韓 強
審査担当者
主 査
委 員
委 員 委 員
上記の論文を合格と判定する 平成 年 月 日
首都大学東京大学院理工学研究科教授会 研究科長
DISSERTATION FOR A DEGREE OF DOCTOR OF PHILOSOPHY IN SCIENCE
TOKYO METROPOLITAN UNIVERSITY
TITLE:Stable isotope and element characteristic analyses of tea (Camellia sinensis) and application to origin traceability
AUTHOR: Qiang Han
EXAMINED BY
Examiner in chief
Examiner Examiner
Examiner
QUALIFIED BY THE GRADUATE SCHOOL OF SCIENCE AND ENGINEERING TOKYO METROPOLITAN UNIVERSITY
Dean
Date
I
Abstract
Stable isotope and element characteristic analyses of tea (Camellia sinensis) and application to origin traceability
Qiang Han
Introduction
Because the particular flavor and refreshing effects, Tea is a highly popular nonalcoholic beverage consumed in the whole world. Since tea contains several essential nutrients and active component, drinking tea is considered beneficial for human health. The attributes of tea according to its geographical origin and process are somewhat differs, and it often recognized and appreciated by the consumers.
Therefore, the discrimination of tea is presently the focus of attention.
Since stable isotope ratio and elemental composition can provide accurate information about the provenance of a tea sample, it has emerged as one of the most powerful tools for advancing understanding of relationships between plant product and its origin. Isotope ratio mass spectrometry (IRMS) with elemental analyzer (EA) vario ISOTOPE cube was used for C, N and O isotope measurement. Because of its low limit of detection and multi-element measurement capability, inductively coupled plasma mass spectrometry (ICP-MS) is used for determining elements.
Experiments
A total of 39 Chinese made tea and 9 cultivars Shizuoka fresh tea leaves were collected from Hangzhou, China and Shizuoka, Japan, respectively. Each sample was wrapped individually, freeze-dried, and stored at room temperature (20 ℃) before
II being pulverized prior to measurement.
According to the zoning of agricultural development in China, we divided Chinese tea-producing areas into three regions: South of China (SC), East of China (EC) and Middle of China (MC).
For the isotope analysis, tea samples were weighed accurately in tin capsules for C and N measurement and in silver capsules for O measurement. For the element analysis, bulk tea and infusions were digested prior to analysis with ICP-MS.
Data analysis was performed using statistical analysis software SPSS. The chemometric methodology such as linear discriminant analysis (LDA) and principal component analysis (PCA) was used to establish grouping of tea samples.
Tea origin traceability
Three stable isotope ratios and two element contents considered here have already correctly classified around 80% of tea samples for the chosen test areas. The main reasons for the poor prediction ability were similar geological and climatic conditions as well as natural variability on the one hand and the fact, that natural/geographic borders are not always identical with political frontiers on the other hand.
The optimum conditions used the response surface methodology (RSM) for digestion were as follows: heating time of 6.1 h, heating temperature of 132.3 ℃, and liquid amount of 1.6 ml. The major elements in tea are K, Ca, and Mg, and the minor elements are Mn, Al, Fe, Zn, Rb, and Cu. LDA showed a highly satisfactory recognition capability for five classes of tea; 100% of the original groups were correctly classified. The oolong tea group showed higher concentrations of Al, Mn, and Pb than the other groups, suggesting that most of the oolong tea buds had a longer
III
growth time and the leaves were much older than the other types of tea. The methods used for processing as well as the storage methods for teas used could be contributory factors to the variations of Cr, Ni, and Cu contents. Ni mainly originates from the foliar and soil applications of low-quality fertilizers and micronutrients.
Influence factors for stable isotope and element content
The influence factors of the element include the tea cultivars, soil and so on. The level of the majority of elements in tea leaves was significant different among cultivars and harvest time. Furthermore, the stable isotope and elements content among tea tree parts were also measured. Isotopic fractionation for isotope and element moveable for element were used to analysis the various in tea which got from different tree part and harvest time.
Elements in Tea infusion
The contents of various elements in green, black, oolong, and pu-erh teas were measured by ICP-MS. The dependence of the dissolution rate of each element on the extraction time and the number of infusion was determined. By calculating the estimated daily dietary intake as a result of consuming 15 g of tea leaves a day, it was revealed that Cr and Mn exceeded the adequate intake for one day.
IV
TABLE OF CONTENTS CHAPTER 1
GENERAL INTRODUCTION
1.1 Tea ... 3
1.1.1 Tea introduction ... 3
1.1.2 Tea process ... 4
1.1.3 Tea production ... 5
1.2. Method for geographical origin traceability... 6
1.2.1 Food traceability ... 6
1.2.2 Techniques for authenticity ... 7
1.2.3 Techniques for tea authenticity ... 7
1. 3 Stable isotope ratio analysis with EA-IRMS ... 8
1.3.1 Fundamental of sable isotope ... 8
1.3.2 Analytical techniques for isotope ratio ... 8
1.3.3 Introduction of stable isotopes of C, N, O ... 9
1.3.4 Used for food authenticity ... 12
1.3.5 Stable isotopes analysis for tea traceability ... 13
1.4 Element concentration with ICP-MS ... 14
1.4.1 Introduction of element characteristic ... 14
1.4.2 Analytical techniques for element ... 14
1.4.3 Used for food authenticity ... 14
1.5 Statistical analyses... 15
1.6 Motivation and objective ... 16
1.7 Outline of thesis ... 17
References ... 19
CHAPTER 2 Stable isotope analysis of Chinese tea: a possible method for adulteration, geographic origin and tea type discrimination ABSTRACT ... 24
2.1 INTRODUCTION ... 25
2.2 EXPERIMETAL PROCEDURE ... 25
2.2.1 Collection of tea sample ... 25
2.2.2. Preparation for EA-IRMS detect ... 28
2.2.3 Performance of instrument ... 29
2.2.4 Tea adulteration and machine sensitivity verification ... 32
2.3 RESULT AND DISCUSSION... 33
2.3.1 Tea adulteration and machine sensitivity verification ... 33
V
2.3.2 Characteristics of isotopic variations ... 34
2.3.3 Multivariate analysis of the provenance ... 43
2.3.4 PCA analysis based on areas and types ... 46
2.4 CONCLUSION ... 48
Reference ... 49
CHAPTER 3 ICP-MS analysis of Chinese tea and comparison of tea sample preparation methods ABSTRACT ... 52
3.1 INTRODUCTION ... 53
3.2 EXPERIMENTAL SECTION ... 54
3.2.1 Collection of tea sample ... 54
3.2.2 Reagents... 55
3.2.3 Analysis by ICP-MS ... 55
3.2.4 Instrument performance ... 55
3.2.5 Sample pretreatment ... 56
3.2.6 Response surface methodology (RSM) ... 57
3.3 RESULTS AND DISCUSSION ... 57
3.3.1. Performance ... 57
3.3.2 Single factor experiments ... 61
3.3.3 RSM analysis of Mn digestibility in tea ... 63
3.3.4 Discrimination and classification of tea according to their geographical origin and type ... 70
3.3.5 Concentrations of selected elements in Chinese tea ... 72
3.4 CONCLUSIONS ... 79
Renference ... 80
CHAPTER 4 Exploration influence factors for isotope and elements ABSTRACT ... 85
4.1 INTRODUCTION ... 86
4.2 EXPERIMENTAL SECTION ... 87
4.2.1 Samples ... 87
4.2.2 Stable isotope ratio and C, N, O ... 89
4.2.3 Element detect ... 89
4.2.4 PH value ... 89
4.2.5 Statistical analysis... 90
VI
4.3 RESULT AND DISCUSSION... 90
4.3.1 Comparison among various cultivars within the some area (Area A) ... 90
4.3.2 Study of the different parts of tea tree ... 97
4.3.3 Study of the different areas of tea ... 102
4.3.4 Study of the different harvest ... 105
4.4 CONCLUSIONS ... 109
References ... 110
CHAPTER 5 A comparison of elemental characterization of four types Chinese teas infusions ABSTRACT ... 113
5.1 INTRODUCTION ... 114
5.2 EXPERIMENTAL SECTION ... 114
5.2.1 Tea samples ... 114
5.2.2 Digestion procedures and ICP-MS performance ... 114
5.2.3 Infusion preparation ... 115
5.3. RESULTS AND DISCUSSION ... 115
5.3.1 Spiking recovery ... 115
5.3.2 Extraction time, temperature and the number of infusion ... 116
5.3.3 Elements in tea and its infusion ... 118
5.3.4 Estimated daily dietary intake of tea ... 121
5.4. CONCLUSIONS ... 123
Reference ... 124
General conclusion... 126
Acknowledgments... 129
1 CHAPTER 1
GENERAL INTRODUCTION
As tea is traded all over the world, some trade disputes with regard to tea have been occurred. Therefore, an accurate analytical method is required to discriminate both the geographical origins and difference in process techniques for the quality control of tea. Stable isotope ratios and elements characteristic, which was considered as an effective technique of traceability, was playing an important role in tea traceability such as tracking the geographical origin and identifying the adulteration.
Isotope analysis was based on the natural fractionation effect which been influenced by the climate, environment, biological metabolic type in the plant, caused the differences of isotope ratios from different origins. The kind of differs consist of information of environmental factors, could reflect the biology environment conditions. Stable isotopic composition in biology is a natural attribute of material, can used as on kind of “Natural fingerprint”, distinguish origins of material. Isotopic composition analysis in food can provide scientific, independent, immutable identity identification information for its origin traceability. It is not only a kind effective technology of directly trace food origins, but also a kind effective method of supervise and inspect the error identification of food production.
Element concentration in food is also considered a good index for judging the regional source of the food at present world. The composition of trace elements have their own characteristics in different soil, water, waste, and air, it also determines that elements concentration exist differs in food from different geographical origin.
Various techniques based on elemental analyzer Isotopic ratio mass spectrometer (EA-IRMS )and Inductively coupled plasma mass spectrometry (ICP-MS) currently
2
constitute some of the most promising tools for tea authentication. Due to the multivariate character of studies on tea traceability, we also discuss the synergy with multivariate statistics (chemometrics).
3 1.1 Tea
1.1.1 Tea introduction
Tea plant (Camellia sinensis) is the species of plant whose leaves and leaf buds are used to produce the popular beverage tea. It is an evergreen shrub or small tree and is artificially trimmed to around 1 m when cultivated for its leaves. The tea leaves are 4 - 15 cm long and 2 - 5 cm broad (Figure 1-1). The probably origin of tea is around the meeting points of the lands of north Burma and southwest China (Le Gall, Colquhoun, & Defernez, 2004). For tea producing two varieties were major used:
Chinese tea, Camellia sinensis var. sinensis, and Assam tea, Camellia sinensis var.
assamica.
A B
Figure 1-1 tea samples the fresh tea buds (A) and the made tea (B)
Tea plant is an evergreen plant that grows mainly in tropical and subtropical climates. Natural conditions of tea tree growth include as landform, climate, soil type, etc. The topography of tea gardens is mainly hill knap, with good drainage condition.
The climatic and environment conditions suitable for various types of tea tree growth were as follows: large precipitation and temperature difference between day and night, small year temperature difference, long frost-free period, good sunshine conditions.
4
The soil type which suitable for tea tree growth were laterite, lateritic red soil, mountain red soil or mountain yellow soil, brown forest soil. These soils have deeply development degree and good structure.
Tea is a highly popular nonalcoholic beverage consumed by over two-thirds of the world's population owing to its medicinal and refreshing effects (Karak & Bhagat, 2010). Since tea contains several essential nutrients and trace elements, drinking tea is considered beneficial for human health. Recent studies suggest that tea may help reduce the risk of cardiovascular disease and some forms of cancer (Cabrera, Artacho,
& Giménez, 2006), promote oral health (Villaño, Lettieri-Barbato, Guadagni, et al., 2012), reduce blood pressure (Erbay, Turhan, Senen, et al., 2004), help with weight control (Sae-Tan, Grove, & Lambert, 2011), improve antibacterial and antiviruses activity (Friedman, 2007), provide protection from solar ultraviolet light, and increase bone mineral density. Chung et al (2003) reported that tea drinking is associated with the reduction of serum cholesterol, prevention of low density lipoprotein oxidation, decreased risk of cardiovascular disease and cancer. In response to the promotion of health benefits, tea is not only becoming a more popular beverage, but its pharmaceutical and industrial applications are also developing.
1.1.2 Tea process
The young, light green buds are preferably harvested for tea production. They usually have short white hairs on the underside. Frequently, the bud and the first two to three leaves are harvested for processing the Chinese tea. Tea harvest with hand picking is repeated every one to two weeks. However, different harvest time produce differing tea qualities, since their chemical compositions and element concentrations are different. According to the process method, teas can be divided into three major
5
categories as follows (Figure 1-2): unfermented green tea (GT), fully fermented black tea (BT), and partially fermented oolong tea (OT) are the most popular and frequently consumed on the market. Some varieties, such as traditional and Pu-erh tea (PT), Post-fermented tea, has seen a boom in consumption because of its beneficial health effects(Cao, Qiao, Zhang, et al., 2010).
Figure 1-2 Tea process of four typically types of tea
1.1.3 Tea production
Through the statistical data from the international tea committee, global tea production was as large as 4.53 million tons in 2012, 84.96% was produced in Asian.
The production amount of Chinese tea was 1.76 million tons, accounting for 38.89%
of global. Moreover, in 2013 global tea production was still growth with the amount of 4.82 million tons, Asia accounts for 84.39%, the percentage flat with 2012, China's
6
tea production was 1.85 million tons, accounting for 38.39% of global tea production.
After China, the top five countries of largest tea production were India, Kenya, Sri Lanka and Vietnam, total amount of those five accounted for 82.92% of global tea production.
As tea is traded all over the world and so large amount, some trade disputes with regard to tea types occur. Meanwhile, teas from different geographical origins, tea fermentation processes (tea type) or picking methods (buds or old leaves) have significant differences in the composition and antioxidant capacity resulting in different health-promoting properties (Kushad, Brown, Kurilich, et al., 1999) and market selling prices. Therefore, an accurate analytical method is required to discriminate both the geographical origins and difference in process techniques for the quality control of tea.
1.2. Method for geographical origin traceability
1.2.1 Food traceability
The fast increase in food trade around the world and specific risks happened afterwards such as BSE (Bovine Spongiform Encephalopathy) in Europe have resulted in urgent needs for assuring food authenticity for consumers and producers.
In order to complete the whole food chain traceability, producers must collect product information from each link as production, processing, storage, transportation, distribution, process information and environment information, etc. From the technical level, the collection of this information will involve a variety of detection methods and related traceability technology.
7 1.2.2 Techniques for authenticity
Various techniques to identify food authenticity have been tried (Reid, O'Donnell,
& Downey, 2006), including DNA/RNA-based gene amplification and sequences alignment (Bosmali, Ganopoulos, Madesis, et al., 2012), specific protein markers developed by antibodies’ targeting (Nam, Thaxton, & Mirkin, 2003), Chemical composition analysis as high performance liquid chromatography (HPLC) (Chen, Guo,
& Zhao, 2008), gas chromatograph/mass spectrometry (GC/MS) technique (Andreis, Kullmer, & Appel, 2014), and metabolic profiling from NMR/MS spectra (Jung, Lee, Kwon, et al., 2010).
1.2.3 Techniques for tea authenticity
Tea is usually classified based on sensory evaluation. However, sensory evaluation largely depends on the subjective consciousness which will be affected by many factors, such as the mental state of testers. Meanwhile, the content of compounds such as polyphenols, fluoride, caffeine, aqueous extract, total polyphenols, total free amino acids, caffeine, theobromine, and theophylline in tea were usually analyzed for discriminant the tea origins with chromatography instruments like HPLC (Budı́nová, Vláčil, Mestek, et al., 1998). Moreover, the characteristic volatile flavour compounds detected by solid-phase micro-extraction coupled with gas chromatography (SPME–GC) analysis was used to discriminate different degrees of fermentation of tea (Wang, Lee, Chung, et al., 2008).
To sum up, the food traceability is a new research field, and tracing system of the whole food chain will involve in a wide range of content. In present, the researchers considered to explore of food traceability technology method from different angles.
Food origin traceability is part of the food chain traceability system, isotope and
8
mineral elements fingerprints analysis is one of effective method of food origin traceability.
1. 3 Stable isotope ratio analysis with EA-IRMS
1.3.1 Fundamental of sable isotope
Isotope analysis was based on the natural fractionation effect which been influenced by the climate, environment, biological metabolic type in the plant, caused the differences of isotope ratios from different origins. The kind of differs consist of information of environmental factors, could reflect the biology environment conditions. Stable isotopic ratio in biology is a natural attribute of material, can used as on kind of “Natural fingerprint”, distinguish origins of material. Isotopic composition analysis in food can provide scientific, independent, immutable identity identification information for its origin traceability. It is not only a kind effective technology of directly trace food origins, but also a kind effective method of supervise and inspect the error identification of food production.
1.3.2 Analytical techniques for isotope ratio
EA-IRMS is traditionally used for stable isotope analysis of H, C, N, O and S, for which simple gases (H2, CO2, N2, CO and SO2) are produced prior to ionization, mass separation and ion detection. The conversion to gases, as well as the use of a dedicated magnetic sector field for separation and discrete Faraday cups for simultaneous quantification of several ion beams, allows isotope-ratio precisions in the range 0.01–0.2‰. Thus, IRMS is highly suitable for stable-isotope analysis of bulk plant tissue at the natural level of abundance.
9
Isotope ratio data were reported in conventional δ-notation in units of per mil (‰) with respect to reference material, according to the following formula 1-1:
δref = (Rsam /Rref -1 )× 1000 (‰) 1-1 where δref is the isotope ratio of the sample expressed in delta units (‰, per mil) relative to the reference material; and Rsam and Rref are the isotope ratios of the sample and reference material, respectively. The reference material for C, N, and O were the isotope ratio in PeeDee belemnite (PDB), Air, Standard mean ocean water, respectively (Table 1-1).
Table 1-1 Reference material for isotope
Elements Primary Standards Isotope Ratios Ratios x 10-6 Carbon PeeDee belemnite (PDB) 13C/12C 11237.2
Nitrogen Air 15N/14N 3676.5
Oxygen Standard mean ocean water 18O/16O 2005.20
1.3.3 Introduction of stable isotopes of C, N, O 1.3.3.1 Carbon isotope
Stable carbon isotope ratios were related to plant photosynthetic carbon metabolic pathway and the plants’ environment conditions during growth. So, the δ13C value in plant was the combined action of biological factors and environmental factors. Based on the ways of carbon fixation, the plant could be classified as C3, C4 and CAM (Crassulacean acid metabolism approach) plant, there was a large difference of δ13C value among the different kinds of plants. The various δ13C values as shown in table 1-2. The order from highest to lowest was C3 > C4 > CAM.
Carbon isotopic composition of plants not only related to its photosynthetic carbon metabolism pathway is also affected by external environmental factors.
According to previous research, except the factor of carbon fixation way, carbon
10
isotope fractionation were influence by those factors as temperature, air pressure, sunshine and carbon isotopic composition in atmospheric.
Table 1-2 Various δ13C value of plant
Kinds of carbon fixation range of variation The value of high frequency
C3 -34 ‰ - -22‰ -27 ± 2‰
C4 -19 ‰ - -9‰ -13 ± 2‰
CAM -38 ‰ - -13‰ -17 ± 2‰
1.3.3.2 Nitrogen isotope
Nitrogen has two stable isotopes 14N and 15N, and the 14N/15N value in the air has constant value 1/272. So the N isotopic composition (δ15N) was usually expressed with micrometer deviation relative to the atmospheric N2 in nitrogenous substances.
Though the abundance of nitrogen was very low on earth, but plays a very important role in the process of life, nitrogen is the main nutrition elements of earth surface environment. There was different nitrogen isotopic composition in nitrogenous substances from different sources. Synthetic chemical fertilizers usually have the lower δ15N value (Table 1-3). δ15N value in plants was depends on nitrogen (NO3- and NH4+) in soil, moreover, N isotope ratio in the soil was depends on the geographical and climate conditions, and had largely related to agricultural fertilizer. They can affect the biological conversion process as mineralization, nitrification, denitrification and the absorption of nitrogen, and then affect the fractionation effect of nitrogen isotope and loss of N.
Table 1-3 Various δ15N in some typical material value of plant
Material range of variation
NO3- 2‰ - 8‰
Waste from human and animal 10‰ - 20‰
Synthetic chemical fertilizers -3‰ - 3‰
11
Mainly water and nutrient availability in addition to light intensity and temperature, and they can be useful as indicatives of their origin, thereby providing tools to delimit the potential cultivation areas of the plants if the conditions are significantly different.
1.3.3.3 Oxygen isotope
Oxygen as a main part of the water molecules is the most ideal for tracer isotope water cycle. There are three kinds of oxygen stable isotope: 16O, 17O, 18O, commonly use 18O/16O to express the oxygen stable isotope ratio (δ18O). Previously research has shown that the isotope fractionation effect of δ18O in the water cycle mainly depended physical change, such as the change of the condensation and evaporation of the rain.
In common, δ18O value in nature water has the typical Latitude effect, land effect and season effect and altitude effect. The variation tendency of δ18O value as follow (Table 1-4): Decreases with the increase of latitude and altitude, showed a decreasing from the coast to inland direction, decreases with the decrease of air temperature. The δ18O value in water also changes influenced by temperature and precipitation. The major influence factor of rainfall δ18O value various in high latitude area is temperature while in the low latitude of tropics was amount of precipitation, but in the middle latitude area, the δ18O value would been influenced by both amount of precipitation and temperature (Shibuya, Sarkis, Negrini-Neto, et al., 2007).
Table 1-4 Major reason of various δ18O in rainfall in different area Area Major factor of influence δ18O
Low latitude Amount of precipitation
Middle latitude Amount of precipitation and temperature High latitude Temperature
12 1.3.4 Used for food authenticity
Stable isotope analysis which detected at the level of internal molecular has emerged as one of the most powerful tools for advancing the understanding of relationships between the plant product and its origin mainly due to the evidence from the studies of ecological effects on the stable isotope ratios (Kelly, Heaton, &
Hoogewerff, 2005).
Until now, by using stable isotope to discriminate the samples still accounts for a large proportion of all related studies (Korenaga, Musashi, Nakashita, et al., 2010), such as C for plant-originated food (Conrad, Klose, & Claus, 2002), C, H and O for juices (Rummel, Hoelzl, Horn, et al., 2010), O for beers (Giner Martinez-Sierra, Santamaria-Fernandez, Hearn, et al., 2010) and. H and O are often used for liquid or semi-liquid materials which reflect the stable isotope fractionation in water resulted from the local climatic or geographical change. C and N are investigated when the photosynthesis, N fertilizer and atmospheric circulation are involved (Kelly, Heaton,
& Hoogewerff, 2005). In the present research progress, by investigating H, C, N and S, lamb meat from different European regions has been classified by geographical origin as correctly as 78%, with the elucidation that C and N are linked with feeding practices and climate (Camin, Larcher, Perini, et al., 2010). For C and N used for detecting the adulteration of honey, it has been confirmed that geographical other than botanical origin has major influence on the stable isotope ratios of honey and the influence of season could be effective as well (Kropf, Korošec, Bertoncelj, et al., 2010). Korenaga, Musashi, Nakashita, et al. (2010) have confirmed that C, N and O are valuable for the precise discrimination of rice samples with different geographical origin, which is connected with the climate, water resources and fertilizer of the local places. In addition, in the discrimination of beverages waters (Chesson, Podlesak,
13
Erkkila, et al., 2010), beef from different European and non-European countries (Osorio, Moloney, Schmidt, et al., 2011), using light elements has been shown to be a powerful tool for the significant discrimination of samples. Actually, the discrimination by using light elements is possible not only for samples from different regions, but also for those from the same place. For example, wines made from different grape breed varieties grown in the same field have shown significantly different isotopic values, in which H and C stable isotope ratios are mainly connected to mean temperature and total rainfall, other than humidity and thermal sums (Aghemo, Albertino, Gobetto, et al., 2011).
1.3.5 Stable isotopes analysis for tea traceability
Considerable efforts are currently being made to find reliable analytical methods for tea origin discrimination and authentication. Thus, stable isotopes are often used for fingerprinting tea as they integrate the isotopic signature of its provenance. Carbon and nitrogen are the most important nutrient elements for tea cultivation because the large quantities and metabolism-related. Quantifying budgets for carbon and nitrogen percentages will assist to explore the response of origins of tea plantations and management interventions such as uprooting, fertilization, irrigation (Kamau, Spiertz,
& Oenema, 2008).
It can be seen from the above data analysis, variation discipline of isotope ratio in geology, soil and plant widely applied to the environment science, biological science and geochemistry. These researches and applications provided a theoretical basis for food origin traceability.
14 1.4 Element concentration with ICP-MS
1.4.1 Introduction of element characteristic
Element concentration in food is also considered a good index for judging the regional source of the food at present world. The composition of trace elements have their own characteristics in different soil, water, waste, and air, it also determines that elements concentration exist differs in food from different geographical origin.
1.4.2 Analytical techniques for element
ICP-MS used for food authenticity has provided an opportunity for multi-elements analysis. Because of its low limit of detection (LOD) and multi-element measurement capability (Salomon, Jenne, & Hoenig, 2002), ICP-MS is used in a number of food analysis laboratories for determining elements at trace and ultratrace levels (Walczyk, 2001). Therefore, ICP-MS has been considered to be one of the most effective tools for determining the provenance of tea (Chudzinska, Debska,
& Baralkiewicz, 2012; Herwig, Stephan, Panne, et al., 2011).
1.4.3 Used for food authenticity
Elements with a relatively stable distribution in environment have been used for different topics and serve as the indexes for specific environment (Villagra, Santos, Vaz, et al., 2012). This technique has been employed for the determination of trace metals in olive oil (Llorent-Martínez, Ortega-Barrales, Fernández-de Córdova, et al., 2011), honey (Chudzinska & Baralkiewicz, 2011), tomato (Bressy, Brito, Barbosa, et al., 2013), and particularly in tea. The number of studies on the application of this technique to tea has increased in recent years (Bressy, Brito, Barbosa, et al., 2012;
Chudzinska & Baralkiewicz, 2011; Llorent-Martínez, de Córdova, Ruiz-Medina, et al.,
15
2012; Pilgrim, Watling, & Grice, 2010), but such studies only dealt with the identification the geographical origin of tea samples, not in association with the types of tea.
Obviously, how to get the representative elements as indicators from multi-element analysis is important because not all elements work well for evaluation.
Some heavy elements may not be suitable for food authenticity because of their toxicity, but they could be useful for the inspection of food contamination as well as in the evaluation of environmental parameters. In the long run, apart from the universal standard for isotope analysis of various samples from different regions, a database for the distribution of all stable isotope elements will be potentially demanded.
A recent study has demonstrated that the presence of trace elements in tea is due to tea plants being normally grown in highly acidic soils, where trace elements are potentially more bioavailable for root uptake (Han, Zhao, Shi, et al., 2006).
In addition, not only the combination of elements, but also the combination with other fingerprint indicators could be used for identification of food samples, such as multi-elements combined with chemical analysis of organic and stable isotope ratios used for the identification of samples.
1.5 Statistical analyses
As important as the procedure and techniques for instruments, the statistical analysis for results needs also to be improved further. Multivariate statistics (chemometrics) largely affect the food traceability, such as data exploration, generation of multivariate models. In present, chemometric methods as a standard procedure were applied to data for extraction of latent information and to provide a
16
fast data overview prior to univariate statistical analysis or multivariate classification analysis.
Chemometric methods can be roughly divided into two categories: 1, unsupervised methods. The unsupervised methods encompass principal component analysis (PCA), hierarchical cluster analysis (HCA). These methods are purely descriptive of the underlying data structure. 2, supervised methods. The supervised method such as linear discriminant analysis (LDA) was used to sort samples into predefined classes. In order to meet our objective that maximizing the difference among the groups of tea, the supervised methods LDA was mainly used. In general, we usually both used unsupervised and supervised methods to avoid over-fitting and thus over-optimistic classification results.
1.6 Motivation and objective
Stable isotope and element characteristic analyses technology as one of the effective methods was used in food origin traceability, occupies an important position in the food traceability system. The following objectives are expected from this study.
Establish a new and simple way to discriminate tea by origin and processing based on the application of multi-element stable isotope analysis and element.
Explore the influence factors in stable isotope and element characteristic, such as tea cultivars, parts of tea plant, and harvest time by analyzing the tea grown under the same conditions. Point out the distribution and transport law of elements in vivo tea.
Reveal the element characteristic in four typical Chinese teas leaves and the dependence on the extraction time, temperature and the number of infusions.
17 1.7 Outline of thesis
This section introduces the overall content of the study, and the relations between each chapter are presented in figure 1-3.
Figure 1-3 Outline of this thesis
Chapter 2
Chinese tea samples from three large regions throughout Chinese tea producing areas were studied using EA-IRMS to verify origins and to discriminate among the technical characteristics of the samples. Of the tea samples, 81.6% and 76.9% were correctly classified for the growing region and tea type by using linear discriminant analysis of data obtained from element compositions (C and N percentage) in combination with stable isotope data (δ15N, δ18O and δ13C), which had a high degree of confidence. Significant composition differences existed in the elemental levels of carbon (C), nitrogen (N) and oxygen (O) as well as in the isotopic ratios as a result of fermentation, geographic location and climate conditions.
Chapter 3
A digestion method was developed on the basis of response surface methodology (RSM). Based on these conditions, tea samples were analyzed by ICP-MS. LDA of whole data sets was performed in order to discriminate and classify Chinese tea samples according to their origin and type. The analysis revealed an excellent separation between tea samples according to their type and origin with a
18
discrimination efficiency of 100%. The varieties of selected elements in Chinese tea were analyzed based on their origins and types.
Chapter 4
The influence factors for isotope and elements include tea cultivars, tea tree parts, harvest time and areas were detected. The level of the majority of elements and stable isotope in tea leaves was significant different among cultivars, using ANOVA analysis.
The classifications of tea cultivars were clearly separated used the chemometric methodology. The different from areas also had an impact on elements contents and stable isotope ratios. The date from harvest time indicated the variation of the parameters during the tea growth, the trend was similar as the variation of aging leave and buds.
Chapter 5
The contents of various elements in green, black, oolong, and pu-erh teas were measured by ICP-MS. The dependence of the dissolution rate of each element on the extraction time and the number of infusion was determined. By calculating the estimated daily dietary intake as a result of consuming 15 g of tea leaves a day, it was revealed that Cr and Mn exceeded the adequate intake for one day.
19 References
Aghemo, C., Albertino, A., Gobetto, R., & Spanna, F. (2011). Correlation between isotopic and meteorological parameters in Italian wines: a local‐scale approach. Journal Of The Science Of Food And Agriculture, 91(11), 2088-2094.
Andreis, E., Kullmer, K., & Appel, M. (2014). Application of the Reference Method Isotope Dilution Gas Chromatography Mass Spectrometry (ID/GC/MS) to Establish Metrological Traceability for Calibration and Control of Blood Glucose Test Systems. J Diabetes Sci Technol, 8(3), 508-515.
Bosmali, I., Ganopoulos, I., Madesis, P., & Tsaftaris, A. (2012). Microsatellite and DNA-barcode regions typing combined with High Resolution Melting (HRM) analysis for food forensic uses: A case study on lentils (Lens culinaris). Food Research International, 46(1), 141-147.
Bressy, F. C., Brito, G. B., Barbosa, I. S., Teixeira, L. S. G., & Korn, M. G. A. (2012).
Determination of trace element concentrations in tomato samples at different stages of maturation by ICP OES and ICP-MS following microwave-assisted digestion.
Microchemical Journal.
Bressy, F. C., Brito, G. B., Barbosa, I. S., Teixeira, L. S. G., & Korn, M. G. A. (2013).
Determination of trace element concentrations in tomato samples at different stages of maturation by ICP OES and ICP-MS following microwave-assisted digestion.
Microchemical Journal, 109, 145-149.
Budı́nová, G., Vláčil, D., Mestek, O., & Volka, K. (1998). Application of infrared spectroscopy to the assessment of authenticity of tea. Talanta, 47(2), 255-260.
Cabrera, C., Artacho, R., & Giménez, R. (2006). Beneficial effects of green tea—a review.
Journal Of The American College Of Nutrition, 25(2), 79-99.
Camin, F., Larcher, R., Perini, M., Bontempo, L., Bertoldi, D., Gagliano, G., Nicolini, G., &
20
Versini, G. (2010). Characterisation of authentic Italian extra-virgin olive oils by stable isotope ratios of C, O and H and mineral composition. Food Chemistry, 118(4), 901-909.
Cao, H., Qiao, L., Zhang, H., & Chen, J. (2010). Exposure and risk assessment for aluminium and heavy metals in Puerh tea. Science of The Total Environment, 408(14), 2777-2784.
Chen, Q., Guo, Z., & Zhao, J. (2008). Identification of green tea’s (Camellia sinensis (L.)) quality level according to measurement of main catechins and caffeine contents by HPLC and support vector classification pattern recognition. Journal of Pharmaceutical And Biomedical Analysis, 48(5), 1321-1325.
Chesson, L. A., Podlesak, D. W., Erkkila, B. R., Cerling, T. E., & Ehleringer, J. R. (2010). Isotopic consequences of consumer food choice: Hydrogen and oxygen stable isotope ratios in foods from fast food restaurants versus supermarkets. Food Chemistry, 119(3), 1250-1256.
Chudzinska, M., & Baralkiewicz, D. (2011). Application of ICP-MS method of determination of 15 elements in honey with chemometric approach for the verification of their authenticity.
Food And Chemical Toxicology, 49(11), 2741-2749.
Chudzinska, M., Debska, A., & Baralkiewicz, D. (2012). Method validation for determination of 13 elements in honey samples by ICP-MS. Accred qual assur, 17, 65-73.
Chung, F. L., Schwartz, J., Herzog, C. R., & Yang, Y. M. (2003). Tea and cancer prevention:
Studies in animals and humans. Journal Of Nutrition, 133(10), 3268S-3274S.
Conrad, R., Klose, M., & Claus, P. (2002). Pathway of CH4 formation in anoxic rice field soil and rice roots determined by 13C-stable isotope fractionation. Chemosphere, 47(8), 797-806.
Erbay, A. R., Turhan, H., Senen, K., Yetkin, O., Yasar, A. S., Sezgin, A. T., Atak, R., Cehreli, S., &
Yetkin, E. (2004). Documentation of slow coronary flow by the thrombolysis in myocardial infarction frame count in habitual smokers with angiographically normal coronary arteries. Heart And Vessels, 19(6), 271-274.
21
Friedman, M. (2007). Overview of antibacterial, antitoxin, antiviral, and antifungal activities of tea flavonoids and teas. Molecular nutrition & food research, 51(1), 116-134.
Giner Martinez-Sierra, J., Santamaria-Fernandez, R., Hearn, R., Marchante Gayon, J. M., &
Garcia Alonso, J. I. (2010). Development of a direct procedure for the measurement of sulfur isotope variability in beers by MC-ICP-MS. J Agric Food Chem, 58(7), 4043-4050.
Han, W. Y., Zhao, F. J., Shi, Y. Z., Ma, L. F., & Ruan, J. Y. (2006). Scale and causes of lead contamination in Chinese tea. Environmental Pollution, 139(1), 125-132.
Herwig, N., Stephan, K., Panne, U., Pritzkow, W., & Vogl, J. (2011). Multi-element screening in milk and feed by SF-ICP-MS. Food Chemistry, 124(3), 1223-1230.
Jung, Y., Lee, J., Kwon, J., Lee, K.-S., Ryu, D. H., & Hwang, G.-S. (2010). Discrimination of the geographical origin of beef by 1H NMR-based metabolomics. Journal of Agricultural And Food Chemistry, 58(19), 10458-10466.
Kamau, D., Spiertz, J., & Oenema, O. (2008). Carbon and nutrient stocks of tea plantations differing in age, genotype and plant population density. Plant And Soil, 307(1-2), 29-39.
Karak, T., & Bhagat, R. M. (2010). Trace elements in tea leaves, made tea and tea infusion: A review. Food Research International, 43(9), 2234-2252.
Kelly, S., Heaton, K., & Hoogewerff, J. (2005). Tracing the geographical origin of food: The application of multi-element and multi-isotope analysis. Trends In Food Science &
Technology, 16(12), 555-567.
Korenaga, T., Musashi, M., Nakashita, R., & Suzuki, Y. (2010). Statistical Analysis of Rice Samples for Compositions of Multiple Light Elements (H, C, N, and O) and Their Stable Isotopes. Analytical Sciences, 26(8), 873.
Kropf, U., Korošec, M., Bertoncelj, J., Ogrinc, N., Nečemer, M., Kump, P., & Golob, T. (2010).
Determination of the geographical origin of Slovenian black locust, lime and chestnut honey. Food Chemistry, 121(3), 839-846.
22
Kushad, M. M., Brown, A. F., Kurilich, A. C., Juvik, J. A., Klein, B. P., Wallig, M. A., & Jeffery, E.
H. (1999). Variation of Glucosinolates in Vegetable Crops of Brassica o leracea. Journal of Agricultural And Food Chemistry, 47(4), 1541-1548.
Le Gall, G., Colquhoun, I. J., & Defernez, M. (2004). Metabolite profiling using 1H NMR spectroscopy for quality assessment of green tea, Camellia sinensis (L.). Journal of Agricultural And Food Chemistry, 52(4), 692-700.
Llorent-Martínez, E. J., de Córdova, M. L. F., Ruiz-Medina, A., & Ortega-Barrales, P. (2012).
Analysis of 20 trace and minor elements in soy and dairy yogurts by ICP-MS.
Microchemical Journal, 102, 23-27.
Llorent-Martínez, E. J., Ortega-Barrales, P., Fernández-de Córdova, M. L., Domínguez-Vidal, A.,
& Ruiz-Medina, A. (2011). Investigation by ICP-MS of trace element levels in vegetable edible oils produced in Spain. Food Chemistry, 127(3), 1257-1262.
Nam, J.-M., Thaxton, C. S., & Mirkin, C. A. (2003). Nanoparticle-based bio-bar codes for the ultrasensitive detection of proteins. Science, 301(5641), 1884-1886.
Osorio, M. T., Moloney, A. P., Schmidt, O., & Monahan, F. J. (2011). Multielement Isotope Analysis of Bovine Muscle for Determination of International Geographical Origin of Meat. Journal of Agricultural And Food Chemistry, 59(7), 3285-3294.
Pilgrim, T. S., Watling, R. J., & Grice, K. (2010). Application of trace element and stable isotope signatures to determine the provenance of tea (Camellia sinensis) samples. Food Chemistry, 118(4), 921-926.
Reid, L. M., O'Donnell, C. P., & Downey, G. (2006). Recent technological advances for the determination of food authenticity. Trends In Food Science & Technology, 17(7), 344-353.
Rummel, S., Hoelzl, S., Horn, P., Rossmann, A., & Schlicht, C. (2010). The combination of stable isotope abundance ratios of H, C, N and S with 87Sr/86Sr for geographical origin assignment of orange juices. Food Chemistry, 118(4), 890-900.
23
Sae-Tan, S., Grove, K. A., & Lambert, J. D. (2011). Weight control and prevention of metabolic syndrome by green tea. Pharmacological Research, 64(2), 146-154.
Salomon, S., Jenne, V., & Hoenig, M. (2002). Practical aspects of routine trace element environmental analysis by inductively coupled plasma-Mass spectrometry. Talanta, 57(1), 157-168.
Shibuya, E. K., Sarkis, J. E. S., Negrini-Neto, O., & Martinelli, L. A. (2007). Carbon and nitrogen stable isotopes as indicative of geographical origin of marijuana samples seized in the city of São Paulo (Brazil). Forensic Science International, 167(1), 8-15.
Villaño, D., Lettieri-Barbato, D., Guadagni, F., Schmid, M., & Serafini, M. (2012). Effect of acute consumption of oolong tea on antioxidant parameters in healthy individuals. Food Chemistry, 132(4), 2102-2106.
Villagra, E., Santos, L. S., Vaz, B. G., Eberlin, M. N., & Felipe Laurie, V. (2012). Varietal discrimination of Chilean wines by direct injection mass spectrometry analysis combined with multivariate statistics. Food Chemistry, 131(2), 692-697.
Walczyk, T. (2001). The potential of inorganic mass spectrometry in mineral and trace element nutrition research. Fresenius J Anal Chem, 370(5), 444-453.
Wang, L.-F., Lee, J.-Y., Chung, J. O., Baik, J. H., So, S., & Park, S.-K. (2008). Discrimination of teas with different degrees of fermentation by SPME–GC analysis of the characteristic volatile flavour compounds. Food Chemistry, 109(1), 196-206.
24 CHAPTER 2
Stable isotope analysis of Chinese tea: a possible method for adulteration, geographic origin and tea type discrimination
ABSTRACT
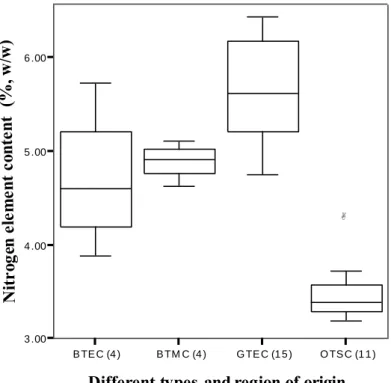
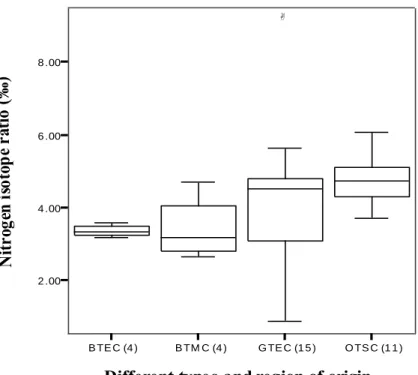
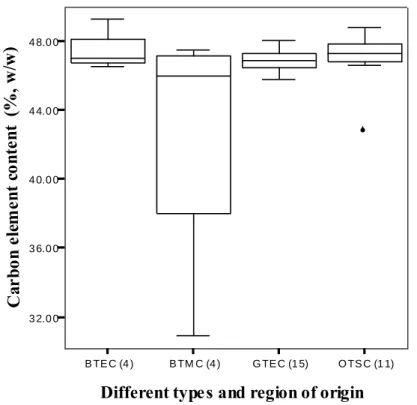
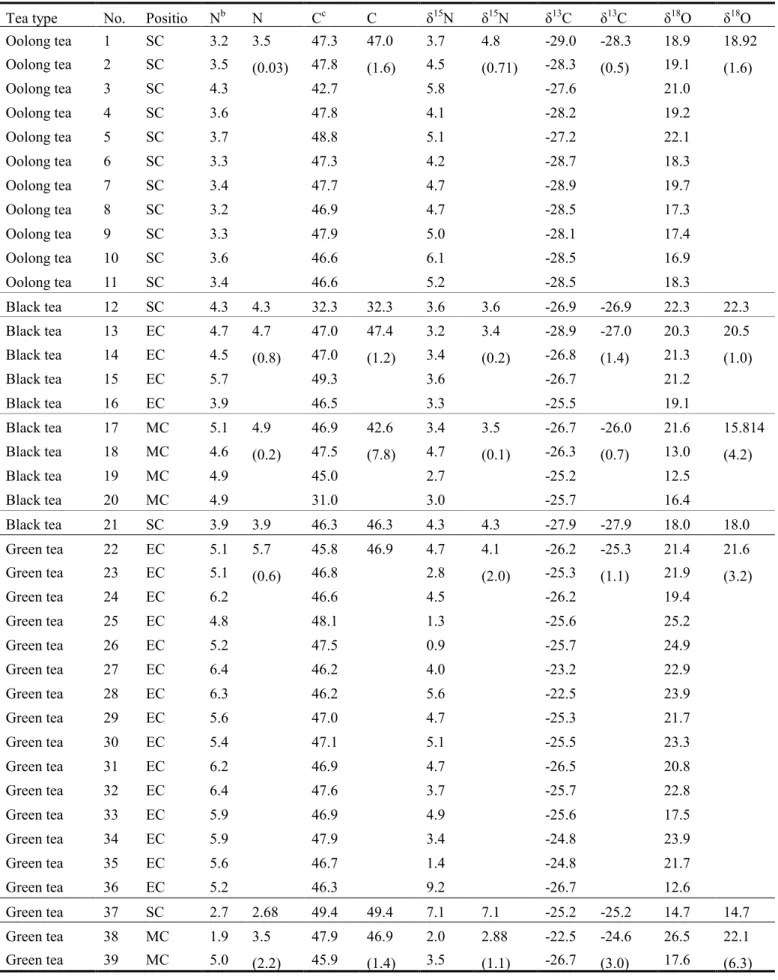
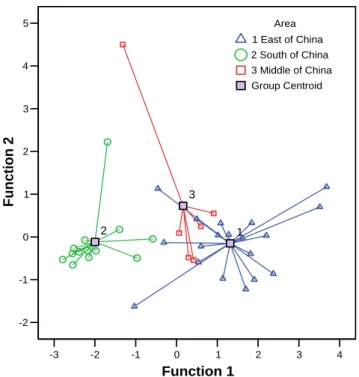
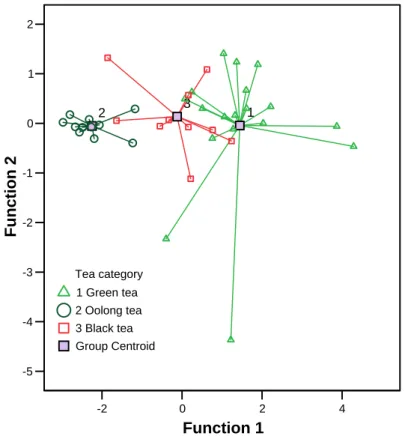
Thirty-nine tea samples from 10 different provinces comprising 3 large regions throughout Chinese tea producing areas were studied using isotope ratio mass spectrometry (IRMS) with an elemental analyzer (EA) to verify origins and to discriminate among the technical characteristics of the samples. Samples were divided into three groups based on the processing characteristics as follows: unfermented green teas, semi-fermented oolong teas, and fully fermented black teas. The R-squared values of the correlation coefficients of C and N in adulterated tea samples between the measured value and theoretical value were all above 0.93, which indicated that the degree of adulteration of tea can be determined quantitatively by EA-IRMS. Of the tea samples, 81.6% and 76.9% were correctly classified for the growing region and tea type respectively by using linear discriminant analysis of data obtained from light element compositions (C and N percentage) in combination with stable isotope data (δ15N, δ18O and δ13C), which had a high degree of confidence.
Significant composition differences existed in the elemental levels of C, N and O as well as in the isotopic ratios as a result of fermentation, geographic location and climate conditions.
25 2.1 INTRODUCTION
The importance of the food market and its globalization have resulted in an increasing concern about food origin and its producers, who are responsible for accurately offering origin labeled products to the consumer.
The objectives of this chapter were to establish a new and simple way to discriminate tea by origin and processing. We applied multi-element stable isotope analysis to distinguish the geographical origin and types of tea by measuring the oxygen, carbon and nitrogen stable isotope compositions of the teas. The variations of tea after being adulterated were detected through the C and N isotopic compositions.
The isotopic composition was assessed along with element composition characteristics to establish the method with which the geographical origin and types of tea can be reliably determined using multivariate statistical analysis. This method may be useful for both custom houses and tea companies if reliable and objective tea discrimination methods are developed.
2.2 EXPERIMETAL PROCEDURE
2.2.1 Collection of tea sample
2.2.1.1 Three main regions of Chinese tea producing areas
Based on the zoning of sustainable agricultural development in China (Xu, Hou, Lin, et al., 2006) and the Chinese agricultural zoning map made by the Chinese State Bureau of Surveying and Mapping, we divided Chinese tea producing areas into three regions as follows (Figure 2-1): 1, South of China (SC), including the Fujian, Hainan and Taiwan Provinces; 2, East of China (EC), including Middle-Lower Yangtze plains in the Jiangsu, Zhejiang, Anhui, Henan and Hunan Provinces; and 3, middle of
26
China (MC), including the Sichuan and Yunnan Provinces.
Figure 2-1 Map of TRACE tea sampling sites in China.
2.2.1.2 Chinese tea sample
A total of 39 samples of Chinese tea harvested in 2011 from 10 provinces (Table 2-1) were purchased from a special tea store. According to different process techniques, samples were divided into three groups as follows: unfermented green tea (15 samples) from East China; semi-fermented oolong tea (12 samples) from South China; and fully fermented black tea (9 samples) from East China (4 samples) and middle China (4 samples). Samples were wrapped individually and stored at room temperature (20 °C) before being crushed immediately prior to measurement, which is ideal for stable isotope ratio measurements.