Emission based on Behavior Zones: Evidence from Beijing,China.
著者 Gao Xiaolu, Ji Jue, Wang Fang journal or
publication title
International Review for Spatial Planning and Sustainable Development
volume 1
number 2
page range 3‑14
year 2013‑01‑01
URL http://hdl.handle.net/2297/34404
Copyright@SPSD Press from 2010, SPSD Press, Kanazawa
Spatial Pattern of Transportation Carbon Emission based on Behavior Zones: Evidence from Beijing, China
Xiaolu Gao
1*, Jue Ji
1,2, Fang Wang
1,21* Corressponding author: Key Laboratory of Regional Sustainable Development Modeling, Institute of Geographic Sciences and Natural Resources Research, Chinese Academy of Sciences, Beijing 100101, P R China, email: [email protected]
2 University of Chinese Academy of Sciences, China2
Key words: Low-carbon, traffic behavior, traffic mode, community, behavior zone
Abstract: Reducing daily transportation carbon emission is one of the main tasks for accomplishing low carbon city. Most existing studies have evaluated transportation carbon emission from industrial structure or micro-economic viewpoint, such as the efficiency of public transportation, work and home relationship, and modal choice of personal trips, but studies on the general impact of personal behaviors on transportation carbon emission is inadequate. A main reason of this relies on the lack of an appropriate spatial unit for integrating people’s greatly diversified behaviors. This study proposes the concept of
‘behavior zone’ (BZ) based on homogeneous assumption of behaviors, in order to analyze people’s traffic behavior and its carbon emission effect by sub-areas.
With a survey analysis of the characteristics of people’s daily trips in Beijing’s sample residential areas, the critical indices of BZ are identified including housing price, development intensity and population density, and access to public transportation. With these indices, Beijing is classified into five BZ types, where the modal choice behaviors of inhabitants are projected. Then the total environmental impact of daily trips is estimated based on carbon emission levels of various traffic modes. The results provide a plenty of implications for low carbon strategies such as intensity control by floor-area-ratios and household densities, and adjustment of public transportation services.
1. INTRODUCTION
As the result of demographic and economic agglomeration, cities become the centers of carbon emission. In general, industrial production, building construction, and transportation are three largest sectors that contribute to the carbon emission of cities. According to IPCC (2007), the emission by transportation accounts for 31% of the total greenhouse gas emission, and it has been growing in the past decades at a speed higher than any other sectors. Thus it is greatly important to reduce transportation carbon emission for the purpose of low carbon city.
In the past 10 years, most Chinese cities experienced the process of
quick motorization. In Beijing, for instance, the total amount of vehicles
increased from 1.69 million in 2001 to 4.76 million in 2010, with every 100
families holding 60 private cars. Along with income growth, the figures are
anticipated to increase further more. Although motorization has enabled a
higher degree of modal choice and increase people’s satisfaction, the
negative environmental impact is enormous. Zheng & Huo (2010) showed that in Beijing more than 50% of polluted particles came from burning fossil fuel for energy, especially that of motor exhaust. In 2009, the average one-way commuting time of Beijing’s residents is 45 minutes, which has increased by nearly 20% since 2005. Phenomenal over-congestion, traffic jam, out-based consumption, weak self-cleaning power of the environmental system, and heat island effect impose great challenges to the sustainable development of cities (Lin & Wang, 2012).
So far many studies have been conducted to raise planning and management solutions to the transportation emissions. The impact of spatial structure of cities, traffic modes, and the service level of public transportation are widely accepted as critical factors to be considered. The environmental impacts of transportation emissions have been evaluated by many at a regional or national scale to examine related planning issues. For example, Newman & Kenworthy (1989) compared the density of population and employment, mass public transportation, and road network of 84 countries in the world, and demonstrated the merit and demerit of compact urban forms by assessing the direct and indirect impact of these factors on carbon emission of cities.
Some other literature focused on the personal or household diversity of trips such as commuting distance, modal choice driven by different public policies and urban planning idioms (Buliung & Kanaroglou, 2006; Krizek, 2003; Ma et al., 2011; Zheng & Huo, 2010, Chai et al., 2011). These studies suggested a base for micro environmental and transportation policies by considering the diversity of people’s behavior and preference, which were more close to real world. Many of these studies had adopted sampling survey approach, and with the development of communication technologies and prevalence of mobile service, many incorporated mobile equipment (e.g., GPS or smart phones) to get the trip data of large population to model people’s traffic patterns (Ma, 2012; Martin, 2012). For example, Chai (2012) investigated the moves of respondents across time with questionnaire and GPS tracing facilities in typical residential areas of Beijing, and compared the behavioral patterns of residents in different kinds of communities.
However, restricted by sampling method and because of the barrier of user’s dependency on hardware, the results of case studies were often criticized concerning the representativeness of samples.
It is commonly agreed that the preference or behavior of people ought to be examined with specific geographical contexts. Because of the existence of uncertain geographic context problem, the way for defining the areal unit of geographic context may significantly affect the behavioral pattern to be analyzed (Kwan, 2012).
It is thusly essential to select an appropriate spatial scale for analyzing the characteristics of transportation activities in cities. According to the theory of social geography, people living in the same social environment tend to behave identically, and the spatial pattern of social areas yields from mutual interactions and competitions (Shevky & Williams, 1949). Shevky &
Bell (1955) proposed a method for classifying social areas, that is, to identify
the community types of each census unit according to the economic status of
residents, household attributes, and social segregation index (composition of
ethnic minorities). This classification method was adopted by many western
researchers. In Chinese cities, the accumulation of social groups in the form
of residential blocks or gate communities is quite evident. The social
polarization and competition of such social areas constitute the new spatial
structure of cities right now (Gu et al., 2003).
In this study, we assume that the traffic behavior of people living in certain kind of social areas share common traffic behaviors. Based on this assumption, the different patterns of people and households concerning transportations carbon emissions can be represented by appropriate classification of social areas. The emphasis of this study is to establish appropriate method for identifying the spatial pattern of different traffic behaviors. Taking Beijing as an example, we attempt to estimate the general environmental impact based on the transportation carbon emission levels of different areas.
2. METHOD FOR IDENTIFYING BEHAVIOR ZONE 2.1 Assumption on the Sphere of People’s Daily Behavior
We define the social area where people have similar social-economic attributes and behaviors as a ‘behavior zone’ (BZ). Subject to the constrain of space, it is highly possible that people in different BZs show different traffic patterns, which are revealed by the modal choice and scope of daily trips (Krizek,2003; Chai et al., 2011). On the other hand, the behaviors within the same BZ are identical, thus BZ can be regarded as homogeneous spatial unit.
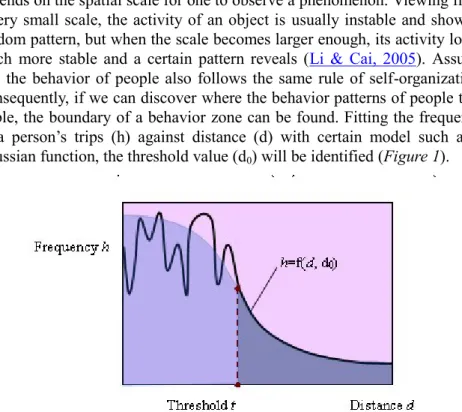
To identify the appropriate boundaries of BZ, we made a hypothesis on the stability of people’s traffic behaviors. The stability of any procedure depends on the spatial scale for one to observe a phenomenon. Viewing from a very small scale, the activity of an object is usually instable and shows a random pattern, but when the scale becomes larger enough, its activity looks much more stable and a certain pattern reveals (Li & Cai, 2005). Assume that the behavior of people also follows the same rule of self-organization.
Consequently, if we can discover where the behavior patterns of people turn stable, the boundary of a behavior zone can be found. Fitting the frequency of a person’s trips (h) against distance (d) with certain model such as a Gaussian function, the threshold value (d
0) will be identified (Figure 1).
Figure 1 Threshold distance for defining the range of behavior zone
2.2 Critical Factors and Rules for Defining BZ
Based on the afore-mentioned assumption, we designed an experiment
and conducted a survey to investigate the daily trips of residents in Yongtai residential area, which is outside the Northern 5
thRing Road of Beijing. The sample area covers approximately 2 km
2and have 19 gated residential blocks formed in different times. In and around the sample area, we selected 24 target places, including market places, supermarkets, convenience stores, shopping centers, parks, sports centers, museums and cinemas, and then investigated people’s familiarity with each place.
An interview was implemented in June 2010 toward 100 randomly selected residents. The respondents were asked to answer the frequency of their visits to the 24 predefined places, household attributes including income, age, education, income, work status, housing ownership, family structure and dwelling time in the study area. To ensure that the respondents were familiar with the general environment around their homes and that their perceptions were stable, people who dwelled in this area less than one year were removed. These were mostly young and single inhabitants in rental private houses, whose lifestyles were significantly different from other families. As a result, 94 valid samples remained.
The age and gender of the respondents well followed an average distribution, and about 40% of them had lived in this area for more than five years. 60% reported that they often went out around home and 40% spent most time in the study area at spare time.
It was found that the frequency to a target place is associated with the hierarchy of services provided by the place. Two of the 24 target places, a large vegetable market and a shopping center along main roads surrounding the study area, have significantly larger coverage than other places, thus they were excluded in the following analysis (Ji & Gao, 2012).
Based on the location data of sample points, distance and visiting frequency to target places, we conducted a spatial cluster analysis. As a result, two clusters were specified. After generating Voronoi polygons of the sample points belonging to different clusters, the study area was split into two parts (Figure 2). Then the irregular borders of each part were adjusted to adjacent main roads. This gave the border of two behavior zones.
We observed that the size of BZ is generally larger than single residential block. Adjacent areas with similar attributes and sharing common shopping and public transportation services are closely correlated and quite likely to form a behavior zone. Within BZ, there was no road broader than 30m. In this example, there were several closed work unit compounds (marked by grey polygons in Figure 2). Because the management system was totally different from normal residential areas, these special areas should be separately treated .
Figure 2 Cluster of behavior zones in Yongtai district in Beijing
Examining the characteristics of residential blocks in same clusters, we found that they are fairly alike in development time, housing price, development intensity (indicated by floor-to-area ratio, or FAR), and the level of property management fee. The attribute of access to public transportation services is also convergent, indicated by the number of bus stops within 800m and distance to nearest subway station (see Ji & Gao (2010) for reference). These results suggested the critical variables and rules for defining BZ (Table 1).
Table 1 Average statistics of residential blocks belonging to different behavior zones in Yongtai district
Type Building age (year)
Housing price (RMB/
m2)
FAR
Access to public transportation
Monthly management fee (RMB/m2) Bus stops within
800m
Subway stations within 1km
I 11 17,000 2.1 2.6 0 1.0
II 6 20,000 3.7 0.9 0 2.0
3. CLUSTER ANALYSIS OF BZ IN BEIJING 3.1 Data on Residential Blocks
We collected data of all residential blocks in Beijing, including location, development time, site area and floor-to-area ratio, and average list price of second hand houses, from the largest two real estate information websites, i.e., Anjuke (www.anjuke.com) and Sofang (www.sofang. com) in 2012. As a matter of fact, the two websites provide broad information service for developers, real estate agencies, and normal people in Beijing. Moreover, all the potential transaction information provided by users has been pooled and published in a regular format. Therefore, the quality of the data is good.
The records of all residential blocks listed on website pages were collected and the accuracy of information was cross-checked with data from two different websites. To focus on the built-up areas of Beijing, we removed residential blocks outside of the six central districts, which is about 1,370 km
2, having a population of 11.72 million (in 2011). As a result, 7086 residential blocks remained. Table 2 gives the basic statistics of sample blocks.
Table 2 Basic statistics of sample residential blocks in Beijing
Critical factors Indices Ave. Min Max
Housing price Average second-hand housing price in a block (RMB/m2)
30,365 2,711 63.230
Development intensity
FAR 2.9 0.2 30
Housing quality Property management fee per month (RMB/m2)
2.0 0 20
Building age (years) 13 1 63
Access to public transportation
Number of bus stops (<800m) 5.7 0 39
Number of subway stations (<1km) 1.5 0 10
3.2 Spatial differentiation of BZ
The following steps were followed to identify BZ in Beijing’s six central districts.
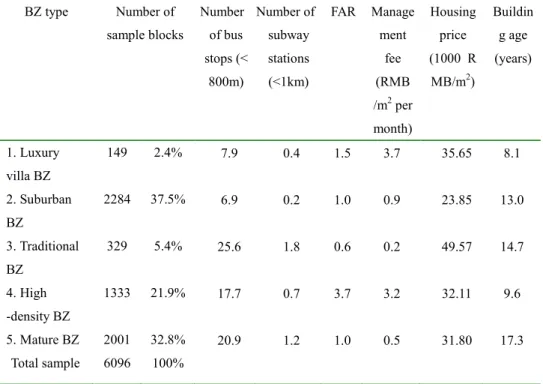
First, a cluster analysis was run with the above data. With the K-means cluster analysis method, we explored the similarity of different sample blocks. The between-cluster distance with regard to the number of clusters showed that the decline of between-cluster distance significantly slowed down as the whole sample was divided into six or more clusters. Therefore, we divided the sample into five clusters (Table 3).
Table 3 Statistics of residential blocks in five clusters
According to characteristics of each cluster, we named them as Luxury villa BZ (cluster 1), suburban BZ (cluster 2), traditional BZ (cluster 3), high-density BZ (cluster 4), and mature BZ (cluster 5). Among them, clusters 2, 4 and 5 are residential blocks of commercial houses, and they account for 37.5%, 21.9% and 32.8% of the sample, respectively. Cluster 1 covers most low-rise detached houses, and cluster 3 traditional courtyard houses.
The sample sites were mapped with their address information as a point layer with ArcGIS. Then, BZs were identified by the following steps. First, Voronoi polygons of the sample points were generated and the cluster attribute of the points were assigned to the Voronoi polygons. Second, adjacent Voronoi polygons with the same cluster attribute were merged. Then, the borders of the polygons were adjusted with the nearest main roads that were broader than 20m. Finally, non-residential sites identified through the land use map of Beijing were removed from the layer gotten from the last step, whereby the polygon layer of BZ was derived.
BZ type Number of sample blocks
Number of bus stops (<
800m)
Number of subway stations (<1km)
FAR Manage ment
fee (RMB /m2 per month)
Housing price (1000 R MB/m2)
Buildin g age (years)
1. Luxury villa BZ
149 2.4% 7.9 0.4 1.5 3.7 35.65 8.1
2. Suburban BZ
2284 37.5% 6.9 0.2 1.0 0.9 23.85 13.0
3. Traditional BZ
329 5.4% 25.6 1.8 0.6 0.2 49.57 14.7
4. High -density BZ
1333 21.9% 17.7 0.7 3.7 3.2 32.11 9.6
5. Mature BZ 2001 32.8% 20.9 1.2 1.0 0.5 31.80 17.3
Total sample 6096 100%
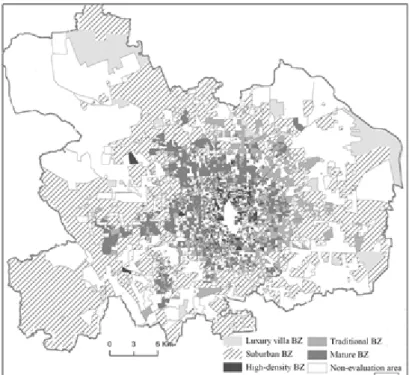
Besides the five BZ types in Table 3, some areas did not have complete data and some were under-construction residential projects or public housing projects where the houses were prohibited to enter market. Excluding them, there are 1076 BZs in total (
Figure 4).
Figure 4 Distribution of different BZ types in Beijing
4. BZ-BASED ESTIMATION OF TRANSPORTATION CARBON EMISSION
4.1 Traffic Behavior of People in Different Types of BZ
In order to estimate general transportation carbon emission, previous knowledge on the traffic behavior of people, especially on modal choice and trip distance, is necessary. For this purpose we have incorporated the data and result of existing studies.
Previous studies by Yanwei Chai’s research team have focused on the traffic behavior of people living in different communities (Ma et al., 2011).
In 2007, a trip diary survey was implemented in 10 typical residential blocks in Beijing. 3481 travel activities of 1120 persons in a weekday were recorded. On average, the investigated people travel 3.1 times a day. The above data were used for obtaining the dominant traffic mode and travel distance of people on weekday.
People’s traffic mode data from a questionnaire survey toward Beijing’s 6000 residents in Beijing, conducted by Wenzhong Zhang’s group in 2009, were also used (Chen et al., 2012). As this dataset is more up-to-date and based on a larger sample, we used them for adjusting the rate of different travel modes obtained from Chai’s survey (Table 4).
The result revealed that, the modal choice of people significantly
differed across BZ. For 35% of Beijing’s residents, bus is the main choice
for daily travel. The probability of taking bus is especially high among inner
city inhabitants in traditional courtyard housing areas (47%). The residents
of luxury villa BZ rarely take buses. Instead, 80% use private cars. It is
noticeable that suburban BZ residents use cars much more often than inner city inhabitants.
Table 4 Traffic modes in different BZs (%)
Mode Luxury
villa BZ
Suburban BZ
Traditional BZ
High -density BZ
Mature BZ All
Walking 3.0 11.7 7.8 12.1 16.6 13
Bicycle 1.0 9.7 30.2 21.0 21.5 17
Motor bicycle 0.0 2.2 5.9 3.1 0.6 2
Subway 10.0 16.8 4.0 10.2 9.4 12
Auto 80.0 29.3 5.1 15.4 10.8 20
Bus 5.0 30.3 47.0 38.3 38.2 35
Other (taxi) 1.0 0.0 0.0 0.0 3.0 1
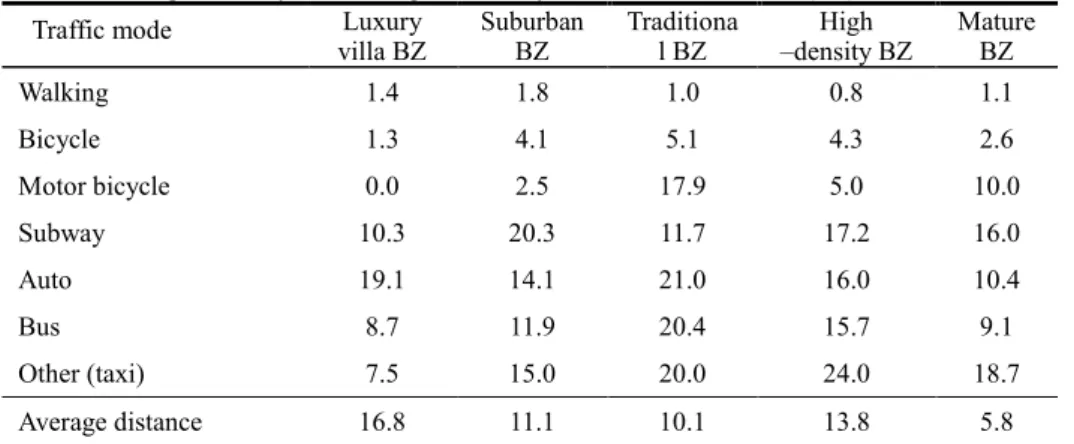
The trip diary survey of Chai’s group in 2007 mentioned above was used for estimating the average commuting distance of people. As Table 5 shows, commuting distance significantly differed across BZ. For example, in mature zone and traditional zone, people's average commuting distances by bicycle are 2.6 km and 5.1 km, respectively.
Table 5 Average one-way commuting distance by different traffic modes (km)
Traffic mode Luxury
villa BZ Suburban
BZ Traditiona
l BZ High
–density BZ Mature BZ
Walking 1.4 1.8 1.0 0.8 1.1
Bicycle 1.3 4.1 5.1 4.3 2.6
Motor bicycle 0.0 2.5 17.9 5.0 10.0
Subway 10.3 20.3 11.7 17.2 16.0
Auto 19.1 14.1 21.0 16.0 10.4
Bus 8.7 11.9 20.4 15.7 9.1
Other (taxi) 7.5 15.0 20.0 24.0 18.7
Average distance 16.8 11.1 10.1 13.8 5.8
4.2 Carbon Emission Parameters of BZ
IPCC (2006) presented carbon estimation methods based on energy use, measured by the emission from traveling by one kilometer per capita, and the estimation results varied across traffic modes and technologies in different countries. In Chinese cities, automobile, bus, subway and train, and motor vehicle are most important traffic modes. Based on survey and experiment, Ni (2009) and Chai et al. (2011) calculated carbon emission parameters for each traffic mode (Table 6).
Table 6 Carbon emission parameters for each traffic mode
Traffic mode Intensity of carbon emission
( per capita g/km)
Auto ( incl. car, taxi) 135
Bus (incl. commuting bus provided by work unit) 35
Subway, train 9.1
Motor bicycle 8.0
Others ( Walking, bicycle) 0.0
With parameters in Table 6 and the proportion of different traffic modes in each BZ given in Table 4, the carbon emission parameters of BZ was calculated:
(1)
where, S
jis carbon emission parameters (g per km/person), γ
ijis ratio of the i-th (for i=1 to 5) traffic mode in the j-th kind of BZ (refer to Table 4 ). η
iis the standard carbon emission of the i-th traffic mode in Table 6.
As a result, the intensity of carbon emission in different BZ was revealed (Table 7). The per capital carbon emission of luxury villa BZ was the highest, when the commuting distance increases every 1 kilometer the carbon emission reaches to 110.7g. And the traditional zones seem produce least carbon emission, which is only about 24.2 g per km/person.
Table 7 Carbon emission parameters of each BZ
4.3 Spatial Pattern of the Transportation Carbon Emission in Residential Areas
With the carbon emission parameters obtained in section 4.2, personal daily carbon emission intensity, C
j, was calculated:
(2)
where, i, j are indicators of traffic mode and BZ type, respectively; γ
ijis the rate of traffic mode i in the j-th BZ type (given in Table 4); η
iis carbon emission parameters of mode i which is given in Table 6, β
ijis the average commuting distance of people who take the i-th mode in the j-th BZ type which is given in Table 5; R
jis the rate of working people in the j-th BZ type, and T
jis people’s average commuting frequency per day in the j-th BZ. The values of R
jand T
jare given by Table 8, which are also estimated with Chai group’s survey data in 2007.
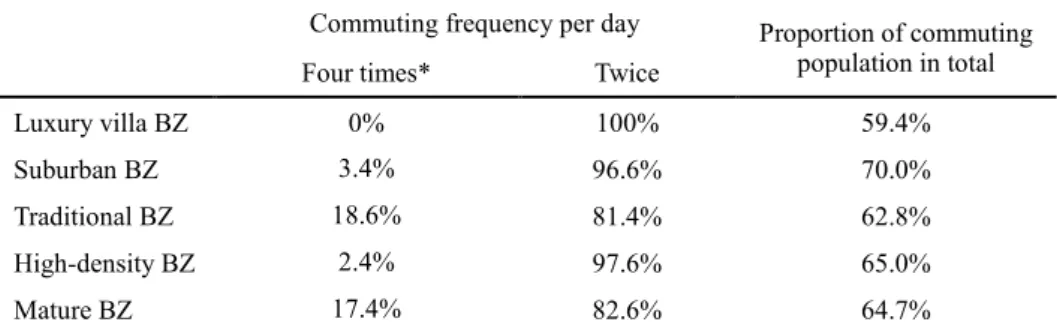
Table 8 Commuting frequency and commuting population in different BZs in Beijing
Commuting frequency per day Proportion of commuting population in total
Four times* Twice
Luxury villa BZ 0% 100% 59.4%
Suburban BZ 3.4% 96.6% 70.0%
Traditional BZ 18.6% 81.4% 62.8%
High-density BZ 2.4% 97.6% 65.0%
Mature BZ 17.4% 82.6% 64.7%
* People getting used to going back home at noon time are assumed to commute four times a day.
BZ types Intensity of carbon emission
( per capita g/km)
Luxury villa BZ 110.7
Suburban BZ 51.8
Traditional BZ 24.2
High-density BZ 35.4
Mature BZ 28.9
j n
i ij
j R T
C
j i i 1
i 1
n
i ij
Sj
Based on the results, the spatial pattern of personal transportation carbon emission intensity was identified. For simplicity, it was classified to five levels split by 1 standard deviation, i.e., relatively low, so-so high, and extremely high. Figure 5 revealed that in Beijing, carbon emission intensity significantly increased from central to suburban areas. Most areas outside or around the 5
thRing road belong to the high and extremely high levels.
Clearly, travel distance and traffic mode closely relate to carbon emission intensity. Therefore, in order to reduce the carbon emissions of high and extremely high zones, certain kind of planning regulations and behavior induction methods should be applied such as land use adjustment, floor-area-ratios and household densities control, as well as the supply of public transportation facilities to attract more people to use low-carbon traffic modes.
Figure 5 Spatial pattern of Transportation Carbon Emission Intensity (per capita per workday)
5. CONCLUSIONS
This study proposed the concept of ‘behavior zone’ (BZ) as the basic spatial unit for summarizing people’s greatly diversified behaviors. Based on a homogeneity assumption about people’s travel behavior, method for determining BZ was presented and the carbon emission effect of different urban areas were estimated.
The application of BZ provides a new perspective for understanding, analyzing and managing the integral geographical texture of urban areas.
Empirical study on Beijing’s residential blocks revealed that housing price,
property right type, and management fee of individual blocks could be
employed to identify the boundaries of BZ and that residential areas could be
divided into five BZ types including luxury villa areas, suburban zone,
traditional zone, high-density zone, and mature zone. These generalized rules
for defining BZ are useful in most other cities.
Compared to existing estimation methods based on individual behaviors, the application of BZ has a variety of merits. It helps solve the problem of uncertain geographic context. While individual behaviors commonly exhibit a high degree of uncertainties, BZ can screen out the noise but retain the useful information about urban context. This is quite useful for analyzing the spatial differentiation of urban space and its structure. Moreover, BZ provides a better linkage to area-based spatial policies. As shown in Section 4, with BZ as the basic spatial unit, the transportation carbon emission effects of people’s daily commuting activities in each part of the city have been clarified. By studying the intensity (amount) of carbon emissions in various scenarios, evaluating the effect of certain spatial policies, such as public transportation, land use planning, and population relocation, becomes possible.
Limited by available data, the current work is still preliminary. For instance, we only considered residential blocks with market price of houses, but public housing blocks and areas of other land use types were neglected;
Due to lack of detailed population data of residential blocks, the total amount of transportation carbon emission was not calculated, even though it should be more meaningful in practice; To facilitate the estimation, many simplified assumptions were also made, such as identical commuting distance and frequency in the same type of BZ. In the future, the current methods should be further improved based on systematic survey on people’s travel behaviors.
REFERENCES
Buliung, N.R. and Kanaroglou, S.P. (2006). “Urban form and household activity-travel behavior”, Growth and Change, 37(2), 172 -199.
Chai, Y.W. (2012). “Space-time behavior analysis and application demonstration of smart travel”, Paper presented on the 7th Workshop on Spatial Behavior and Planning Research, Beijing.
Chai, Y.W., Xiao, Z.P., et al. (2011). “Comparative analysis on CO2 emission per household in daily travel based on spatial behavior constraints”, Scientia Geographica Sinica, 31(7), 843-849. [In Chinese]
Chen, L., Zhang, W.Z., et al. (2012). “The spatial distribution, transition and residential pattern of low-income residents in Beijing”, Geographical Research, 31(4), 720-732. [In Chinese]
Gu, C.L., Wang, F.H., et al. (2003). “Study on urban social areas in Beijing”, Acta Geographic Sinica, 58(6), 917-926. [In Chinese]
IPCC. (2007). Summary for Policymakers of Climate Change 2007: The Physical Science Basis. Contribution of Working Group I to the Fourth Assessment Report of the Intergovernmental Panel on Climate Change, Cambridge University Press, Cambridge.
IPCC national greenhouse gas inventories programme, 2006. (2006). IPCC Guidelines for national greenhouse gas inventories. http://www.ipcc-nggip.iges.or.jp/public/2006gl/
vol2.html, retrieved on Dec. 11, 2012.
Ji, J. and Gao, X.L. (2010). “Analysis of People’s Satisfaction with public transportation in Beijing”, Habitat International, 34(4), 464-470.
Ji, J, Gao X L. (2012). “Identifying the scope of daily life in urban areas based on residents’
travel behaviors”, Scientia Geographica Sinica, (2), 248-254. [In Chinese]
Krizek, J.K. (2003). “Residential relocation and changes in urban travel: Does neighborhood-scale urban form matter?”, Journal of the American Planning Association, 69(3), 265-281.
Kwan, M.P. (2012). “Human space-time behavior as the basis of dynamic conceptualizations of geographic context”, Paper presented on the 7th Workshop on Spatial Behavior and Planning Research, Beijing.
Li, S.C. and Cai, Y.L. (2005). “Some scale issues of geography”, Geographic Research, (1), 11-18.
Lin, J.B. (2012). “Urban Disease: An Institutional Study on China's "Urban Disease"”, Beijing: Urban Planning Forum, (3), 16-22. [In Chinese]
Ma, J., Chai, Y.W., et al. (2011).“The mechanism of CO2 emissions from urban transport based on individuals’ travel behavior in Beijing”, Acta Geographic Sinica, 66(8), 1023-1032. [In Chinese]
Ma, X.J. (2012). “Spatio-temporal data collection and analysis platform: A big data perspective. Space-time behavior and smart travel”, Paper presented on the 7th Workshop on Spatial Behavior and Planning Research, Beijing.
Martin, D. (2012). “Studying pedestrians' behaviors and contextual experiences: A comparison of self- documentation platforms”, The 7th Workshop on Spatial Behavior and Planning Research, Beijing.
Newman, P.W.G. and Kenworthy, J.R. (1989). “Gasoline consumption and cities: A comparison of US cities with a global survey”, Journal of American Planning Association, 55, 24-37.
Ni, J. (2009). Public transportation change and responsibility to address climate change and energy savings. http://wenku.baidu.com/view/ad60fee79b89680203d825fc.html, retrieved on Dec. 11, 2012.
Shevky, E. and Bell, W. (1955). Social Area Analysis, Stanford University Press, Stanford, CA.
Shevky, E. and Williams, M. (1949). The Social Areas of Los Angeles, University of California Press, Los Angeles.
Zheng, S.Q. and Huo, Y. (2010). “Low carbon urban spatial structure:An analysis of private car traveling”, World Economic Forum, (6), 56-65. [In Chinese]