39
DOI: http://dx.doi.org/10.14246/irspsd.2.2_39 Copyright@SPSD Press from 2010, SPSD Press, Kanazawa
Earthquake Vulnerability Assessment in urban areas using MCDM
Case study: The central part of 6th district of Tehran Municipality
Abbas SHAYANNEJAD1 and Bahram ABEDINI ANGERABI2*
1 Master of Urbanand Regional Planning, Department of Architecture and Urban Planning.
Iran University of Science and Technology, Tehran, Iran
2 Department of Urban Planning, Azad Islamic University, Branch Robat Karim
* Corresponding Author: Email: [email protected] Received 11 September, 2013; Accepted 23 January 2014
Key words: Earthquake, Assessment, Vulnerability, Analytic Hierarchy Process (AHP), Fuzzy Logic, Tehran.
Abstract: The earthquake vulnerability is one of the main problems of Iranian cities. This problem is going to be considered because of neglecting updated techniques for vulnerability assessment. There are numerous analytical techniques, in which some of them are useful to reach the responsive solution in software aspects. It is assumed that using techniques such as Analytic Hierarchy Process (AHP) supplementary by Fuzzy Logic can be helpful in this regard. This research is going to experience this technique in a case study in the 6th district of Tehran municipality. AHP is used in order to achieve the importance factor for each criterion which involved in the earthquake vulnerability and the Fuzzy Logic is used to normalize them. At last the consequent vulnerability function due to the criteria has been acquired. As a result, the purposed vulnerability model and map can become a significant software tool for confronting crises resulting from future earthquakes incidences and reduce the probable damages and vulnerabilities.
1. INTRODUCTION
Many of cities are located in areas that are endangered by natural disasters, such as earthquake, flooding, cyclones/hurricanes, landslides, volcanic eruptions, subsidence etc. It is estimated that over 95 percent of all deaths caused by disasters occur in developing countries and losses due to natural disasters are 20 times greater (as percent of GDP) in developing countries than in industrial countries (Kreimer, et al., 2003). Two million people will die in earthquakes in the twenty-first century assuming no increase in the average annual rate of deaths from the twentieth century (Nicholas, 2005). While natural disasters cannot be avoided, there are ways to improve safety, minimize loss and injury, and increase public awareness of the risk involved. One of the most effective ways to lessen the impact of natural disasters on people and property is through risk assessment and mitigation (Tantala, et al., 2008). Earthquakes cause huge loss of lives and infrastructure every year in Iran. Many settlement areas (urban
& rural) as well as Tehran, the capital city of Iran are located in hazardous area (Sharifikia, 2011). The disastrous impact of earthquakes has been starkly illustrated in Bam-2003, Ardabil-1998, Ghaenat-1996, Manjil-1990, where thousands of people lost their lives (Sharifikia, 2007). Vulnerability is a new field and analytical tool in the study of urban safety. Analysis and assessment of vulnerability provide a new basis for urban planning (Chunliang, et al., 2011).
Earthquake vulnerability can be assessed and predicted through scientific analysis of earthquake risk map, and thus damages can be decreased through prevention effort (Sharifikia, 2011). For a vulnerability assessment, the goal is obtain a detailed map of distribution of building damage expected for occurrence of a scenario earthquake (Fah, et al., 2001). AHP, as a multiple criteria decision making (MCDM) method, can be used to evaluate and access the vulnerability of earthquake. In the last 20 years, AHP has been used in almost all the applications related to multiple criteria decision-making (Vargas, 1990; Vaidya, 2006)
In this paper, an AHP-based model has been developed for assessing the probable earthquake vulnerability in the studied area, which is located in the central part of 6th district of Tehran municipality.
2. THEORETICAL BASIS OF ANALYTIC HIERARCHY PROCESS
The AHP is a method proposed by Saaty (Saaty, 1980, 2008b). AHP is a well known technique that decomposes a decision making problem into several levels in such a way that they form a hierarchy with unidirectional hierarchical relationship between levels. The AHP uses pair wise comparison to allocate weights to the elements of each level in model, measuring their relative importance by using Saaty’s 1 to 9 scales, and finally calculates global weights for assessment at the bottom level. The method also calculates a consistency ratio (CR) to verify the coherence of the judgments, which must be about 0.1 or less to be accepted. Mathematical foundations of AHP can be found in Saaty (1994,1996).
3. AHP-BASED METHODOLOGY FOR THE
EARTHQUAKE VULNERABILITY ASSESSMENT
This study represents a conceptual framework for assessing the potential earthquake consequences to estimate the scale and extent of damage and disruption that may result from potential earthquake in the studied area. This model uses AHP, Fuzzy Logic and Probability Function to estimate the probable vulnerability. AHP is used to calculate the importance ratio for each criterion. In continues, the criteria have been converted from classic state to the fuzzy and unscaled condition using the fuzzy logic and the linear threshold function.
Finally, the probability function of the vulnerability has been defined base on the criteria in the GIS environment and then the vulnerability values have been calculated for each parcel. A conceptual view of how the purposed model works is shown in the Figure1.
Earthquake Vulnerability Assessment
AHP Model construction
Land Base Constructional
Access Base Base
pair wise comparisons
Criteria Normalization
Fuzzy Logic
Represent Fuzzy values for each criterion on the map
Vulnerability Function Importance ratios
The resultant vulnerability Main criteria
Sub criteria Sub criteria Sub criteria
Consistency ratio caculation
Figure 1.Perposed conceptual framework for assessing the earthquake vulnerability
3.1 Selection criteria
In order to develop an AHP model, a thorough literature review and informal discussions with the officials of the municipality, academics and experts working in the field of earthquake vulnerability were carried out and appropriate criteria for assessment have been extracted and classified (Table1).
Table 1. Description of selection criteria
Row
Criteria Description and Explanation Reference Source
1 Land Use
Land use play a key role in earthquake vulnerability due to its occupy class and its relative dangerous. The vulnerable ratio is difference from one land use to the others.
For example, green spaces are less vulnerable than residential lands.
Sengezer
& Ercan, 2005;
Torabi, 2010
Tehran Municipality
2 Plot Area
Area has an inverse correlation with the earthquake vulnerability. Large lands are less vulnerable than small lands.
Abdollahi , 2004
NICO (National Iranian Cartography Organization)
3
Geomet ric Shape
The regular shapes have less vulnerability and vice versa.
Hamidi, 1992
NICO (National Iranian Cartography Organization)
4
Parcel location in the block
According to earthquakes damage statistics in Iran, It is believed that parcels which are located in the middle of block have less vulnerability and them which are located in the border, have more vulnerability. It is because of surrounding by other building and their structures that help these building to be more resistant.
Ahadzade h Roshti, 2010
NICO (National Iranian Cartography Organization)
5 Populati on
However, it has not a straight relationship to the damages, it is an important criterion
Fakhim, 2006
Tehran Municipality
Density in the causalities due to earthquake.
6
Type of Structur e
The Skeleton type of building has a drastic role in the damages. For example, wooden skeleton is more vulnerable than others type like metal and concrete floors.
Hatami Nejad et al, 2009
Tehran Municipality
7
Quality of Constru ction
It is distinguished that buildings with better quality (new technology in construction) have less vulnerability.
Ahadzade h Roshti, 2010
Tehran Municipality 8 Buildin
g Age
As the building age arises, the probability of its vulnerability goes up.
Hoseini, 2003
Tehran Municipality 9
Number of Stories
It has a straight relationship with the earthquake vulnerability. Tall building are more vulnerable than short ones.
Ahadzade h Roshti, 2010
Tehran Municipality
10 Occupy Ratio
When in a parcel the occupy ratio raises, it means that the open space in comparison to the mass space decreases and it can increase the vulnerability.
Hamidi, 1992
NICO (National Iranian Cartography Organization)
11 Density
It is the rate of construction in relation with plot area that is the multiple of numbers of stories and occupy ratio.
Habibi et al, 2007
Tehran Municipality
12 Road width
It is important for the access to safe places and rescue vehicles transportation.
Fakhim, 2006
NICO (National Iranian Cartography Organization)
13
Access to Open Spaces
Open spaces as safe places during the earthquake and after that has an important role in lowering the vulnerability and causalities.
Habib, 1992
Tehran Municipality
14
Access to Rescue Centers
Access to rescue centers and other emergency centers during and after earthquake has a significant role in reduction the fatalities.
Habibi et al, 2007
Tehran Municipality
15
Access to Fire Stations
As it is probable to accrue fire after the earthquake appropriate access to fire station is important.
Habibi et al,2007
Tehran Municipality
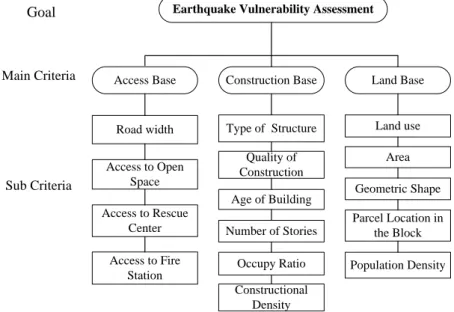
3.2 AHP model construction
The problem should be stated clearly and decomposed into a rational parts, like a hierarchical model. The AHP model in this paper consists of three levels.
The first level is decision problem of accessing the earthquake vulnerability. The second level is the criteria or the determinants upon which the assessment of vulnerability is broadly based. This level is divided into three major components: Land base, Constructional base and Access base criteria. The next level consists of the sub criteria that support the determinants (Figure 2).
Construction Base Land Base Access Base
Road width
Access to Fire Station Access to Rescue
Center Access to Open
Space
Occupy Ratio Number of Stories
Age of Building Quality of Construction
Population Density Parcel Location in
the Block Geometric Shape
Area Land use Type of Structure
Constructional Density
Earthquake Vulnerability Assessment Goal
Sub Criteria Main Criteria
Figure 2. AHP model
3.3 Pair wise comparison and local weights
A pair wise comparison is a numerical representation of the relationship between two elements that discerns which element is more important, according to a higher criterion. Saaty (1980, 1994) proposed a scale of 1–9, where 1 represents equal importance; that is, the two elements contribute equally to the objective, while 9 represents extreme importance that is favours one element (row component) over another (column component). If the element has a weaker impact than its comparison element, the score range varies from 1, indicating indifference, to 1/9, an over whelming dominance by a column element over the row element. For reverse comparison of the elements, the corresponding reciprocal value is assigned, so that the matrix “aij*aji” = 1.
Table 2. Saaty’s 1-9 scale for AHP preference Intensity
of importance
Definition Explanation
1 Equal importance Two activities contribute equally to the objective 3 Moderate importance Experience and judgment slightly favour one over
another
5 Strong importance Experience and judgment strongly favour one over another
7 Very strong
importance
Activity is strongly favoured and its dominance is demonstrated
in practice 9 Absolute importance
Importance of one over another affirmed on the highest
possible order
2, 4, 6, 8 Intermediate values Used to represent compromise between the priorities listed above
Reciprocal of above non-zero numbers
If activity i has one of the above non-zero numbers assigned to it when compared with activity j, then j has the reciprocal value when compared with i
(Saaty, 1996)
In the presented model there are about 4 pair wise matrices. In order to perform the pair wise comparisons, about 8 face to face interviews were held with the experts in earthquake and urban planning by making use a comprehensive questionnaire. As a result of these interviews and judgments, weights of the main criteria and subcriteria were determined using Expert choice
software (Version 9.48s25). After carrying out all the comparisons and determining the weights, consistency ratio of all the pair wise comparisons matrices and those of the judgments were calculated. The consistency measure is very useful for identifying possible errors in judgments. If the inconsistency ratios of all the pair wise comparisons matrices are less than 0.1, all comparisons matrices are consistent and judgments are reliable. In this study, the inconsistency ratios (CR) of all the comparisons matrices were less than 0.1 and so all of the judgments were accepted as reliable.
Table 3. Pair wise comparison of main criteria and their weights
CR=0 Table 4. Weights of the sub criteria
3.4 Final weights of criterions
Weights of subcriteria are local weights and they must be finalized to apply in assessment. For this, local weights of each subcriteria must be multiplied to weight of related upper level criteria (Eq .1).
*
fwij wi wij , fwij 1, i&j= 1,... ...,n Equation 1. Final weight
Where fwij = final weight of Cij (subcriteria), Wi= weight of Ci (main criteria).
Final weight of each evaluation factor was determined represented in the Table 5.
Table 5. Final importance ratios of each criterion
Criteria Value
Land Use 0.10875
Area 0.06467
Geometrical Shape 0.02378 Parcel location in the block 0.05481 Population density 0.03799 Type of the structure 0.31232
Age of building 0.0671
Quality of construction 0.05185 Number of stories 0.061
Occupy Ratio 0.03965
Density 0.07808
Road width 0.056
Open space 0.0158
Rescue center 0.0197
Fire Station 0.0085
Criteria Land Base Constructional Base Access Base Weights
Land Base 1 0.48 2.9 0.290
Constructional Base 2.1 1 6.2 0.610
Access Base 0.35 0.16 1 0.100
Criteria Subcriteria Weights
Land Base Land use 0.375 - -
Area 0.223 - -
Geometrical Shape 0.082 - -
Parcel location in the block 0.189 - -
Population density 0.131 - -
Constructional Base Type of the structure - 0.512 -
Age of building - 0.110 -
Quality of construction - 0.085 -
Number of stories - 0.1 -
Occupy Ratio - 0.065 -
Constructional density - 0.128 -
Access Base Road width - - 0.560
Access to Open Space - - 0.158
Access to Rescue Center - - 0.197
Access to Fire Station - - 0.085
3.5 The Criteria Normalization
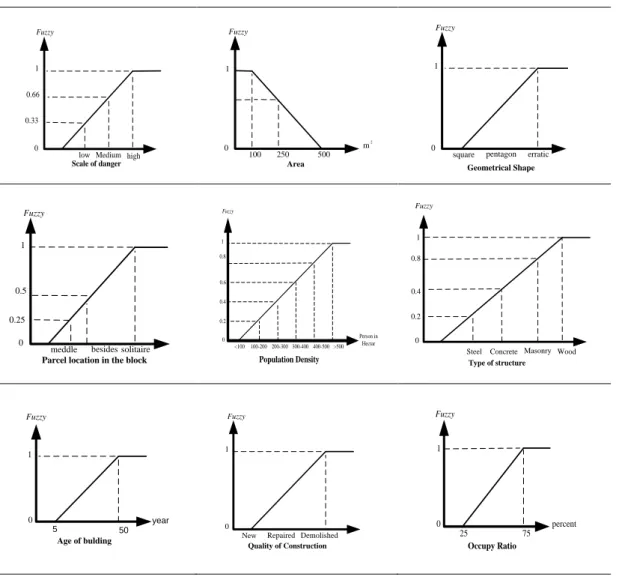
The criteria used in the present paper for the earthquake vulnerability assessment should be normalized. For this purpose the criteria have converted from classic state to the fuzzy and unscaled condition using the fuzzy logic and the linear threshold function. The fuzzy logic function is proposed by a professor LotfiZadeh. This function provides a space for reasoning, control and decision making in uncertainty situation (Habibi, et al. 2007)
fw { 0 if x a , (x x min) /x if a x b, 1 if bx } Equation 2. Fuzzy logic function
(Habibi, et al. 2007)
In this equation, f x( ) is fuzzy function, x is the criterion, a and b are the minimum and maximum acceptable value for the specific criteria and x is the difference between a and b. By using the proposal of experts in earthquake and according to the mentioned function, the fuzzy functions for all the criteria have been achieved. Due to brevity, in this section the graphs which show the functions for each criterion are shown in Table 6.
Table 6. Fuzzy functions for the criteria
0 1
Scale of danger 0.33
0.66 Fuzzy
low Medium high 0
1 Fuzzy
100 250 500
m2 Area
0 1 Fuzzy
Geometrical Shape square pentagon erratic
0 1
Fuzzy
meddle besides solitaire Parcel location in the block 0.5
0.25
Person in Hectar 0
1
<100 100-200
Population Density
0.4
0.2
200-300 300-400 >500 0.8
Fuzzy
400-500 0.6
0 1
0.4
0.2 0.8 Fuzzy
Steel Concrete Masonry Wood Type of structure
Age of bulding 0
1 Fuzzy
50 year
5 0
1 Fuzzy
Demolished New Repaired
Quality of Construction Occupy Ratio
0 1 Fuzzy
75 percent 25
4. DATA ANALYSIS IN THE CASE STUDY
The studied area is located in the central part of the 6th district of Tehran municipality. This area is determinate by Shohadae Gomnan highway in the north and west, the Fatemi Boulevard in the west and the Kargar Boulevard in the south. Its area is 95 hectares and has about 2080 inhabitants (Iran statistical Center, 2006).
Figure 2. Location of the study area
This section surveys the mentioned criteria for earthquake vulnerability assessment in the study area (see Table 1). According to the obtained fuzzy functions in previous section, for each parcel a numerical fuzzy value is acquired. The results of surveys and fuzzy values can be illustrated in the mode of map, chart and graph. So 15 different data layers are produced which show the existent condition of a specific criterion in the studied area. To be concise, in
Number of stories 0
1 Fuzzy
5 N
1 0 percent
1
<50 50-100
Constructional Density
0.44
0.22
100-200200-300 400-500
0.89 Fuzzy
300-400 0.66
>500 0.1
0 Fuzzy
4 35
m 1
Road width
Access to Open Space 0
1 Fuzzy
50 3000
m
Access to Rescue Center 0
1 Fuzzy
50 3000
m
Access to Fire Station 0
1 Fuzzy
50 3000
m
this section 6 of these 15 maps are shown (Figure 4 to Figure 9).
Figure 3. Land use in the studied area
Figure 4. Plot areas in the studied area
Figure 5. Type of Structure in the studied area
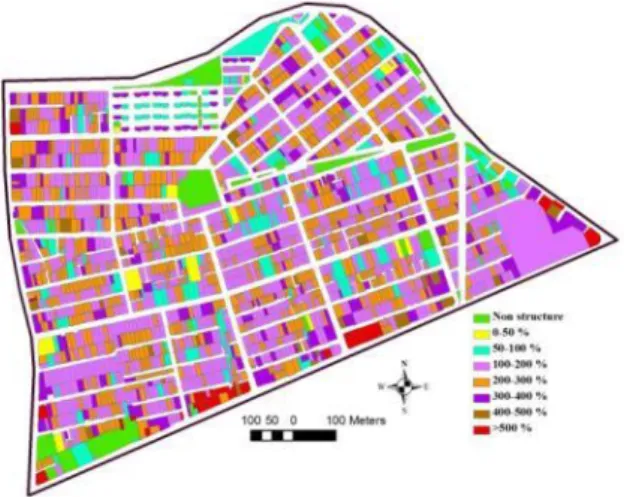
Figure 6. Constructional Density in the studied area
It should be noted that for criteria such as access to open spaces, rescue centers and fire stations, the Network Analyst tool in the GIS environment has been used. Its advantage in comparison to similar tools such as Buffer is measuring the real distance in relation to the existent roads, not the direct distance on the map.
Figure 7. Access to Open Spaces in the studied area
Figure 8. Access to Rescue Centers in the studied area
5. VULNERABILITY ASSESSMENT
The probability function has been used for the earthquake vulnerability assessment. The consequent vulnerability function due to the criteria has been defined. In this function the wi is the importance ratio for a specific criterion, which was calculated by the AHP model (see Table 5) and f x( ) is the fuzzy numerical value obtained for the each parcel from the criterion (see Table 6).
1
( ) * ( )
n
i
p w wi f x
Equation 3. Fuzzy numerical value function (vulnerability function) (Habibi, et al. 2007)
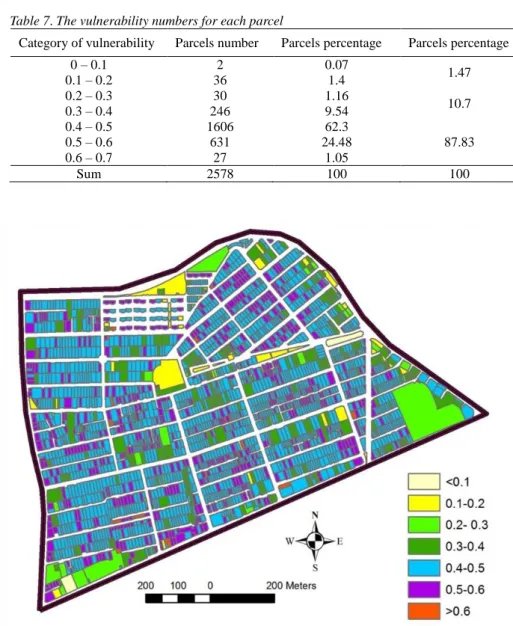
The vulnerability function represents a numerical value between 0 and 100 percent for each parcel which shows the consequent vulnerability of each parcel due to the criteria. The parcels with more vulnerability have greater scores. The vulnerability numbers in the studied area are between 0.1 and 0.7. As a parcel doesn’t obtain the minimum and maximum numerical fuzzy value for all the criteria, the consequent vulnerability doesn’t reach the 0 and 100 percent (Table 7 and Figure 10).
Table 7. The vulnerability numbers for each parcel
Category of vulnerability Parcels number Parcels percentage Parcels percentage
0 – 0.1 2 0.07
1.47
0.1 – 0.2 36 1.4
0.2 – 0.3 30 1.16
10.7
0.3 – 0.4 246 9.54
0.4 – 0.5 1606 62.3
87.83
0.5 – 0.6 631 24.48
0.6 – 0.7 27 1.05
Sum 2578 100 100
Figure 9. The consequent vulnerability in the studied area
6. CONCLUSIONS
In a real scenario, urban managers, planners and other experts in earthquake vulnerability assessment and mitigation require software tools that produce efficacious results, are easy to use and comprehend, and which require a moderate duration to arrive upon results. Therefore, in this paper an attempt has been made:
I. To develop a comprehensive methodology incorporates divers criteria involved in assessing the earthquake vulnerability.
II. To solve the problem of assessing the earthquake vulnerability in an urban area; in the paper, this problem is solved through the Analytic Hierarchy Process. AHP enables to break the problem up in a systematic and logical way which helps to handle the complexity of the problem.
III. To normalize the criteria and converting theme to an unscaled condition, by using the fuzzy logic and linear threshold function which allocated each parcel a specific numerical value for a criterion.
IV. To establish the vulnerability function and allocating each parcel a specific number which represents the consequent vulnerability due to criteria.
The produced earthquake vulnerability map provides sustainable information for developing the earthquake mitigation programs, the land planning design of future infrastructure, the planning of crises confrontation procedures, etc. Based on the information provided from the earthquake vulnerability map locations with more vulnerability are recognized. This map can provide information concerning the selection of proper location for construction of vital infrastructure during a crises situation. (e.g. a hospital, fire stations, etc).
The above mentioned examples and numerous other application of the vulnerability map’s information appoint their importance for the protection of the cities and build environments against earthquakes and justify the obligation of states, municipalities and others, who are responsible for making safe places in the neighbourhoods to provide theme for every city.
There were some limitations in this research that affected on research results.
Inaccuracy and being out of date maps were two limitations that caused the vulnerability map be not accurate. These limitations can be removed by providing up to date to achieve useful results. About the criteria that used in assessment procedure, it can be said that there are other criteria that can be used in this model. For example, geological criteria such as adjacency to faults, can be fitted to this model appropriately. By gathering these information, the result of assessment can be more accurate and useful. But the important output of this assessment, is using its result for reducing earthquake damages and deaths. The weights of criteria show that some criteria such as Land use, Type of structure and Density have more weights. By improving these criteria and control of constructional by regulation, the building damages can be reduced. For example, about the land use criterion, the municipality can provide regulation for control construction more effectively. So, providing vulnerability map is first step for reducing earthquake damages and deaths. The urban managers and urban policy making are responsible for the next steps.
REFERENCES
Abdollahi, M. (2004). Crisis Management in Urban Areas, Municipalities Organization. (in Persian).
AhadZadeh, M., et al, (2010). “Urban Building Vulnerability Assessment, Using AHP and GIS”, Geography and Development Magazine, 19. (in Persian).
Chunliang, X., Lin, V., Wei, S., and Wei, W. (2011). “Vulnerability of Large City and its Implication in Urban Planning: A Perspective of Intra Urban Structure”, Chin. Geogra.
Sci, 21(2), 204.
Fah, D., Kind, F., Lang, K., and Giardini, D. (2001). “Earthquake scenarios for the city of Basel”,Soil Dynamics and Earthquake Engineering, 21, 405-413.
Fakhim, N. (2006). “Providing SDD for Crisis Management”, M.S. Thesis , Shahid Beheshti University, Tehran. (in Persian).
Habibi, K., PourAhmad, A., Meshkini, A., Asgari, A.,and Nazari Adli, S. (2007). “Nomination Effective Structural Factors in Old texture Vulnerability of Zanjan city using GIS & Fuzzy Logic”, Fine Arts, 31, 27-36. (in Persian).
Habib, F. (1992). “Urban Form Role in Earthquake Vulnerability Reduction”, Tehran Observation and Planning Organization. (in Persian).
Hamidi, M. (1992). “The role of Urban Planning and Design in Reduction of Earthquake Damages”, Research Group of Seismology and Earthquake Engineering, Tehran.
HatamiNejad, H., et al. (2009). “Vulnerability Assessment in the City”, Human Geography Research, 68. (in Persian).
Hoseini, M. (2003). Challenges and Strategies in Crisis management, Tehran Crisis Management Organization, Tehran. (in Persian).
Kreimer, A., Arnold, M., and Carlin, A. (2003). The future of disaster risk, Disaster risk management series, No 3, The World bank.
Nicholas, J.M. (2005). “A major urban earthquake: paling for Armageddon”, Land use and Urban Planning, 73, 136-154.
Public Censures of Population and Housing. (2006). Iran Statistical Center.
Yu, R., and Tzeng, G.H. (2006). “A soft computing method for multi-criteria decision making with dependence and feedback”, Applied Mathematics and Computation, 180, 63-75.
Saaty, T.L. (1980). The Analytic Hierarchy Process, Mc Graw-Hill, New York.
Saaty, T.L. (1994). Fundamentals of Decision Making and Priority Theory with the AHP, RWS Publications, Pittsburgh.
Saaty, T.L. (1996). The Analytic Hierarchy Process: Planning, Priority Setting, Resource Allocation, RWS Publications, Pittsburgh.
Saaty, T.L. (2008a). “Decision making with the analytic hierarchy process”, Int. J. Service, Sciences, 1:83-98.
Saaty, T.L. (2008b). “Relative measurement and its generalization in decision making. Why pairwise comparisons are central in Mathematics for the measurement of intangible factors.
The analytic hierarchy/network process”, Revista de la Real Academia de Ciencias Exactas, Fisicasy Mathematics (RACSAM), 102 (2), 183-191.
Sarkis, J. (1998). “Theory and methodology evaluating environmentally conscious business practices”, European Journal of Operational Research, 107,159-174.
Sengezer, betul, and Koc Ercan. (2005). "A Critical analysis of earthquakes and urban planing in Turkey", Disasters, 29(2), 171-94.
Sharifikia, M. (2007). “RS & GIS application on Geo hazard: a case study in part of central Alborz”, PHD Thesis Submitted in Department of Geology University of Delhi.
Sharifikia, M. (2011). “Vulnerability Assessment And Earthquake Risk Mapping in part of North of Iran”, Journal of the Indian Society of Remote Sensing,38(4),708-716.
Tantala, M.W., Nordenson, G. J., Deodaties, G., and Jacob, K. (2008). “Earthquake loss estimation for New York City Metropolitan Region”, Solid Dynamics and Earthquake Engineering, 28,812-835.
Torabi, K. (2010). The role of transportation network on earthquake vulnerable effects reduction, M.S. thesis, Iran University of Science and Technology.
USAD. (2001). Making Cities Work: USAIDs urban strategy. An Initiative Launched by the Administrator and Prepared by the Urbanization Task Force.
Vaidya, O.S., and Kumar, S. (2006). “Analytic hierarchy process: An overview of applications”, European Journal of Operational Research, 169, 1-29.
Vargas, L. (1990). “An overview of analytic hierarchy process: Its applications”, European Journal of Operational Research, 48 (1), 2-8.