実践論文
選択実験におけるチェックボックス位置効果の再検証
ユーグレナ食品に関する大学生調査データを事例として
Reexamination of the Checkbox Positioning Effect in Choice Experiments - Evidence from a Survey of Japanese Undergraduates on Food Containing Euglena -
大床 太郎*1、玉宮 義之*2
Taro OHDOKO, Yoshiyuki Tamamiya
E-mail: [email protected]
キーワード:チェックボックス位置効果
;
選択実験;
一般化多項ロジットKeywords: checkbox positioning effect; choice experiment; a generalized multinomial logit model
環境の経済評価において選択実験が頻繁に用いられるようになった一方で,調査票設計に際して検 討すべき課題のひとつであろう,選択実験のチェックボックス位置効果を検証した研究が
Ohdoko and Tamamiya (2016)以外に存在しない.Ohdoko and Tamamiya (2016)は正規分布を仮定した混合ロジ
ットを用いているが,スケールパラメータの不均一性など,混合ロジットには限界のあることが報 告されつつある.分析手法のさらなる改善のために,Fiebig et al. (2010)では選好の多様性とスケール パラメータの不均一性を同時に分析できる一般化多項ロジットが開発された.そこで本研究は,Ohdoko and Tamamiya (2016)のデータを用いて,より柔軟な一般化多項ロジットで選択実験のチェッ
クボックス位置効果を検証した.分析の結果,点推定としては位置効果のないことが示された一方 で,パラメータの分布の検討からは,チェックボックスと価格属性を選択セットの上に置くことで,部分的な属性情報の非処理が生じると示唆された.
While choice experiment (CE) techniques are increasingly being used in many environmental valuation studies, there are a number of methodological issues to be resolved, such as ordering or positional effects. Although the design of CE questions includes decisions on the placing of checkboxes, with the exception of Ohdoko and Tamamiya (2016), the impact of the checkbox positioning effect on these techniques has not been examined.
Ohdoko and Tamamiya (2016) employed a simple random parameter or mixed logit (MIXL) model, which specifies the normal distribution as the mixing distribution. Problematically, recent CE studies have found that it is rather restrictive to assume a normal distribution for a MIXL model without scale heterogeneity. Fiebig et al. (2010) developed a generalized multinomial logit (GMNL) model to flexibly incorporate heterogeneities in both the marginal utility and scale parameters. We employ this approach to reexamine the checkbox positioning effect result in Ohdoko and Tamamiya (2016) using a more flexible GMNL model. While the model’s point estimates do not support the presence of the positioning effect as the mean point estimate, the distributions of the parameters indicate partial attribute nonattendance due to placing both the checkboxes at the top and price attributes at the bottom of the choice sets.
―――――――――
*1:
獨協大学経済学部, the corresponding author
.*2:
獨協大学法学部1. Introduction
While choice experiment (CE) techniques have increasingly been applied in environmental valuation studies, many methodological issues remain to be resolved, one of which is ordering or positional effects. The design of CE questions requires decisions on the placing of checkboxes. However, with the exception of Ohdoko and Tamamiya
(40), the effect of checkbox positioning on these techniques has not been considered. This is an important issue because eye movements and visual features can influence CE responses, which can lead to a design flaw in the survey instrument and bias the results. Indeed, it is increasingly common to combine CE with eye-tracking techniques to examine eye movements or eye fixation to better understand survey responses and behavioral features relating to CE (e.g. Meißner and Decker
(36)). Because checkbox positions can become a visual feature of CE questions and can influence the eye movements of respondents, it is important to investigate whether there are positioning effects.
Ohdoko and Tamamiya
(40)conducted a food CE and analyzed the checkbox positioning effect on CE questions for which the checkboxes were placed above or below the choice sets. Their results suggested that only the top-placed attribute is affected by nonattendance, and that the effect can be alleviated when the checkbox is placed below the choice set, with the price attribute also at the
1
The nine issues noted by Adamowicz et al. are concerned with: (1) how experimental design issues should be tackled; (2) how we should treat tastes or preference heterogeneity and
heterogeneity on the scale or inverted variance of the error component; (3) the choice format effects
bottom. Ohdoko and Tamamiya’s econometric analysis used a random parameter mixed logit (MIXL) model, employing the normal distribution as the mixing distribution, to ensure simplicity of the analytical procedures.
However, recent studies on CE have clarified that it is rather restrictive to assume a normal distribution and to employ a MIXL model without scale heterogeneity. Fiebig et al.
(16)developed a generalized multinomial logit (GMNL) model that incorporates heterogeneities in both the marginal utility parameters and a scale parameter, which is a more flexible approach than that used in the MIXL model, and one that can more precisely analyze the checkbox positioning effect.
Therefore, in this paper, we employ a GMNL model to reexamine the result of Ohdoko and Tamamiya
(40).
The remainder of the paper is organized as follows. Section 2 reviews the relevant literature. The dataset and the econometric methods employed are discussed in Section 3.
We present the results and discussion in Section 4. Concluding remarks, including topics for future research, are provided in Section 5.
2. Literature Review
Although CE techniques are being applied increasingly in many contexts, a number of methodological issues remain unresolved.
Adamowicz et al.
(1)summarized nine such
issues in environmental valuation studies
1. In
or effects on dimensionality and complexity, which
relate to the number of alternatives or attributes; (4)
how we treat decision rules and the information
processing strategy of respondents; (5) households
and groups, which relate to whether respondents
make their decisions jointly at an intrahousehold
this paper, we focus on the issues of preference and scale heterogeneity, and information processing, solely in relation to positional effects.
2.1. Preference and Scale Heterogeneity
Along with the growing use of CE techniques, increasing attention has been paid to the analysis of CE data. The traditional multinomial logit (MNL, McFadden
(35)) model assumed preference homogeneity and that preferences were independent of irrelevant alternatives (IIA), which corresponds to the identically and independently distributed error component. Following this, two alternative analytical models were frequently employed to incorporate preference heterogeneity and to overcome the need to assume the IIA property:
a random parameter logit model or MIXL, (Revelt and Train
(46), Train
(52), among others) and a latent class model (Boxall and Adamowicz
(6), Shonkwiler and Shaw
(51), Greene and Hensher
(19), among others). The former allows for a continuous distribution of preferences, whereas the latter allows for a discrete distribution.
However, there is an underlying issue that is inherent in the use of the random utility model (RUM), namely a scaling problem. A RUM assumes that the indirect utility function associated with alternatives of CE questions is U V X ε , where n 1, ⋯ , N denotes the respondents; j 1, ⋯ , J is the alternatives in the choice set; t 1, ⋯ , T is the choice occasion; X is the matrix of
level or individually; (6) incentive compatibility and strategic behavior; (7) property choice; (8) the
attributes of the alternatives; and ε is the error component. The observable component of indirect utility, V X , has been frequently specified in an additively separate form, β X , where β denotes the marginal utility vector, which we also utilized. However, it has been demonstrated that the “true” marginal utility vector, β , has been demonstrated to be confounded with the scale parameter, λ, which is inversely proportional to the variance of the error component, such that β βλ (Louviere et al.
(33)). For example, Louviere and Eagle
(31)demonstrated that the model should be developed to distinguish between preference heterogeneity and scale heterogeneity. A critical issue has been whether respondents’
heterogeneous features are included in their preferences, or scales, or both.
Fiebig et al.
(16)developed the GMNL model, after Keane
(23)first presented a relevant research program. Fiebig et al.
(16)incorporated two parameters in the discrete choice model so that preference heterogeneity and scale heterogeneity could be analyzed simultaneously. They demonstrated that the GMNL model was preferred in seven out of the 10 datasets that they analyzed. For the other three datasets, the preferred model was the scale heterogeneity multinomial logit (S-MNL) model, which is a subclass of the GMNL model and incorporates only scale heterogeneity with fixed preference parameters.
Currently, the GMNL model is being applied increasingly in choice modeling (CM), which includes CE, best–worst scaling (BWS) studies (Louviere et al.
(32)). Czajkowski et al.
particular requirements of recreation demand
models; and (9) spatial aspects.
(11)
applied a GMNL model to a CE study on forest ecosystem management in Poland, which demonstrated that the GMNL model had an enhanced fit compared with the MIXL model.
Li et al.
(29)applied a GMNL model to a CE study on purchases of refrigerators by consumers, where the CE question included a voluntary climate action program by the manufacturer as an attribute. They demonstrated that the GMNL model had an enhanced fit compared with the MNL and MIXL models. Doiron et al.
(13)applied a GMNL model to a BWS study on the job choices of student nurses and demonstrated that the GMNL model had an enhanced fit compared with the MNL and MIXL models.
Overall, the GMNL model has gradually become the standard discrete choice model to express respondents’ choices correctly and precisely.
2.2. Positional Effects
Because CE methods include social survey features, the question of ordering or positional effects, which are known to occur frequently in social survey instruments, is relevant. In CM research contexts, Chrzan
(9)suggested that there are three positional effects in CM: the choice set order, the order of profiles or alternatives within choice sets, and the attribute order within profiles. Chrzan recommended that profile and attribute orders should be rotated. Scott and Vick
(50)conducted a CE study in Scotland to elicit patients’ preferences regarding doctor–patient relationships, and suggested that the later in the survey that the attribute is provided, the more preferred it is by
respondents. Farrar and Ryan
(14)elicited hospital consultant preferences for potential clinical service developments in the UK using a CE, which employed CE questions without a certain price attribute, and found that there were no attribute order effects. Kjær et al.
(25)undertook a CM study on Danish patient preferences for psoriasis treatment, which suggested that respondents were more price sensitive when the price attribute was placed at the bottom of the choice set, which led to
“conservative” (that is, lower) willingness-to- pay estimates. Ohdoko and Yoshida
(41)found no attribute order effects on nonprice attributes for Japanese residents who were asked CE questions on the management of forest species diversity. In sum, it would seem that we do not have to be overly concerned about the attribute order effect, apart from that concerning the price attribute.
Although choice sets, profiles, and
attribute order effects have attracted attention in
various contexts, few studies have focused on
the checkbox positioning effect in CM/CE
questions. Ohdoko
(39)examined the impact of
the checkbox positioning effect in BWS studies
in Japan, and found that it existed when
estimating the coefficients of variation of item
importance. The results suggested that the
checkbox position should be rotated or
randomly assigned laterally in BWS questions
as much as possible. Ohdoko
(39)indicated that
the left-to-right Japanese horizontally writing
system influences BWS responses, citing Dobel
et al.
(12), who suggested that certain writing
systems influence positioning bias. As the
Japanese horizontally writing system is left to
right and lines are cumulated vertically in a top-
to-bottom direction, it is almost certain that Japanese readers are accustomed to moving their eyes from left to right and from top to bottom. Especially in the context of survey research in Japan, survey instruments frequently employ a lateral writing system and, therefore, the lateral writing system seems to influence CE questions. Ohdoko and Tamamiya
(40)
conducted a food CE and analyzed the checkbox positioning effect on the CE questions when they placed the checkboxes above or below the choice sets. The results suggested that there was only an effect on the top-placed attribute as the attribute experienced nonattendance due to placing the checkboxes at the top and the price attribute at the bottom of the choice sets. They suggested that there is a need for further research on the reason for the effect using eye trackers, latent class models, or stated ignorance by respondents to examine the relationship between checkbox positioning and respondents’ ignoring attributes. Alternatively, the checkboxes should be set below the choice sets along with the bottom-placed price attribute.
Many studies have examined the phenomenon of attribute nonattendance, where respondents only attend to some of the attributes in the CE choice set. This is one of the heuristics of processing information (Hensher et al.
(20); Colombo et al.
(10); Hess et al.
(21); Hole et al.
(22); Kehlbacher et al.
(24); Lagarde
(27); Balcombe et al.
(2); Glenk et al.
(18); Nguyen et al.
(38)). In addition, because it is common to place checkboxes for CM questions below the choice set (see the Appendix), eye movement or visual features can influence the CM response,
2
See e.g. Calvayrac et al.
(8).
which can lead to a certain design flaw in CM survey instruments. Indeed, it is increasingly common to combine CM with eye-tracking techniques to examine eye movement or eye fixation to better understand survey responses and behavioral features relating to CM (Meißner and Decker
(36); Orquin et al.
(42); Vidal et al.
(53); Behe et al.
(4); Bialkova et al.
(5); Balcombe et al.
(2); Rasch et al.
(45)). Because checkbox position can become a visual feature of CM questions and influence the eye movement of respondents, we should investigate whether there are positioning effects and, if so, how they operate.
3. Materials and Methods
The potential for human consumption of euglena and other microalgae is receiving increasing attention. Mata et al.
(34)reviewed the development and generation of biofuels from microalgae, and the product development of food containing euglena is increasingly being investigated in Japan (Redmond
(44)). Euglena contains many nutritional compounds, including paramylon
2, vitamins, and calcium.
As the labeling of functional food—food with special healthy qualities—has been permitted in Japan since April 2015, there is substantial potential to develop and diffuse euglena foods in the Japanese market.
Marketing research is essential in the development of brand-new food products.
Krystallis et al.
(26)suggested that a hypothetical
CE would be useful in predicting the latent
market structure or consumer preferences for
new food products and undertook such a study
in the Greek market, focusing on three children’s snacks enriched with nutritional compounds: savory puffs, chips, and croissants.
Larue et al.
(28)also conducted a CE survey on food with functional health benefits, along with genetically modified food production, and found that organic functional food would be profitable in Canada. To assess whether Japanese food consumers would accept new euglena foods, we employ a CE technique to elicit consumer preferences. This study also enables us to test for the existence of the checkbox positioning effect in CE. As a pilot study, we designed our survey using a sample of undergraduate students studying at Dokkyo University in Japan. To enable undergraduate respondents to easily understand our CE scenario, we employed the example of a hypothetical functional chewing gum that could potentially incorporate euglena.
We administered our survey at Dokkyo University from April 4 to 28, 2015. Before implementation, we conducted preliminary discussions with six undergraduates attending a seminar course given by Dr. Ohdoko on the design of the questionnaire and the selection of the attributes of CE questions; we then conducted a pretest session to improve the quality of the questionnaire using 14 other undergraduates on the seminar course. We conducted an in-person self-administered CE survey to elicit preferences for the attributes of the chewing gum, including type of nutritional content, recommendations from certain information sources, amount of nutritional content, and the price of the gum, which were
3
http://www.mhlw.go.jp/topics/bukyoku/iyaku/syok
the attributes that we assumed undergraduates would care about in selecting a chewing gum.
We then selected the levels of the attributes (Table 1). For nutritional content, we selected calcium, vitamins, and euglena. The levels of the first two were assumed to be familiar to Japanese undergraduates. For recommendations on the gum from certain information sources, we selected three levels to mimic the actual situation of undergraduates, these being information on the Web, including Internet news and blogs, information from their friends, and information from the tokuho label (short for tokutei hoken-you shokuhin or foods with special healthy qualities) certified by the Japanese Ministry of Health, Labor, and Welfare.
3For the amount of nutritional content and the price of the gum, we selected levels to mimic the actual situation in the Japanese market. Because the performance of a CE depends on respondents correctly interpreting the questionnaire, we simplified our questionnaire to make it as clear as possible.
We organized our questionnaire as follows. First, we collected demographic variables, including student sex, age, faculty, and department. Second, we provided information on euglena, including its definition, nutritional content, and health benefits. We then asked respondents whether they had heard about these before participating in our survey, and whether they understood our explanation.
Third, we provided our hypothetical scenario (see the Appendix) and eight CE questions, along with a sample answer. Finally, we determined attitudes regarding whether the
u-anzen/hokenkinou/hyouziseido-1.html (in
Japanese; retrieved September 30, 2015).
respondents were partial to buying new commodities and their “food-style” scale (Satomi et al.
(49)) as their lifestyle covariates with regard to food. In addition, we collected responses about whether they normally purchased at least some gum.
In creating the CE choice sets, we eliminated any possible correlation with the attributes in the experimental design methodology, primarily by using the main effects of a fractional factorial design along with the attributes and levels given in Table 1 to reduce the number of combinations below the maximum factorial 3
4= 81 (Lorenzen and Anderson
(30)). We created 16 profiles, and randomly selected two of these to create our choice sets. For simplicity, we fixed the attribute order as nutritional content, recommendations, amount of nutritional content, and price, from top to bottom.
Including an opt-out option made it possible to mimic real-world situations (Ryan and Skåtun
(47)
). Thus, we provided two alternatives and one opt-out option for each CE question, which represented eight choices per respondent in accordance with the incorporation of a “too close to call option”, as explained in Fenichel et al.
(15).
4We sampled as many undergraduates at Dokkyo University as possible using convenience sampling and campus street intercepts. We distributed our eight-item survey questionnaires to 200 undergraduates and obtained 168 effective responses (response rate 84%), incorporating 1,343 useful observations.
4
Because it is difficult to translate “too close to call” in Japanese, we used “I cannot choose between the two alternatives.”
5
To utilize every covariate of the respondents, we
To test the checkbox positioning effect, we created two split samples: those who were provided with CE questions in which the checkboxes were placed above the choice sets (sample A), and those for whom they were placed below the choice sets (sample B).
Figures 1 and 2 illustrate examples of the items in samples A and B, respectively. Table 2 shows the demographics of our sample, and Tables 3 and 4 show the respondents’ attitudes.
5Fiebig et al.
(16)first assumed the following random utility model in their GMNL model:
U V X ε βλ X
ε [Eq. 1],
where ε is the error component that depends on the Type I extreme value distribution; and λ π ⁄ 6σ is the scale parameter, which is inversely proportional to the variance of the error component, σ . Second, they extended the utility function to incorporate heterogeneities in both the marginal utility vector and the scale parameter, as follows:
U βλ γη 1 γ λ η X
ε [Eq. 2],
where η denotes the standard deviation of the marginal utility. The parameter γ is set to consider two GMNL models below. Then, the choice probability of the respondents becomes:
P j|X ; Β, Λ P U U , ∀k j
∬ ∏ exp β λ ′X /
∑ exp β λ ′X f β|Β f λ|Λ dβdλ [Eq. 3].
employed only fully completed responses. We
could not identify which respondents were sampled
using convenience sampling or campus street
intercepts.
Simulated maximum likelihood estimation is employed (Train
(52)).
Several logit models are nested within the GMNL model. When γ 1 , then β βλ η , which leads to GMNL-I, which assumes that the scale parameter affects only the mean marginal utilities. When γ 0, then β β η λ , which is GMNL-II and assumes that the scale parameter affects both the mean and the standard deviation of the marginal utilities. When η 0 ∀n , then β βλ , and the model has reduced to S- MNL, which assumes that the marginal utilities are identical between individuals, but that the scale parameter is distributed across individuals such that some preference uncertainty exists.
When the variance of λ equals zero, and the expectation of λ is set to unity, then, β β η , and the model reduces to MIXL, which assumes that only the marginal utilities are distributed across individuals. Finally, when η 0 and the variance of λ equals zero, then, β β, and the model reduces to MNL.
We employed R 3.2.5 (R Core Team
(43)) and the procedure “gmnl” (Sarrias and Daziano
(48)
) when estimating the GMNL model. We assumed that the distribution of η was normal, lognormal, uniform, or triangular. We decided to estimate the weighting parameter gamma directly, though Fiebig et al.
(16)also proposed an indirect estimation procedure. The covariates of individuals can be incorporated into not only the scale parameter, such that λ exp λ δ h τv
6, but also the observable component of the indirect utility as the cross terms with the attributes of
6
We employed truncated normal as the distribution of v , truncated at 2.
7
When the level of the qualitative variable is l
alternatives, such that h X . The parameter of these cross terms can be interpreted as the mean point estimate of the individual differences of the marginal utilities.
We analyzed the checkbox positioning using two procedures. First, we employed dummy variables that take a value of one if the respondent was provided with CE questions in which the checkboxes were placed below the choice sets; and zero otherwise. Then, we incorporated the dummy into both the cross term of the marginal utility and the covariates of the scale parameter, h . Second, because the dummy variable is a point estimate of the checkbox effect, it cannot capture the effect adequately. Therefore, we estimated individual parameters to capture the distributions of preferences (Train
(52); Fiebig et al.
(16)). As each distribution can differ, depending on each parameter, we adopted a Brunner–Munzel test (Brunner and Munzel
(7); Neubert and Brunner
(37)
). We adopted the procedure “lawstat”
(Gastwirth et al.
(17)) when conducting the Brunner–Munzel test.
We set alternative-specific constants (ASCs) for the leftmost and middle options in the choice set to test for alternative positional effects, following Chrzan
(9). As the rightmost option in the choice set denotes the opt-out option, this option is not preferred when every ASC is positively and significantly estimated.
We employed effects coding for the qualitative variable in our choice sets, in accordance with Louviere et al.
(33)and Bech and Gyrd-Hansen
(3)
.
7As the continuous assumptions of the
attributes “amount of nutritional content” and
1, 2, ⋯ , L, and the arbitrarily omitted level is L,
then the parameter of the omitted level, β , is
estimated by the negative sum of the parameters of
“price” are linear approximations of the effects of the attributes, and our main focal point is to examine the checkbox positioning effect more precisely, we treated every level of attribute as a qualitative variable. We decided to incorporate every mean marginal utility parameters of attributes in choice sets with
every ASC in the first place of our estimation procedure. Then, we employed the stepwise regression procedure with forward selection, judged by the Akaike information criterion (AIC), corrected AIC, and Bayesian information criterion.
Table 1: Attributes and levels of the CE
Attribute (unit) Levels
Type of nutritional content Calcium, vitamins, euglena
Recommended by Web, friends, tokuho labels
Amount of nutritional content (mg) 100, 200, 300
Price (JPY/pack) 90, 110, 130
M N L
Type of nutritional content Euglena Vitamins I cannot choose
between the two alternatives
Recommended by Web Friends
Amount of nutritional content (mg) 300 mg 200 mg
Price (JPY/pack) JPY 110 JPY 130
Fig. 1: Example of responses for sample A with checkbox positioned at the top.
M N L
Type of nutritional content Euglena Vitamins I cannot choose
between the two alternatives
Recommended by Web Friends
Amount of nutritional content (mg) 300 mg 200 mg
Price (JPY/pack) JPY 110 JPY 130
Fig. 2: Example of responses for sample B with checkbox positioned at the bottom.
the remaining levels: β ∑ β .
4. Results and Discussion
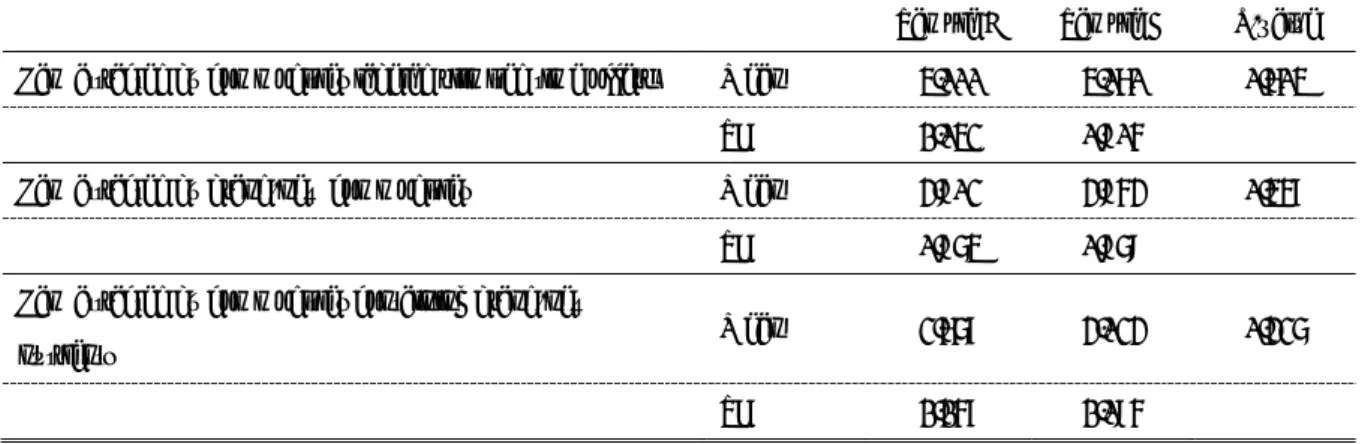
Before estimating the CE results and testing the checkbox positioning effect, we checked the homogeneities of the covariates between the split samples. First, we checked sample homogeneity within the demographics employing Fisher’s exact test (the fifth column in Table 2). We were unable to reject the null hypothesis and, therefore, we concluded that samples A and B are identical in terms of sample demographics at least at the 10% level of significance. Second, we checked for attitudes (the fifth column in Tables 3 and 4).
As with most of the items, sample homogeneity was not statistically rejected, except for the food- style scale item “I often enjoy a meal more when I am in a place with a good atmosphere.” Indeed, as the empirical distribution of the items appeared to be the same qualitatively, we assumed that all of the covariates were statistically identical across the subsamples.
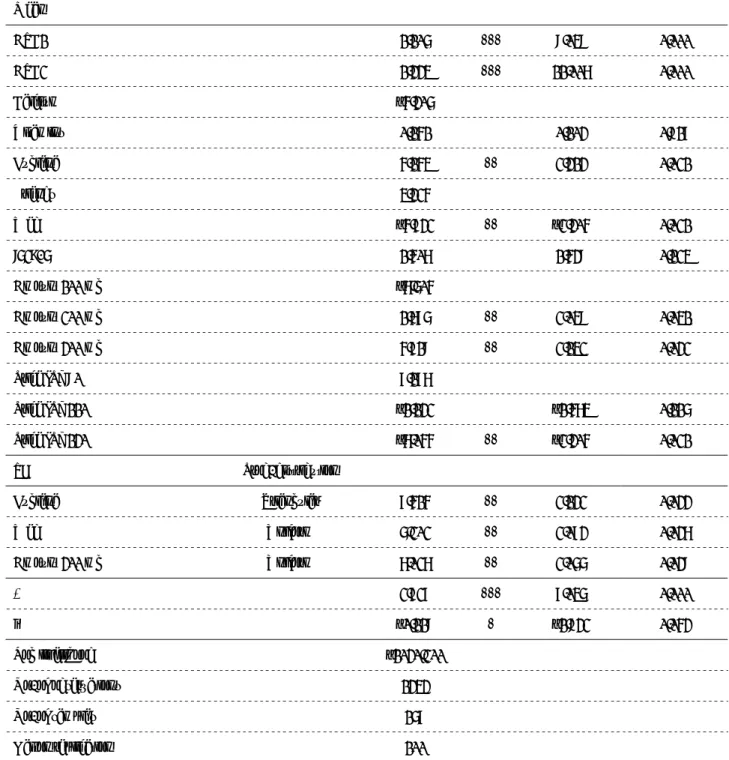
Both of the GMNL model results converged successfully. We provide our variable list in Table 5, and our estimated result in Table 6. First, we briefly interpret the ASC and scale parameters, τ and γ. We obtained positive and significant mean ASC. This indicates that our opt-out option is not preferable for respondents, and that we could capture the alternative position effects with ASCs. Then, we obtained significant standard deviation parameters in the choice set.
We obtain significant heterogeneous scale parameters.
The standard deviation parameters for euglena are labeling, Web, and Amount 300 mg.
The parameters for euglena suggest that it may reflects the attitudes in the food-style scale shown in Table 4, and/or the familiarity with euglena.
The parameters for Web indicate that there are certain heterogeneities in terms of preferences regarding information sources. The parameter for Amount 300 mg indicates heterogeneous preferences in terms of the amount of nutritional content, and/or reflects the attitudes of the food- style scale in Table 4.
Most of the mean parameters were
estimated as significant. For the attribute “Type
of nutritional content,” the estimated parameter
for euglena was significantly positive, which
reflects positive preferences for this brand-new
nutritional content. For the vitamin level, the
parameter was not significant and the parameter
for the level of calcium was negative ( 0
5.154 5.154 ). The respondents did not
want calcium to be included in chewing gum,
whereas they were indifferent about vitamins
being included. For the attribute “Recommended
by,” the level for Web was estimated as negative,
which indicates that respondents did not prefer to
obtain recommendations on food from Internet
news or blogs. This suggests that food marketing
should not rely on these sources to obtain
undergraduate student customers. When
attempting to attract students to purchase brand-
new food commodities, other Web channels, such
as private social networks should be utilized. As
for the level for tokuho labeling, the estimate was
not significant, suggesting that respondents are
indifferent about recommendations on food
content from the Japanese authorities. When
marketing brand-new food commodities to students, caution should be in diffusing tokuho labeling. Calculating the parameter for the level for “Friends” resulted in a positive value ( 5.832 0 5.832), which suggests that a personal recommendation from friends has a positive effect in attracting the undergraduate community to try brand-new commodities. The estimated parameters for the attribute “Amount”
were significant. The parameters Amount 200 mg and Amount 300 mg were significantly positive, with the size of the coefficient increasing as the amount increased. The parameter for Amount 100 mg had a significantly negative value, which implies that a greater amount of nutrition should be contained in the brand-new food product.
However, we could not compare the scientific information with the nutritional content intake in our survey instrument. Thus, as a policy implication, the relevant authorities should insist on food labeling that includes scientific information on the recommended daily values.
For the parameter of the attribute “Price,” the estimates for Price JPY130 were significantly negative, for Price JPY110 they were not significant, and for Price JPY90, they were calculated as positive ( 0 7.055 7.055). The changes in the size of the coefficient corresponded with increases in the price. Overall, the results for the parameters are compatible with sound intuition.
We find that there is no significant effect of the dummy variable set to sample B in the estimated result in Table 6. However, as noted above, the dummy variable is a point estimate of
the checkbox positioning effect. Therefore, we next estimated individual parameters to test more precisely whether the distribution of the parameters was affected by the checkbox positioning.
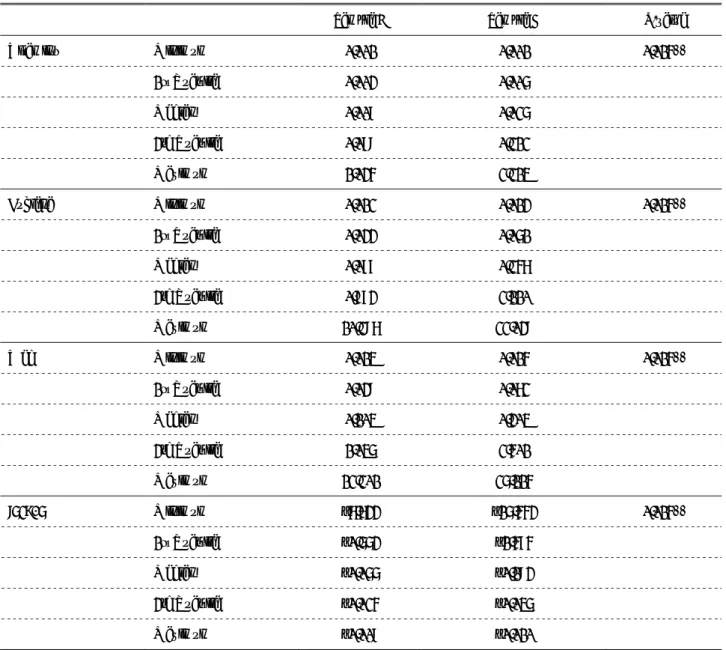
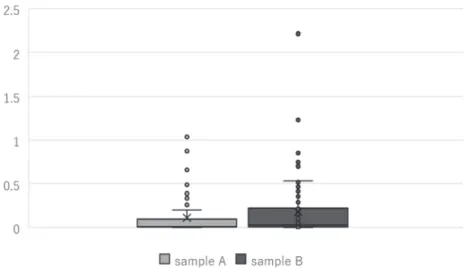
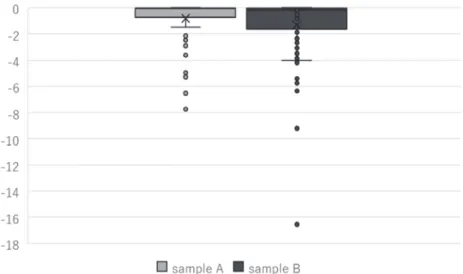
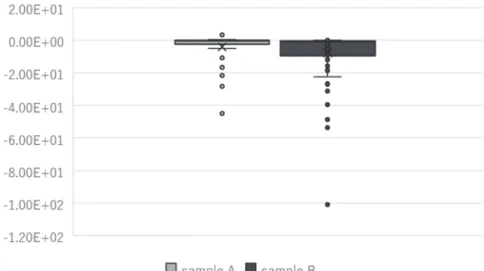
We show the results for the individual parameters in Table 7, and box plots of each parameter of Model 2 are shown in Figures 3–10.
For all parameters, hypotheses of the identical distribution between subsamples are statistically rejected. Then, every parameter of sample A (in which the checkboxes were placed above the CE questions) tends to shrink toward zero. This suggests that when the checkboxes of CE questions are placed above the questions, respondents tend to ignore part of the information provided on the CE questions. Thus, we should place the checkboxes for CE below the questions with the bottom-placed price attribute to ensure that respondents take in all the information provided on the CE questions.
5. Conclusion
We investigated the checkbox positioning effect
in CE by undertaking an undergraduate student
survey on a brand-new food commodity using
GMNL modeling. The results suggest that there
is a certain checkbox effect that relates to a lack
of attention being paid to the information
provided on the CE questions. We can alleviate
the attribute of nonattendance when the checkbox
is placed below the choice set, with the price
attribute on the bottom. However, we did not
investigate whether this issue occurs when the
checkbox is placed above the choice set with the price attribute on the top. In this case, we may observe a certain distance effect between the checkbox and the price attribute.
Attribute nonattendance for CM/CE is an important issue that requires addressing. To confirm the checkbox positioning effect on CM/CE, we should use such procedures to examine the relationship between the checkbox position and information processing by respondents. In particular, because the checkbox position is a geographical feature of the questionnaire, eye movements are likely to provide a good explanation of such positioning effects.
Acknowledgments
This research was supported by the Institute of Informatics at Dokkyo University, and a personal
research grant from Dokkyo University. The author
gratefully acknowledges the efforts in research design
and the collection of samples by Ryota Nakamura,
Shiori Noguchi, Naho Nikaido, Satoru Chiku, Sota
Takasaki, Misaki Shirai, and other colleagues at the
seminar of Dr. Ohdoko at the Faculty of Economics,
Dokkyo University. I am grateful to Professor
Takahiro Tsuge at Konan University and Associate
Professor Satoru Komatsu at Nagasaki University for
comments on the survey instruments. Thanks go to
Professor Andy Choi as chairperson of the 2016 Sixth
Congress of the East Asian Association of
Environmental and Resource Economics held at
Kyushu Sangyo University, and to the many
participants for their useful comments on our
preliminary results. Finally, many thanks to the survey
respondents for their cooperation in completing the
survey.
Table 2: Demographics
Item Subitem Sample A Sample B P-value
No. of samples 82 86
Sex Male 43 37 0.279
Female 39 49
Age (in years) 18 9 6 0.883
19 32 36
20 31 30
21 8 10
22 2 3
23 0 1
Mean 19.537 19.663
SD 0.905 0.978
Faculty Foreign Languages 32 31 0.632
International Liberal Arts 5 10
Economics 31 33
Law 14 12
About euglena
Had heard about it before participating Yes 9 11 0.814
in our survey No 73 75
Understood our explanation Yes 73 78 0.801
No 9 8
Normally purchased chewing gum Yes 36 32 0.433
No 46 54
Notes: SD, standard deviation. P-values were estimated using Fisher’s exact test.
Table 3: Attitudes (attracted to purchasing new products)
Sample A Sample B P-value I am attracted by commodities labeled “limited time offer” Mean 4.000 4.070 0.704
SD 1.042 0.905
I am attracted by brand-new commodities Mean 3.902 3.953 0.458
SD 0.964 0.969
I am attracted by commodities containing brand-new
nutrients Mean 2.768 3.023 0.326
SD 1.158 1.095
Table 4: Attitudes of food-style scale
Sample A Sample B P-value
It is enjoyable to have a meal with my friends Mean 4.610 4.593 0.783
SD 0.698 0.602
It is very important to have a meal together with other people
to create relationships Mean 4.610 4.512 0.639
SD 0.681 0.699
I often enjoy a meal more when I am in a place with a good
atmosphere Mean 4.524 4.419 0.035**
SD 0.933 0.774
I find it enjoyable to have a meal with many other people Mean 3.866 4.105 0.415
SD 1.141 0.946
I frequently have conversations when eating a meal Mean 3.732 3.895 0.760
SD 1.031 0.983
It is enjoyable to have a meal with my family members Mean 4.037 4.163 0.672
SD 0.999 0.866
I have meals regularly Mean 2.988 2.942 0.442
SD 1.171 1.141
I take nutritional balance into consideration Mean 3.012 2.814 0.323
SD 1.160 1.057
It is common for me to have a meal with my family members Mean 3.000 2.907 0.947
SD 1.370 1.360
I have meals to relax Mean 3.341 3.256 0.427
SD 1.317 1.140
In daily life, I look forward to having a meal Mean 3.598 3.709 0.680
SD 1.064 0.931
I frequently eat until I am full Mean 3.707 3.605 0.182
SD 1.036 0.961
I am particular about food safety Mean 3.378 3.581 0.761
SD 1.118 1.046
I care about a food’s expiration date Mean 3.561 3.698 0.583
SD 1.123 1.064
I like to have food that is said to be good for health Mean 3.171 3.291 0.440
SD 1.142 0.981
Note: SD, standard deviation. P-values were estimated using Fisher’s exact test. ** indicates significance at the 5% level. We
coded the responses as follows: 5 strongly agree, 4 agree, 3 neutral, 2 disagree, 1 strongly disagree.
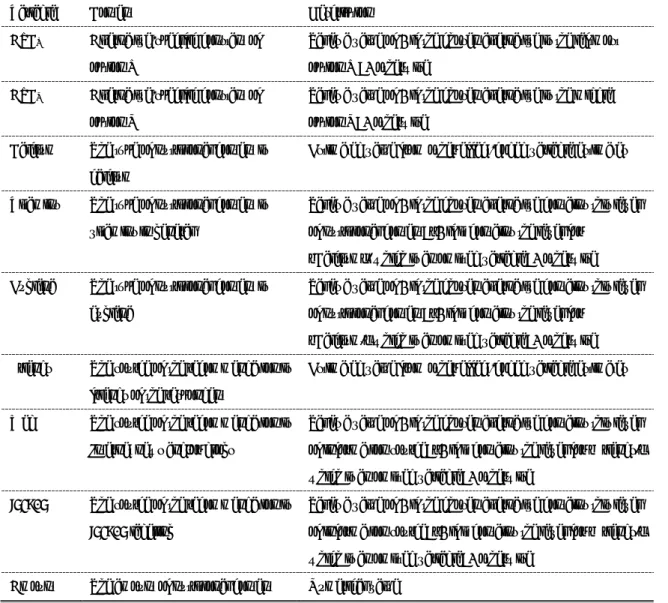
Table 5: List of variables
Variable Content Description
ASC
MAlternative-specific constant of option M
Takes a value of 1 if the chosen alternative is the leftmost option M; 0 otherwise
ASC
NAlternative-specific constant of option N
Takes a value of 1 if the chosen alternative is the middle option N; 0 otherwise
Calcium The type of nutritional content is calcium
Estimated value from other effect-coded variable estimates
Vitamins The type of nutritional content is vitamins in general
Takes a value of 1 if the chosen alternative contains this level of nutritional content; –1 if it contains the level for
“Calcium”, which is an omitted variable; 0 otherwise Euglena The type of nutritional content is
euglena
Takes a value of 1 if the chosen alternative contains this level of nutritional content; –1 if it contains the level for
“Calcium,” which is an omitted variable; 0 otherwise Friends The source of the recommendation is
friends of the respondent
Estimated value from other effect-coded variable estimates
Web The source of the recommendation is Internet news and/or blogs
Takes a value of 1 if the chosen alternative contains this level of information source; –1 if it contains the level for “Friends,”
which is an omitted variable; 0 otherwise
tokuhoThe source of the recommendation is
tokuho labeling
Takes a value of 1 if the chosen alternative contains this level of information source; –1 if it contains the level for “Friends,”
which is an omitted variable; 0 otherwise
Amount The amount of nutritional content Numerical value
Table 5 (cont’d)
Variable Content Description
Amount 100 mg The amount of nutritional content is 100 mg
Estimated value from other effect-coded variable estimates
Amount 200 mg The amount of nutritional content is 200 mg
Takes a value of 1 if the chosen alternative contains this level of information source; –1 if it contains the level for “100 mg,”
which is an omitted variable; 0 otherwise Amount 300 mg The amount of nutritional content
is 300 mg
Takes a value of 1 if the chosen alternative contains this level of information source; –1 if it contains the level for “100 mg,”
which is an omitted variable; 0 otherwise Price The price of a pack of chewing
gum with 14 pieces
Numerical value
Price JPY90 The price of a pack of chewing gum with 14 pieces is JPY 90
Estimated value from other effect-coded variable estimates
Price JPY110 The price of a pack of chewing gum with 14 pieces is JPY 110
Takes a value of 1 if the chosen alternative contains this level of information source; –1 if it contains the level for “JPY90,”
which is an omitted variable; 0 otherwise Price JPY130 The price of a pack of chewing
gum with 14 pieces is JPY 130
Takes a value of 1 if the chosen alternative contains this level of information source; –1 if it contains the level for “JPY110,”
which is an omitted variable; 0 otherwise
Table 6: GMNL results
Variables Coeff. T value P-value
Mean
ASC1 1.106 *** 9.049 0.000
ASC2 1.334 *** 11.007 0.000
Calcium –5.306
Vitamins 0.151 0.103 0.918
Euglena 5.154 ** 2.313 0.021
Friends 4.325
Web –5.832 ** –2.305 0.021
tokuho
1.507 1.539 0.124
Amount 100 mg –7.605
Amount 200 mg 1.786 ** 2.049 0.041
Amount 300 mg 5.819 ** 2.142 0.032
Price JPY90 8.187
Price JPY110 –1.132 –1.574 0.116
Price JPY130 –7.055 ** –2.305 0.021
SD Prob. distribution
Euglena Triangular 8.515 ** 2.132 0.033
Web Uniform 6.202 ** 2.083 0.037
Amount 300 mg Uniform 7.027 ** 2.066 0.039
2.828 *** 8.046 0.000
Γ –0.119 * –1.932 0.053
Log likelihood –1030.200
No. of observations 1343
No. of samples 168
Halton replication 100
Notes: ***, **, and * denote significance at the 1%, 5%, and 10% level, respectively. SD, standard deviation. The mean parameter for
the omitted level of effect-coded variables is calculated using the parameters of the remaining levels.
Table 7: Individual parameters and results of the Brunner–Munzel test
Sample A Sample B P-value
Vitamins Minimum 0.001 0.001 0.015**
1st Quartile 0.003 0.006
Median 0.009 0.026
3rd Quartile 0.089 0.212
Maximum 1.035 2.214
Euglena Minimum 0.012 0.013 0.015**
1st Quartile 0.033 0.061
Median 0.088 0.257
3rd Quartile 0.883 2.110
Maximum 10.297 22.039
Web Minimum 0.014 0.015 0.015**
1st Quartile 0.039 0.072
Median 0.104 0.304
3rd Quartile 1.046 2.501
Maximum 12.201 26.115
tokuho