Imaging findings of mandibular neurovascular structures using computed tomography
(CTを用いた下顎骨神経脈管系構造の画像所見)
日本大学大学院松戸歯学研究科歯学専攻
日本大学松戸歯学部放射線学講座 川島 雄介
(指導 金田 隆 教授)
Abstract
Neurovascular structures exist in the mandible including the mandibular canals and the
nutrient canals. The mandibular second molar apices have been reported to be the
closest to the mandibular canal and the nutrient canals are most often seen in the
anterior region of the mandible. Accurate determinations of the location of the
mandibular canal and the nutrient canals prior to dental procedures are crucial to avoid
injury. The purposes of this study were 1) To evaluate age and gender-related changes
using CBCT images, between the roots of the second molars, mandibular cortex and the
mandibular canal. 2) To assess the nutrient canals using MDCT images, including canal
prevalence, location, number, size, shape, and the CT values of nutrient foramina.
1) 155 patients were retrospectively analyzed. The patients were
subcategorized by gender and age (Group I: <21 years; Group II: 21-40 years; Group
III: >40 years). Distance between the mandibular canal and the second molar distal root
apex as well as the three mandibular cortical regions was measured on the cross
sectional images. 2) 194 patients were retrospectively analyzed.
The results are as follows; 1) In males, the distance between second molar root apex and
the mandibular canal was significantly shorter in group I (mean 2.40mm) than group III
(mean 4.01mm) (P<0.01). In females, the distance between second molar root apex and
the mandibular canal was significantly shorter in group I (mean 1.40mm) than group II
(mean 2.58mm) and group III (mean 3.36mm) (P<0.01).
2) The nutrient canals were seen in 94.3% in the mandible. Nutrient canals were most
seen in the anterior region of the mandible. By location, nutrient canals were most
commonly seen between the central and lateral incisors. The size of the nutrient
foramen varied from 0.4 to 2.0 mm, and the shape was most commonly ovoid. The
mean CT value of nutrient foramina was 420 HU±227.
In conclusion, this study has revealed that age, gender and region have an influence on
the location of the mandibular canal in the second molar area and 94% were seen
mandibular nutrient canal in the mandible. By preoperative knowledge of these findings
may useful to plan the treatment and to prevent complications of mandibular surgery.
Introduction
Neurovascular structures exist in the mandible including the mandibular canals
and the nutrient canals1. The mandibular canal runs through the ramus of the mandible
body to the mental foramen2 giving the branches to the premolar and molar regions3.
The mandibular canal contains inferior neurovascular bundles which are the inferior
alveolar nerve (IAN), artery and vein and supplies the mandibular molar and premolar
teeth and adjacent parts of the gingiva2. The IAN diverges into the mental nerve and the
incisive branch near the premolar region4-8. Nutrient canals are derived from the incisive
branch of the inferior neurovascular bundles5-8 which supplies teeth and gingival tissue
in the anterior region of the mandible8 and are visible in about 5% to 40% of all patients
on periapical radiographs9. Nutrient canals carry neurovascular bundles and appear as
radiolucent lines of fairly uniform width on periapical radiographs9,10. They are most
often seen on mandibular periapical radiographs running vertically from inferior dental
canal directly to the apex of a tooth or into the interdental space between mandibular
incisors11.
The reason we care about the mandibular canals and the nutrient canals are
because these canals are sometime damaged during various dental intervention such as
dental implant treatment, tooth extraction and root canal treatment12-16. The injury may
result in neuropathic pain, anesthesia or severe hemorrhage12-17. The mandibular second
molar apices have been reported to be the closest to the mandibular canal compared to
the premolars and the first molar17 and the nutrient canals are most often seen in the
anterior region of the mandible compared with premolar and molar regions of the
mandible9. Dental intervention involving these two regions may have the high risk to
have the mandibular canal and the nutrient canals injury. Accurate determinations of the
location of the mandibular canals in the second molar region and the nutrient canals in
the anterior region of the mandible prior to dental procedures are crucial to avoid injury.
Most of the information regarding the mandibular canals and the nutrient canals are
usually obtained from conventional periapical or panoramic radiographs. The
limitations of 2D radiographs include the lack of buccal-lingual information,
interference by the buccal plate, and the inherent magnification and distortion18. The
advent of 3D imaging such as multi detector row computed tomography (MDCT) and
cone beam computed tomography (CBCT) has been crucial in understanding the head
and neck structures18,19. However, few reports evaluated the mandibular canal in the
second molar region and the nutrient canals in the mandible using CT images. There
were two purposes in this study. 1) To evaluate age and gender-related changes using
CBCT images, between the roots of the second molars, mandibular cortex and the
mandibular canal. 2) To assess the nutrient canals using MDCT images, including canal
prevalence, location, number, size, shape, and the CT values of nutrient foramina.
Material and Methods
The first study was approved by the Institutional Review Board of Boston
University Henry M Goldman School of Dental Medicine (H-33424). The second study
was approved by the Institutional Review Board of the Nihon University School of
Dentistry at Matsudo (EC12-009).
1) All images were obtained from the radiology database at Boston University Henry M
Goldman School of Dental Medicine. All patients signed an informed consent
agreement for the CBCT examination. Images were acquired using i-CAT (Imaging
Sciences International, Hatfield, PA) at 120 kVp and 4-7 mA with 14-bit gray scale
resolution and voxel size of 0.125- 0.3 millimeters. Measurements were made using the
i-CAT Vision software and 155 patients’ CBCT scans who underwent CBCT from April
2009 to September 2014 were enrolled (68 males, 87 females, mean age 32.3 years; age
range, 12-65 years) were randomly selected. The patients were subcategorized by age
(Group I: <21 years, mean age 16.9 years, n=51; Group II: 21-40 years, mean age, 29.7
years, n=53; Group III: >40 years, mean age 50.3 years, n=51) and gender. The patients
were consisted from multiracial ethnic populations including Caucasoid, Asian, Negroid
and Spanish. Inclusion criterion was existing second molar. Exclusion criteria were
missing second molar, the second molar root apex was not formed, previous history of
trauma, tumors, cysts and periapical lesions presenting in the mandibular posterior
region and patients undergoing orthodontic treatment. All images were evaluated
retrospectively by two calibrated examiners and measurements were obtained
independently. Distance between the mandibular canal and the second molar distal root
apex as well as the three mandibular cortical regions (inferior cortex, buccal cortex and
lingual cortex) was measured on cross sectional images as follows (Fig. 1): ①the distal
root apex of the mandibular second molar (A) to superior cortical bone of the
mandibular canal (MC): A-MC, ② the inferior cortical border of the mandible to the
inferior cortex to the MC: I-MC), ③ the lingual cortical border of the mandible to the
MC: L-MC, and ④ the buccal cortical border of the mandible to the MC: B-MC. The
distance from buccal cortex and lingual cortex to the mandibular canal was measured
parallel to the occlusal plane. The distance from the second molar distal root apex to the
mandibular canal and from the inferior cortex to the mandibular canal was measured
vertical to the occlusal plane. The root apex which was below the mandibular canal
recorded as minus. All of the measurements were done on the 3D rendering software
Invivo 5 (Anatomage, San Jose, CA) on a Dell UltraSharp 2408WFP 24-inch LCD
monitor at a pixel resolution of 1920 X 1200. After interval of two weeks, the distances
of four locations in 12 patients were re-measured for data reliability. Paired t-tests were
used to evaluate the reliability of the measurements.
Statistical analysis
The data were recorded in Microsoft® Excel® and analyzed using the statistical
software added in to the Microsoft® Excel®. Mann-Whitney’s U test and Steel-Dwass
test was used to compare sex differences and age differences. P values less than .05
were considered statistically significant.
2) Of the 552 patients who underwent CT imaging for the evaluation of maxilla,
mandible, and maxillary sinus diseases as outpatients at Department of Radiology in
Nihon University Dental Hospital at Matsudo (Chiba, Japan), between August 2011 and
October 2011, the mandibular CT images of 194 consecutive patients (93 males and 101
females; mean age 47.5 years; age range, 10–79 years) were analyzed retrospectively.
All patients were Japanese and signed an informed consent agreement for the CT
examination. Exclusion criteria were history of radiotherapy, severe periodontal disease,
systemic disease (eg, hematological disorders and diabetes mellitus) with presentation
in the mandible, tumor, and cyst with presentation in the mandible; mandible
unobservable on CT images; and metal artifacts precluding visualization of the
mandible. The CT examinations were performed with a multi detector row CT scanner
(Aquilion 64; Toshiba medical, Tochigi, Japan). For the evaluation of maxilla, mandible,
and maxillary sinus, all patients were examined craniofacial area using radiographic
protocol for maxilla, mandible, and maxillary sinus examination at our hospital as
follows: tube voltage, 120 kV; tube current, 100 mA; field of view, 180 mm × 180 mm;
helical pitch, 41; rotation time, 1.0 second; mean effective dose, 1.6 mSv; mean
CTDIvol value, 37.3 mGy; mean DLP value, 520.3 mGy cm, using a contiguous
high-resolution algorithm for osseous structures (window level 500, window wide 2800).
The protocol consisted of axial scanning (0.50 mm) with production of axial multiplanar
reformation (3.00 mm). All measurement data were obtained using the Ziostation v1.1x
measurement system (Qi Imaging, Tokyo, Japan). Initially, the nutrient canals which
were deriving from the incisive branch of the inferior neurovascular bundle and running
through lingual cortical bone of the mandible to the alveolar process were searched on
sagittal CT images (Fig. 2). These canals were observed on the consecutive axial CT
images of 0.5 and 3 mm slice thickness on the monitor display (Fig. 3 a and b).
Parameters including canal prevalence, location, number, size (length and width), shape,
and the CT value of nutrient foramina were measured. The length was parallel to the
mesio-distal direction and the width was parallel to the bucco-lingual direction. The size
of nutrient foramen was assessed near the alveolar process on axial CT images of 0.5
mm slice thickness. The other parameters were assessed on axial CT images of 0.5 and
3 mm slice thickness. The shape of nutrient foramen was classified as either round or
ovoid (being defined as having a ratio of length/width equal to 1 and smaller/larger than
1, respectively). To assess the CT value of nutrient foramina, region of interest (ROI)
were manually drawn in the nutrient foramina. CT values were measured 3 times in
these ROIs to enable calculation of the mean CT value. All images were retrospectively
evaluated by 2 oral and maxillofacial radiologists who have over 10 years’ experience.
They observed the axial CT images of 0.5 and 3 mm slice thickness on the monitor
independently. After the interval of 2 weeks, the diameter of the nutrient canals and the
CT value of nutrient foramina were evaluated with 30 randomly selected patients to
statistically evaluate intra observer reliability.
Statistical analysis
The significance assessment of the difference between gender-related differences
in the mean number of nutrient canals was statistically evaluated using the Steel-Dwass
test. The significance assessment of the gender difference in the mean CT value of
nutrient foramen was evaluated by using the Mann- Whitney U test. P values less
than .05 were considered statistically significant. The paired t tests were used to
evaluate the data reliability. Statistical tests were performed using SPSS software
version 20 for windows (SPSS, Chicago, IL).
Results
1) Mandibular canals Data reliability
There was no indication of systemic intra observer errors in the linear
measurements between first and second determinations, based on paired t-test.
Age related and gender differences (the right and the left sides were combined, Table
1)
In males, A-MC distance was significantly shorter in group I (n=26) (range
−2.40 to 8.99 mm mean 2.40mm, SD 2.69) than in group III (n=21) (range −1.16 to
8.36 mm, mean 4.01mm, SD 2.27) (P<0.01). In females, A-MC distance was
significantly shorter in group I (n=25) (range −1.84 to 6.28mm, mean 1.40mm, SD
1.69) than in group II (n=32) (range −1.74 to 7.89mm, mean 2.58mm, SD 2.21) and in
group III (n=30) (range −2.86 to 11.17mm, mean 3.36mm, SD 2.97) (group I vs group
II; P<0.05, group I vs group III; P<0.01).
Differences related to the side of the mandible (Table 2)
In males (n=68), B-MC distance was significantly shorter on the right side
(range 2.87 to 8.68mm, mean 4.94 mm, SD 1.57) compared to the left side (range 1.00
to 8.68mm, mean 5.69mm, SD 1.63) (P<0.01). Similarly, in females (n=87), B-MC
distance was significantly shorter on the right (range 3.35 to 9.84mm, mean 5.91mm,
SD 1.59) than the left side (range 2.34 to 10.23mm, mean 6.06mm, SD 1.36) (P<0.01).
Gender Differences related to the side of the mandible (Table 3)
In both sides of the mandible, A-MC distance was significantly shorter in
females (n=87) compared to the males (n=68). The average A-MC distance on the right
side in females was 2.62 mm (range −1.84 to 11.17mm, SD 2.64) compared to 3.16 mm
(range −2.40 to 8.36mm, SD 2.55) in males (P<0.01). Similarly the average A-MC
distance on the left side was 2.41mm (range −2.86 to 8.77mm, SD 2.36) in females
compared to 3.02 mm (range −1.33 to 10.25mm, SD 2.66) in males (P<0.05). On the
left side, L-MC distance was significantly shorter in males (range 0.39 to 6.95mm mean
2.17mm, SD 1.28) than in females (range 1.08 to 7.16mm, mean 2.74mm, SD 1.19)
(P<0.01).
Gender differences related to the A-MC distance (the right and the left sides were
combined, Table 4)
A-MC distance was significantly shorter in females (n=87) (range −2.86 to
11.17mm, mean 2.51mm, SD 2.51) than in males (n=68) (range −2.40 to 10.25mm,
mean 3.21mm, SD 2.61) (P<0.01).
2) Nutrient canals Data reliability
There was no indication of systemic intra observer errors in the measurements
between first and second determinations, based on paired t-test.
Prevalence
Of 194 cases, 183 cases (94.3%) were found nutrient canals in the mandible. Of
194 cases, 180 cases (92.7%) were found nutrient canals in the anterior region of the
mandible, 83 cases (42%) were found in the premolar region, and 3 cases (1%) were
found in the molar region.
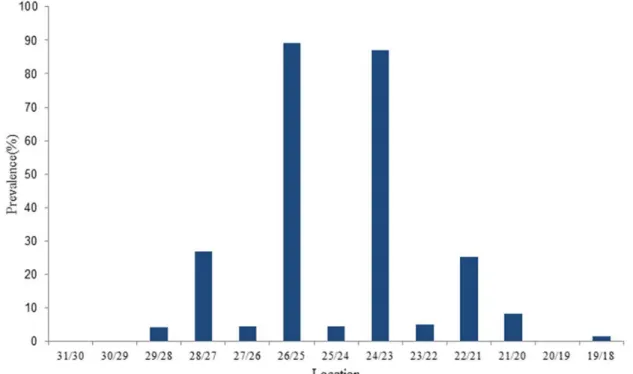
Location
The most common sites for mandibular nutrient canals were between the central
and lateral incisors: canals between the right central and lateral incisors and between the
left central and lateral incisors were found in 89% and 87% of cases, respectively.
Nutrient canals were found in other locations in 0% to 26% of patients (Fig. 4).
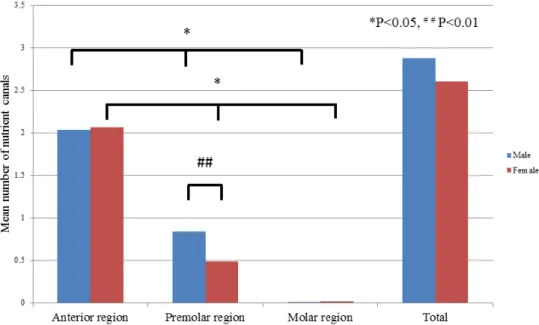
Gender
The mean number of canals (total and by region) was analyzed for gender
specific differences (Fig. 5). Male: total, the anterior region, the premolar region, and
the molar region were 2.88, 2.03, 0.83, and 0.01, respectively. Female: total, the anterior
region, the premolar region, and the molar region were 2.6, 2.06, 0.48, and 0.02,
respectively. There were no significant gender-related differences in the mean number
of nutrient canals in the mandible (total), nor in the anterior or molar regions. In contrast,
the mean number of nutrient canals in the premolar region (0.83 for male patients and
0.48 for female patients) was significantly different (P<0.05). Nutrient canals were seen
significantly more often in the anterior region than in the premolar or the molar regions
in both male and female patients (Fig. 5).
Size, shape, and CT value of the nutrient foramina between the central and lateral incisors
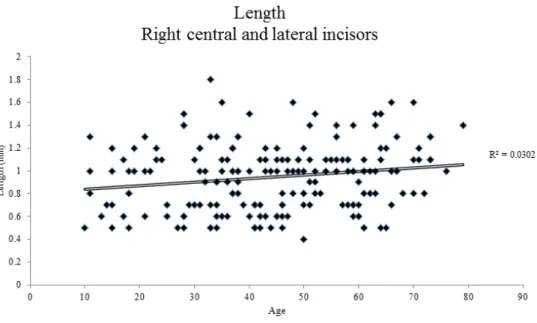
The length of the nutrient foramina between the right central and lateral incisors
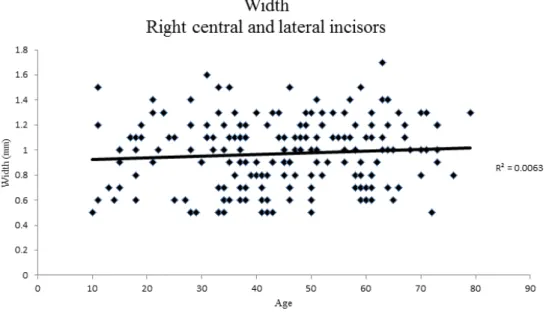
varied from 0.4 to 1.8 mm (mean ± SD: 0.9 ± 0.3 mm) (Fig. 6), whereas the width
varied from 0.5 to 1.8 mm (mean ± SD: 0.9 ± 0.3 mm) (Fig. 7). On the left side, the
length of the nutrient foramina between the left central and lateral incisors varied from
0.4 to 2.0 mm (mean ± SD: 1.0 ± 0.3 mm) (Fig. 8), whereas the width was in the range
of 0.4 to 1.8 mm (mean ± SD: 1.0 ± 0.3) (Fig. 9). There were no age-related differences
in foramen size. In 35 of 191 cases (18.3%), foramina between the right central and
lateral incisors were round, whereas they were ovoid in the remaining 156 cases
(81.7%). Similarly, in 33 of 178 cases (18.5%), foramina of canals between the left
central and lateral incisors were round, whereas in the remaining 145 cases (81.5%),
they were ovoid. The mean CT values (mean ± SD) for nutrient foramina between (1)
the right central and lateral incisors and (2) the left central and lateral incisors were
411± 15 HU and 429 ± 207 HU, respectively. In male patients, these values were
404±231 HU and 419±215 HU, respectively, and in female patients, they were
418±199HU and 439±199 HU, respectively. There was no significant difference
between these values in male and female patients (P >0.05).
Patient age
The mean number of nutrient canals in the mandible (total) and in the anterior, premolar,
and molar regions of the mandible in each decade of life (second decade to eighth
decade) are shown in Figure 10. The mean numbers of nutrient canals in total and in the
anterior and the molar regions of the mandible were slightly decreased with age.
However, the mean number of nutrient canals in the premolar region was slightly
increased with age.
Discussion
1) Mandibular canals
Our results indicate the A-MC distance increases with age in both males and
females in the second molar region. Kovisto et al17 studied that root apices in younger
patients (<18 years) were generally closer to the mandibular canal than older patients.
According to the prior study, the distance between root apices and the mandibular canal
increase with eruption of mandibular teeth20. Our results may suggest the possibility of
increased bone growth after tooth eruption and/or inferior migration of the mandibular
canal with age in both genders. Age and sex differences appear to affect the proximity to
the mandibular canal to root apices as well as buccal cortex, however the course of the
canal traverses through the mandible might vary individually.
Our results revealed A-MC distance was significantly shorter in females than in
males. This trend is similar to prior studies20-23. Denio et al21 used sectioning on 22
human dried mandibles to examine the relationship of the mandibular canal to root
apices, and found the mandibular second premolar and the second molar had the closest
distances to the mandibular canal. Sato et al22 used panoramic radiographs to measure
the distance from root apices to the superior border of the mandibular canal, and found
the first and second molar roots were slightly closer to the mandibular canal in females
than in males. Overall, the average distance from the mesial root of the second molar to
the superior border of the mandibular canal was 0.79±0.44 mm, and that from the distal
root was 0.70±0.45 mm. Even though their findings were not statistically significant, a
trend can be noticed that the distance from the apex of second molars to the mandibular
canal is shorter in females compared to males. Bürklein et al23 analyzed CBCT images
in German population. They measured distance between mandibular second molar distal
root apex to the superior border of the mandibular canal. There was a tendency that the
distance was shorter in females than males although it was not statistically significant.
Our results indicate that differences between female and male may be attributed to the
fact that men generally have a larger body size and consecutively show greater distances
between the mandibular canal and the root apices22. Clinically this indicates that the
potential risk of iatrogenic nerve damage may be more common in females22.
The A-MC distance in our study was greater than the prior study22. Our study
was performed using CBCT, and not panoramic radiographs which were used in prior
study22. Therefore, more accurate measurement could be obtained on CBCT images18.
This may be due to the fact that the lingual mandibular canal is projected higher by the
negative angulation of the X-ray tube in a panoramic image. Comparing with the prior
studies using CBCT, the A-MC distance was longer than Kovisto et al17 ‘study though
longer than Bürklein et al’s study23. This may be the result of the different number of the
subjects17 and difference of the country where the study had done23.
When comparing males with females to the side of the mandible, the left
mandibular canal takes more lingual course in males than females and both sides of the
mandibular canals run closer to the apex. It was seen in Oliveira Júnior et al’s study20
that there was a tendency that the mandibular canal ran more lingual on the right than
the left, although it was not statistically significant. Although, there were few reports
that compared the proximity of the mandibular canal to the apex in each side of the
mandible. Our results suggest that the canal runs higher in female compared to male
therefore the L-MC distance is longer because of the thickness of the lingual cortical
bone. Our results revealed that the mandibular canal possibly takes more buccal route in
the right mandible than the left in both males and females. A similar trend was observed
by de Oliveira Júnior et al20, where the mandibular canal appears more buccal on the
right than the left in both genders. It is also possible the mandible may be narrower on
the right side compared to the left as there was no statistically significant difference
between the L-MC distances on either side among each group in our study. Further
studies will be needed to investigate whether there is asymmetry between the ridges on
either side of the mandible.
2) Nutrient canals
Our analysis of CT images revealed that the nutrient canals were running into
the lingual cortical bone which ends at near the alveolar process on axial CT images.
Clinically, dental implant surgery in the edentulous anterior mandible is considered a
routine and relatively safe surgical procedure, but it is not without potential
morbidity25-28. Complications include hemorrhage from incisive canal12 and sensory
disturbance of incisive canal region5-7. The cause was considered trauma to the incisive
canal29. These complications25-28 are not related to injury of the nutrient canals.
However, the nutrient canals carry neurovascular bundles5-7. Morbidity may occur in
case the nutrient canals injured.
Prevalence and location
In our study, 93% of the nutrient canals were seen mostly in the anterior region
of the mandible. By location, nutrient canals were particularly seen between the central
and lateral incisors in the mandible. Patel et al11 reported that nutrient canals are seen in
the anterior region of the mandible 42.5% on average, Kishi et al10 reported a
prevalence of 1% to 65% in the anterior region, and Britt25 reported nutrient canals were
observed in 14% of studied cadavers. These studies evaluated periapical radiographs,
but we observed axial CT images of 0.5 and 3mm slice thickness. Our results
demonstrated that prevalence of the nutrient canals on axial CT images were higher than
that of on periapical radiographs. We considered these differences were due to
difference of modality. MDCT use volume scan and detect mandible three
dimensionally so the accuracy improves compared with periapical radiographs. Britt30
reported that nutrient canals are most often seen in the anterior region of the mandible.
The mandibular nutrient canals were not observed in 6% of the patients. In such cases,
the nutrient canals running up to the lingual cortical bone, but stopped in the middle of
the cortical bone.
In our study, prevalence of the nutrient canals in the anterior region is higher than that
of other two regions. We think that these canals serve to deliver nutrition to teeth in the
anterior region because these teeth are at some distance from the mandibular canal and
thus require alternative supply routes.
Our study revealed that nutrient canals were particularly seen between the
central and lateral incisors. McCall and Wald31 reported that nutrient canals are
particularly seen between the central and lateral incisors in the mandible on periapical
radiographs. We believe that this high prevalence of canals between the central and
lateral incisors reflects the fact that these locations are at the terminal ends of the
nutrient canals.
Age dependence of canal distribution
Our study revealed that the mean number of nutrient canals slightly decreased in
the anterior region of the mandible and in total, whereas the mean number of nutrient
canals in the premolar region was slightly increased with age. White and Pharoah9
stated that nutrient canals are often seen in older person. We believe that, because of the
role of nutrient canals in supplying nutrients to the anterior region, they are necessary at
all stages of life and thus do not significantly increase or decrease with age.
Gender dependence of canal distribution
Our results show that no significant gender difference in the mean number of
nutrient canals in the mandible, in the anterior region of the mandible, and in the molar
region of the mandible. White and Pharoah9 also stated that nutrient canals are more
frequent in males than in females. However, there was a significant difference between
males and females in the mean number of nutrient canals in the premolar region. This
may be a result of gender difference of divergent point at which inferior alveolar canal
diverges into the incisive canal and the mental nerve near the premolar region.
Size, shape, and CT Values of nutrient foramina
In our study, the length of the nutrient foramen was varying from 0.4 to 1.8 mm, and the
width was varying from 0.5 to 1.8 mm. Regarding aperture of the nutrient foramen,
82% of the formania were ovoid in shape, with only 18% being round. Shimizu32
reported that diameter of nutrient foramen between the central and lateral incisors vary
from <0.3 to >1.2 mm and also reported that 0.5 to 0.7mm is the most frequent diameter
in dry human mandible. Shimizu32 also reported that nutrient foramen is most
commonly round in shape. We believe that the nutrient foramen diameter does not
change with age because of ongoing necessity of these canals in supplying nutrition to
the anterior region of the mandible. Regarding the CT value, nutrient foramina contain
neurovascular bundles that being soft tissue should have CT values of 20 to 40 HU33.
However, our results revealed that the mean CT value of the nutrient foramina between
the central and lateral incisors was 420 HU. We believe that the CT values of the
nutrient foramina were affected by partial volume effect.
Conclusion
The present study has revealed that age, gender and region have an influence on
the location of the mandibular canal in the second molar area and 94% were seen
mandibular nutrient canals in the mandible. Dental practitioners need to know accurate
location of the mandibular canals and the nutrient canals prior to dental procedures such
as dental implant treatment, tooth extraction and endodontic treatment. By preoperative
knowledge of these findings may useful to plan the treatment and to prevent
complications of mandibular surgery.
References
1. Krasny A, Krasny N, Prescher A. Anatomic variations of neural canal structures of
the mandible observed by 3-tesla magnetic resonance imaging. J Comput Assist
Tomogr. 2012; 36:150-153.
2. Claeys V, Wackens G. Bifid mandibular canal: literature review and case report.
Dentomaxillofac Radiol. 2005; 34:55–58.
3. Ikeda K, Ho KC, Nowicki BH, Haughton VM. Multiplanar MR and anatomic study
of the mandibular canal. Am J Neuroradiol. 1996 ;17:579-584.
4. Burstein J, Mastin C, Le B. Avoiding injury to the inferior alveolar nerve by routine
use of intraoperative radiographs during implant placement. J Oral Implantol. 2008;
34:34–38.
5. Bavitz JB, Harn SD, Hansen CA, et al. An anatomical study of mental neurovascular
bundle implants relationships. Int J Oral Maxillofac Implants. 1993; 8:563–567.
6. Arzouman MJ, Otis L, Kipnis V, et al. Observations of the anterior loop of the
inferior alveolar canal. Int J Oral Maxillofac Implants. 1993; 8:295–300.
7. Mardinger O, Chaushu G, Arensburg B, et al. Anatomic and radiologic course of the
mandibular incisive canal. Surg Radiol Anat. 2000; 22:157–161.
8. De Andrade E, Otomo-Corgel J, Pucher J, et al. The intraosseous course of the
mandibular incisive nerve in the mandibular symphysis. Int J Periodontics
Restorative Dent. 2001; 21:591–597.
9. White SC, Pharoah MJ. Imaging principles and techniques. In: Dolan J, ed. Oral
Radiology: Principles and Interpretation. 7th ed. St Louis, MO: The CV Mosby
Company; 2014:147–148.
10. Kishi K, Nagaoka T, Gotoh T, et al. Radiographic study of mandibular nutrient
canals. Oral Surg Oral Med Oral Pathol. 1982; 54:118–122.
11. Patel JR, Wuehrmann AH. A radiographic study of nutrient canals. Oral Surg Oral
Med Oral Pathol. 1976; 42:693–701.
12. Wismeijer D, van Waas MA, Vermeeren JI, et al. Patients’ perception of sensory
disturbances of the mental nerve before and after implant surgery: A prospective
study of 110 patients. Br J Oral Maxillofac Surg. 1997; 35:254–259.
13. Lee CY, Yanagihara LC, Suzuki JB. Brisk, pulsatile bleeding from the anterior
mandibular incisive canal during implant surgery: A case report and use of an active
hemostatic matrix to terminate acute bleeding. Implant Dent. 2012; 21:368–373.
14. Juodzbalys G, Wang HL, Sabalys G J. Injury of the Inferior Alveolar Nerve during
Implant Placement: a Literature Review. Oral Maxillofac Res. 2011; 2(1): e1
15. Pogrel MA. Damage to the inferior alveolar nerve as the result of root canal therapy.
J Am Dent Assoc. 2007; 138:65–69.
16. Escoda-Francoli J, Canalda-Sahli C, Soler A, et al. Inferior alveolar nerve damage
because of overextended endodontic material: a problem of sealer cement
biocompatibility? J Endod. 2007; 33:1484–1489.
17. Kovisto T, Ahmad M, Bowles WR. Proximity of the mandibular canal to the tooth
apex. J Endod. 2011; 37:311-315.
18. Kim TS, Caruso JM, Christensen H, et al. A comparison of cone-beam computed
tomography and direct measurement in the examination of the mandibular canal and
adjacent structures. J Endod. 2010; 36:1191–1194.
19. Imhof H, Czerny C, Dirisamer A. Head and neck imaging with MDCT. Eur J Radiol.
2003;Suppl 1:S23-31
20. de Oliveira Júnior MR, Saud AL, Fonseca DR, et al. Morphometrical analysis of the
human mandibular canal: a CT investigation. Surg Radiol Anat. 2011; 33:345-352.
21. Denio D, Torabinejad M, Bakland LK. Anatomical relationship of the mandibular
canal to its surrounding structures in mature mandibles. J Endod. 1992; 18:161–165.
22. Sato I, Ueno R, Kawai T, et al. Rare courses of the mandibular canal in the molar
regions of the human mandible: a cadaveric study. Okajimas Folia Anat Jpn. 2005;
85:95–101.
23. Bürklein S, Grund C, Schäfer E, et al. Relationship between Root Apices and the
Mandibular Canal: A Cone-beam Computed Tomographic Analysis in a German
Population. J Endod. 2015; 41:1696-700.
24. Littner MM, Kaffe I, Tamse A, et al. P. Relationship between the apices of the lower
molars and mandibular canal: a radiographic study. Oral Surg Oral Med Oral Pathol.
1986; 62:595–602.
25. Isaacson TJ. Sublingual hematoma formation during immediate placement of
mandibular endosseous implants. J Am Dent Assoc. 2004; 135:168–172.
26. Kalpidis CD, Setayesh RM. Hemorrhage associated with endosseous implant
placement in the anterior mandible: A review of the literature. J Periodontol. 2004;
75:631–645.
27. Budihardja AS, Pytlik C, Haarmann S, et al. Hemorrhage in the floor of the mouth
after second-stage surgery: Case report. Implant Dent. 2006; 15:148–152.
28. Woo BM, Al-Bustani S, Ueeck BA. Floor of mouth hemorrhage and life-threatening
airway obstruction during immediate implant placement in the anterior mandible. Int
J Oral Maxillofac Surg. 2006; 35:961–964.
29. Hirsch JM, Brånemark PI. Fixture stability and nerve function after transposition
and lateralization of the inferior alveolar nerve and fixture installation. Br J Oral
Maxillofac Surg. 1995; 33:276–281.
30. Britt GN. A study of human mandibular nutrient canals. Oral Surg Oral Med Oral
Pathol. 1977; 44:635–645.
31. McCall JO, Wald SS. Clinical Dental Roentgenology: Technique and Interpretation
Including Roentgen Studies of the Child and the Adolescent. 4th ed. Philadelphia,
PA: W.B. Saunders; 1957:186– 187.
32. Shimizu N. Anatomical study of the foramina on the lingual surface of the human
mandible (author’s transl) [in Japanese]. Shigaku. 1977; 64:941–971.
33. Hounsfield GN. Computerized transverse axial scanning (tomography). 1.
Description of system. Br J Radiol. 1973; 46:1016–1022.
Fig.1
The distance to the mandibular canal from the apex of the second molar, inferior cortex, lingual cortex and buccal cortex of the mandible.
① the distal root apex of the mandibular second molar (A) to superior cortical bone of the mandibular canal (MC): A-MC, ② the inferior cortical border of the mandible to
the inferior cortex to the MC: I-MC, ③ the lingual cortical border of the mandible to
the MC: L-MC, and ④ the buccal cortical border of the mandible to the MC: B-MC.
Fig. 2 The sagittal CT image of the mandibular nutrient canal in 52-year-old female patient.
The mandibular nutrient canal between the left central and lateral incisors (white arrow) proceeds to the lingual plate of the cortical bone on sagittal CT image.
Fig. 3 The axial CT images of the mandibular nutrient canals in 52-year-old female patient.
The nutrient foramen (white arrows) appears between the central and lateral incisors on CT axial image.
Table 1. Age related differences of the distance to the mandibular canal from the apex of the second molar, inferior cortex, lingual cortex and buccal cortex of the mandible the (the right and the left sides were combined).
Male n=68 Group I
n=26 (mean±SD)
Group II n=21 (mean±SD)
Group III n=21 (mean±SD) A to MC (mm) 2.40±2.69 ** 3.42±2.53 4.01±2.27 **
I to MC (mm) 7.19±2.06 7.53±2.18 7.19±1.74
L MC (mm) 2.40±1.40 2.13±1.17 1.94±0.94
B to MC (mm) 5.81±1.69 5.96±1.78 5.38±1.27
Female n=87 Group I
n=25 (mean±SD)
Group II n=32 (mean±SD)
Group III n=30 (mean±SD) A to MC (mm) 1.40±1.69 *, ** 2.58±2.21 * 3.36±2.97 **
I to MC (mm) 6.62±1.73 7.32±2.61 6.98±1.80
L to MC (mm) 3.00±1.11 2.52±1.00 2.72±1.24
B to MC (mm) 6.26±1.51 6.04±1.35 5.83±1.38
Group I is younger than 21 years, group II was between 21-40 years and group III was older than 40 years. In males, the distance between A-MC was significantly shorter in group I than in group III (**P<0.01).
In females, the distance between A-MC was significantly shorter in group I than in group II and in group III (group I vs group II; *P<0.05, group I vs group III; **P<0.01).
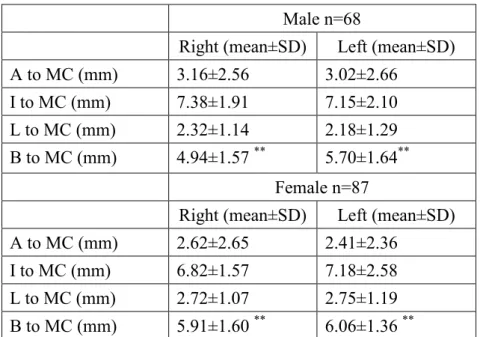
Table 2. Differences related to the side of the mandible Male n=68
Right (mean±SD) Left (mean±SD)
A to MC (mm) 3.16±2.56 3.02±2.66
I to MC (mm) 7.38±1.91 7.15±2.10
L to MC (mm) 2.32±1.14 2.18±1.29 B to MC (mm) 4.94±1.57 ** 5.70±1.64**
Female n=87
Right (mean±SD) Left (mean±SD)
A to MC (mm) 2.62±2.65 2.41±2.36
I to MC (mm) 6.82±1.57 7.18±2.58
L to MC (mm) 2.72±1.07 2.75±1.19 B to MC (mm) 5.91±1.60 ** 6.06±1.36 **
In males, the distance between B-MC was significantly shorter in right than in left (**P<0.01).
In females, the distance between B-MC was significantly shorter in right than in left (**P<0.01).
Table 3. Gender differences related to the side of the mandible.
Male right n=68 (mean±SD)
Female right n=87 (mean±SD) A to MC (mm) 3.16±2.56 ** 2.62±2.65 **
I to MC (mm) 7.38±1.91 6.82±1.57
L to MC (mm) 2.32±1.14 2.72±1.07 B to MC (mm) 4.94±1.57 5.91±1.60
Male left n=68 (mean±SD)
Female left n=87 (mean±SD) A to MC (mm) 3.02±2.66 * 2.41±2.36 *
I to MC (mm) 7.15±2.10 7.18±2.58
L to MC (mm) 2.18±1.29 ** 2.75±1.19 **
B to MC (mm) 5.70±1.64 6.06±1.36
In mandibular right, the distance between A-MC was significantly longer in males than in females (**P<0.01).
In mandibular left, the distance between A-MC was significantly longer in males than in females. The distance between L-MC was significantly shorter in males than in females (**P<0.01).
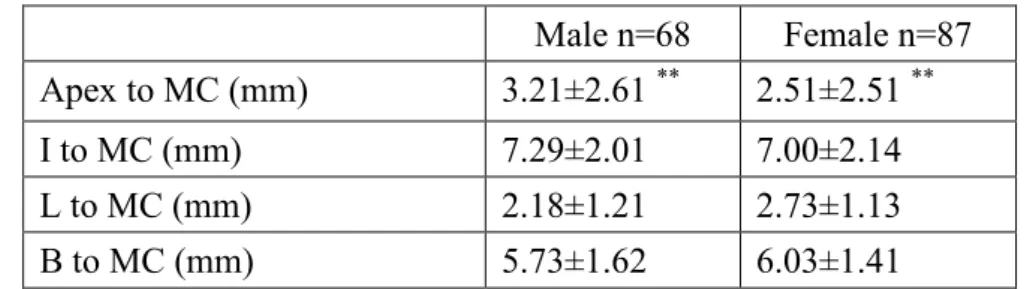
Table 4. Gender differences related to the A-MC distance (the right and the left sides
were combined).
Male n=68 Female n=87 Apex to MC (mm) 3.21±2.61 ** 2.51±2.51 **
I to MC (mm) 7.29±2.01 7.00±2.14
L to MC (mm) 2.18±1.21 2.73±1.13
B to MC (mm) 5.73±1.62 6.03±1.41
The distance between A-MC was significantly longer in males than in females (**P<0.01).
Fig. 4 Prevalence of nutrient canals in the mandible.
Canals are found most frequently between the right central incisor (25) and the lateral incisor (26) and between the left central incisor (24) and the lateral incisor (23). Teeth in this figure are numbered according to the Universal Numbering System.
Fig. 5 The mean number of nutrient canals in different regions of the mandible.
Differences were statistically analyzed using the Mann-Whitney U test (*) and the Steel-Dwass test (#). *P < 0.05; ##P< 0.01.
Fig. 6 Correlation between age and the mesio-distal diameter of the nutrient canals between the right central and lateral incisors.
Fig. 7 Correlation between age and the bucco-lingual diameter of the nutrient canals between the right central and lateral incisors.
Fig. 8 Correlation between age and the mesio-distal diameter of the nutrient canals between the left central and lateral incisors.
Fig. 9 Correlation between age and the bucco-lingual diameter of the nutrient canals between the left central and lateral incisors.
Fig. 10
Relationship between age and the mean number of nutrient canals in (A) the entire mandible; (B) the anterior region; (C) the premolar region; and (D) the molar region.