• 検索結果がありません。

IN PARTIAL FULFILLMENT OF THE REQUIREMENTS FOR THE DEGREE OF DOCTOR OF PHILOSOPHY

N/A
N/A
Protected

Academic year: 2021

シェア "IN PARTIAL FULFILLMENT OF THE REQUIREMENTS FOR THE DEGREE OF DOCTOR OF PHILOSOPHY "

Copied!
132
0
0

読み込み中.... (全文を見る)

全文

(1)

SYSTEMS BIOLOGICAL APPROACHES FOR UNDERSTANDING SPORULATION MECHANISMS OF

BACILLUS SUBTILIS A DISSERTATION

SUBMITTED TO THE SCHOOL OF FUNDAMENTAL SCIENCE AND TECHNOLOGY OF KEIO UNIVERSITY

IN PARTIAL FULFILLMENT OF THE REQUIREMENTS FOR THE DEGREE OF DOCTOR OF PHILOSOPHY

MINEO MOROHASHI

2007

(2)

© Copyright by Mineo Morohashi 2007

All Rights Reserved

(3)

ACKNOWLEDGMENTS

First and foremost, I would like to thank my parents, to whom I dedicate this thesis, for bringing me up the way they did, and for having faith in the choices I have made.

Without their support, I could not carry out this thesis project. I also really thank my brother Tomo, my sister Mari, and their family for their continuous support and help.

I am fortunate to have had chance to carry out my project under the supervision of Prof. Kotaro Oka, and as a principal advisor of this thesis. His optimistic and encourage motivated me whenever I was struggling to proceed. Prof. Hiroshi Yanagawa, Prof. Yasubumi Sakakibara, Dr. Rintaro Saito also help me a lot with fruitful discussions and helpful suggestions, and critical reading on my thesis.

I am most grateful to Prof. Yuichiro Anzai’s generosity, by which I could start working on systems biology field, while other lab members were working on robotics.

Dr. Hiroaki Kitano, who invited me to the world of systems biology, is for sure one of fantastic scientists I have ever met. He generously offered me great working environment when I was working at ERATO Kitano Symbiotic Systems Project. He provided me invaluable support at every step along the way. In addition, his sense of design made me sensible to those areas as well. I thank Ms. Yukiko Matsuoka, Ms.

Chie Ushiwata, Ms. Mine Shioiri, who have provided me relaxed time while working.

I am greatly indebted to Dr. Yoshiaki Ohashi, a colleague in Human Metabolome Technologies. His visionary mind and attractive characters inspired me in many ways.

His hard commit to work, yet attractive, made my paper accomplished in great manner.

I would also like to thank co-authors of my paper; Dr. Hamid Bolouri, Prof. John Doyle, Dr. Mark Borisuk, Dr. Amanda Winn, Ms. Kaori Shimizu, Dr. Junji Abe, Prof.

Hirotada Mori, Ms. Saeka Tani, Mr. Kotaro Ishii, Prof. Mitsuhiro Itaya, Dr. Hideaki

Nanamiya, and Prof. Fujio Kawamura.

(4)

work in a state-of-art field – metabolomics. While I work in Human Metabolome Technologies, their perspective and support helped me to go forward my project.

Along this long, long, long thesis project (almost seven years), I have been supported by many friends and colleagues; Ms. Nanae Mimura, Drs. Akira Funahashi, Noriko Hiroi, Tomomi Kimura, Theo Sabisch, Mike Hucka, Koji Kyoda, Shugo Hamahashi, Hiroki Ueda, Yasushi Hiraoka, Ayumu Yamamoto, Ding Da-Qiao, Martin Robert, Richard Baran, Masahiro Sugimoto, and Prof. Masatoshi Hagiwara. Their intelligence and kind support broadened my outlook to continue my thesis project.

My colleagues in Anzai Lab are also special to me; Drs. Sotaro Shimada, Nobuyuki Matsushita, Naohiko Kohtake, and Mr. Mitsuhiko Ohta. Sotaro was the only person who stayed in graduate school to get Ph.D., while all other members have left to get job. After few years, other two members have obtained their Ph.D. by chance – I am the next one following them.

Many thanks are also due to people by whom I have been supported at Human Metabolome Technologies. Mr. Takamasa Ishikawa, Mr. Hitoshi Sagawa, Mr. Seira Nakamura, Ms. Gin Maeta, Mr. Kosaku Shinoda, Mr. Atsushi Nagashima, Mr.

Hajime Sato, Ms. Yuki Ueno, Ms. Mutsuko Sato, Ms. Miho Ikeda, Mr. Yuji Sakakibara, Mr. Masatomo Hirabayashi, Ms. Sumiko Kumaki, Ms. Aya Shinoda, Mr.

Akiyoshi Hirayama, Mr. Kazunori Sasaki, Ms. Jun Imoto, Mr. Hideaki Murakami,

Drs. Yoshihiro Ohtaki, Haruyuki Ohkishi, and Shizuo Ao.

(5)

Morohashi, M., Ohashi, Y., Tani, S., Ishii, K., Itaya, M., Nanamiya, H., Kawamura, F., Tomita, M., and Soga, T.

Model based definition of population heterogeneity and its effects on metabolism in sporulating Bacillus subtilis.

J. Biochem. 2007. (In press)

Morohashi, M., Shimizu, K., Ohashi, Y., Abe, J., Mori, H., Tomita, M., and Soga, T.

P-BOSS: A new filtering method for treasure hunting in metabolomics.

J. Chromatography A. 2007. (In press)

Funahashi, A., Tanimura, N., Morohashi, M., and Kitano, H.

CellDesigner: a process diagram editor for gene-regulatory and biochemical networks.

BioSilico, 1:159-162, 2003.

Morohashi, M., Winn, A. E., Borisuk, M. T., Doyle, J., Bolouri, H., and Kitano, H.

Robustness as a measure of plausibility in models of biochemical networks.

J. Theor. Biol. 216:19-30, 2002.

(6)

AIC Akaike’s Information Criterion ANOVA Analysis of variance

ATP Adenosine 5’triphosphate

AUTO A software tool for bifurcation analysis

CE Capillary Electrophoresis

CellDesigner A modeling tool for gene-regulatory and biochemical networks

IE Intermediate enzyme

Java An object oriented programming language JWS Java Web Start

KEGG Kyoto Encyclopedia of Genes and Genomes MATLAB A software tool for numerical analysis MPF Maturation promoting factor

MS Mass spectrometry

ODE Ordinary differential equation PCA Principal component analysis PCR polymerase chain reaction

P-BOSS Peak filter based on orphan survival strategy SBML Systems Biology Markup Language

SBGN Systems Biology Graphical Notation SBW Systems Biology Workbench

TOFMS Time-of-flight mass spectrometry

UI User interface

XML Extensible Markup Language

(7)

TABLE OF CONTENTS

List of Tables ... iii

List of Figures ... iv

Introduction...1

Structure...5

Chapter 1: Systems Biology and computational approach ...6

Conclusion ...15

Chapter 2: CellDesigner: Development of Genetic/Biochemical Network Editor...16

Introduction...17

Design principles ...17

How does it work? ...26

What distinguishes CellDesigner's technology from others currently available?...27

Future work...28

Conclusion ...30

Chapter 3: Simulation Analysis of Cell Cycle Model of Xenopus ...31

Introduction...32

Materials and methods ...33

Results...34

Discussion and Conclusions ...55

Chapter 4: Development of Filtering Method for CE-MS based Metabolomics...56

Introduction...57

Materials and methods ...58

Results and discussion ...60

Conclusion ...74

Chapter 5: Metabolomics and Simulations upon Bacillus subtilis ...75

Introduction...76

Molecular and biochemical features of sporulation in Bacillus subtilis ...78

Materials and methods ...83

Results and Discussion ...86

(8)

ii

Conclusion ...106

Chapter 6: Conclusion...107

Summary of results ...108

Development of analysis tools and methods...108

Application to biological models ...109

Future directions ...110

Issues in systems biology...110

Systems biology in industries ...111

Final remarks ...113

Bibliography ...114

(9)

iii

LIST OF TABLES

Number Page

Table 1: Identified standard compound peaks. ...68

Table 2: Threshold values determined according to the max value of f(x). ...69

Table 3: Results between before and after applying P-BOSS ...70

Table 4: Matching ratio of peaks (orphan0 and orphan4 categories only) ...71

Table 5: Removal of ambiguous peaks adjacent to objective peaks...73

Table 6: Parameter values used in this study...89

Table 7: Bacterial strains used in this study...95

Table 8: Clustering of amino acids. ...105

(10)

iv

LIST OF FIGURES

Number Page

Figure 1: Structure of this thesis. ...4

Figure 2: Hypothesis driven research in systems biology. ...7

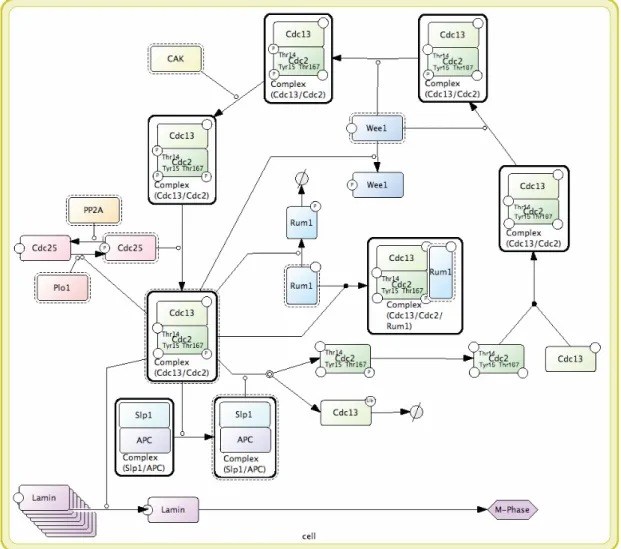
Figure 3: A process diagram representation of MPF cycle...21

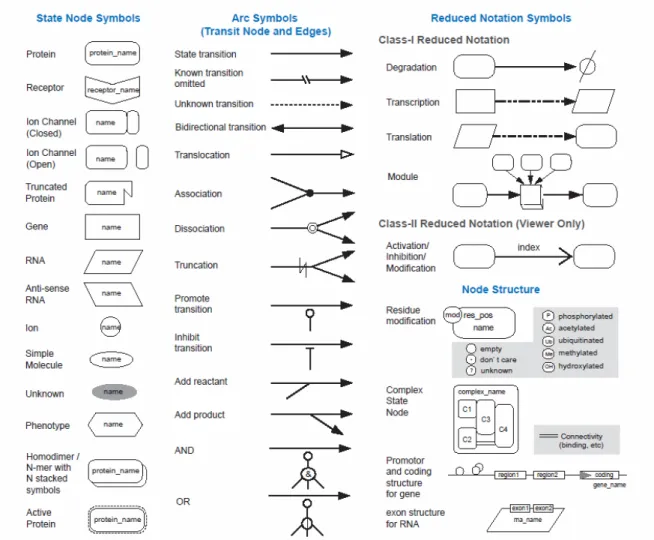
Figure 4: Proposed set of symbols for representing biological networks...22

Figure 5: Screenshot of CellDesigner...23

Figure 6: Schematic representation of two example behavior loci...38

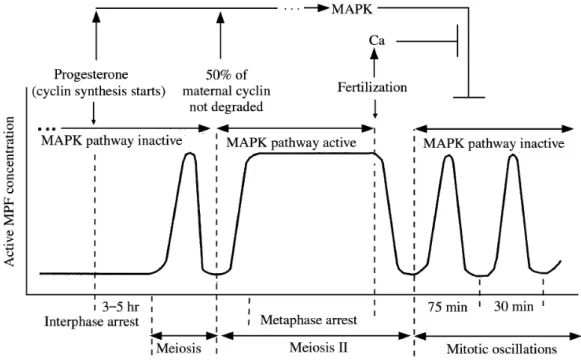
Figure 7: Schematic representation of major events in Xenopus eggs and embryos. ...41

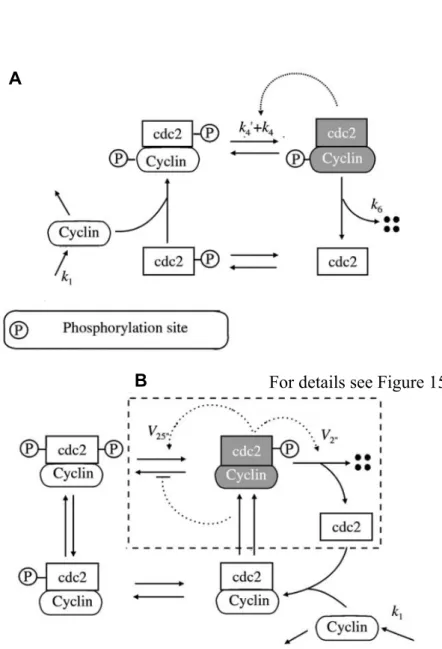
Figure 8: Schematic representations of two models of the Xenopus cell cycle. ...43

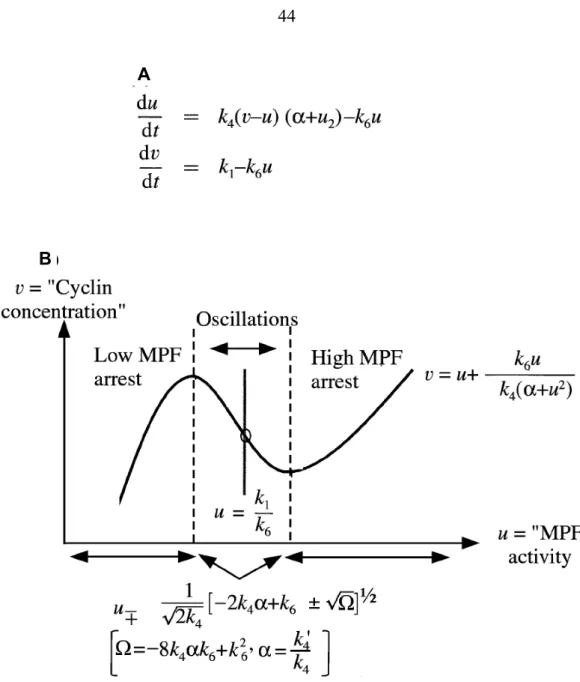
Figure 9: Overview of the reduced, two-equation version of the 1991 model. ...44

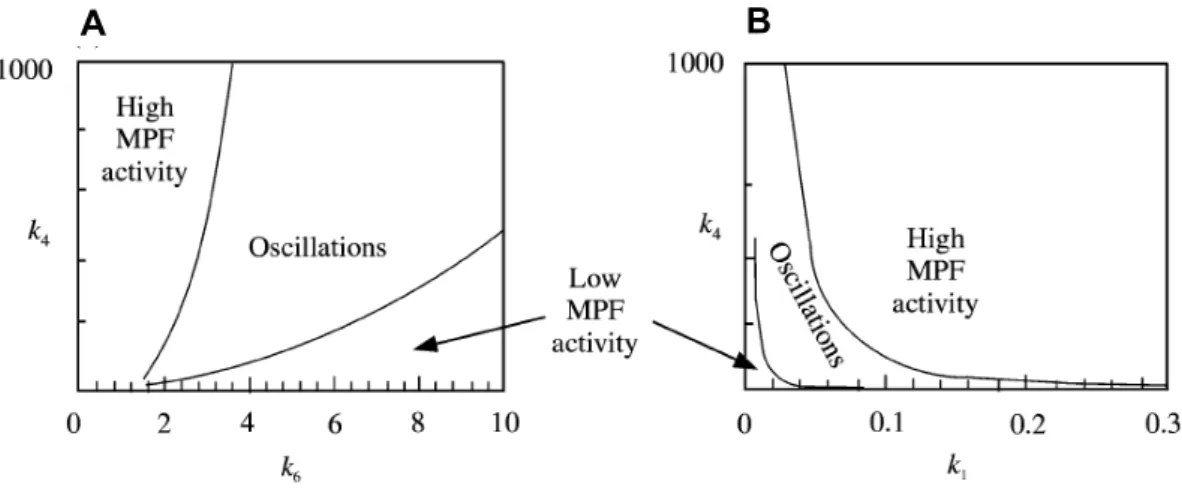
Figure 10: Two-parameter plots showing the regions in parameter space. ...45

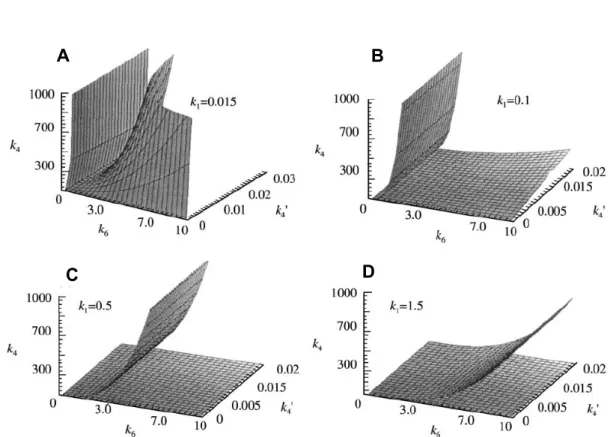
Figure 11: The effect of k1 on the shape of the model behavior in parameter space. ...47

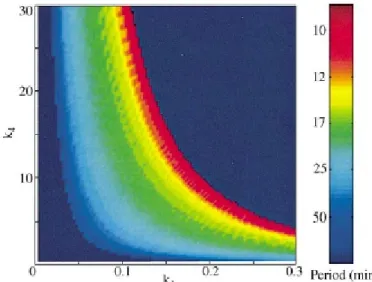
Figure 12: Contour plot of the frequency of oscillations in the 1991 model...48

Figure 13: The effect of k1 on the size/shape of the regions in the 1998 model...50

Figure 14: Cleavage frequency contour plot...51

Figure 15: Details of the additional reactions included in the 1998 model. ...52

Figure 16: The 1998 model optimized to give in vitro like oscillations...53

Figure 17: The 1998 model optimized to give in vivo like oscillations...54

Figure 18: Schematic representation of basic strategy for biomarker search. ...62

Figure 19: Definition of "orphan" categories...63

Figure 20: Percentile rank of four parameters in CE-TOFMS signals. ...64

Figure 21: Schematic representation of filtering process with P-BOSS/AIC...66

Figure 22: Transition of f(x) according to each parameter. ...69

Figure 23: The morphological stages of sporulation. ...79

Figure 24: The sporulation cascade in Bacillus subtilis and selected clostridia...82

Figure 25: Schematic representation of the phosphorelay network in B. subtilis...87

Figure 26: Dependency of sporulation rate upon the feedback coefficients...89

Figure 27: Behavior of the sporulation-decision system upon simulation. ...90

Figure 28: Effects of phosphorelay-associated mutations at sporulation onset...92

(11)

v

Figure 29: Effects of phosphorelay-associated mutations at sporulation onset...94

Figure 30: Growth curve of examined strains...98

Figure 31: The metabolic state of sporulating B. subtilis. ...99

Figure 32: Metabolic profiles of nucleotides...102

Figure 33. Metabolic profiling of B. subtilis...104

(12)

INTRODUCTION

Science is organized knowledge. Wisdom is organized life.

— Immanuel Kant

Recent biology is filled with complexity and flood of data. Since the discovery of molecular structure of DNA by Watson and Crick (Watson and Crick 1953), molecular biology has emerged as a methodology to understand biological systems from molecular viewpoint. Those approaches have enabled us to manipulate molecules in a way we would like to retrieve information out of them. Such approaches aimed primarily to know functions of each component (e.g., genes or proteins), and thus could have broaden our outlook in each. Their ‘reductionist’

approach is significant in listing all the parts of cells with detail function.

With the appearance of powerful computer processors and extensive data describing the mechanistic details of biological systems, there has been a shift toward

‘integrated’ approach – the focus is on understanding structure and dynamics (Kitano 2002). Besides, the advent of data-processing enabled high throughput data analyses, which resulted in completion of human genome sequence in 2001 (Venter et al. 2001).

While those accomplishments are just a beginning toward system-level understanding

of life, they are definitely significant milestones as a first step from systems biology

perspectives.

(13)

What is next then?

Now that genomes over 500 species have already sequenced (e.g., human, mouse, Drosophila, E. coli, and B. subtilis), other -ome technologies have emerged. The primary fields of them are transcriptomics, proteomics, and metabolomics.

Transcriptome is complement of mRNAs transcribed from genome, and transcriptomics refers to the study of the transcriptome using technologies of large- scale generation of mRNA expression profiles (Velculescu et al. 1997). Likewise, proteomics refers to the study of proteome (collection of proteins in the cells), and metabolomics to the study of metabolome (collection of metabolites in the cells (Soga et al. 2003; Morohashi et al. 2007)).

On one hand, systems biology is to infer knowledge from those various types of omics technologies, as mentioned above, which is literally ‘integrated’ approach – here we refer as “bottom up” approach. On the other hand, there is an utterly different approach, which we call as “top down” approach. The problems in biology are exacerbated by an increase in information complexity – no longer can systems be represented as isolated linear or hierarchical structures, instead we find complex interrelationships. Computer simulations can be used to study such systems, with the result that proposed models and hypothesis can be either validated or rejected. These methods can also complement experimental investigation, by testing experimentally measured data and highlighting future strategies of research. Although they complement each other, the top-down approach tends to focus on specific phenomena to understand mechanisms behind them. From the perspective, omics data is not necessary, yet only fraction of them is sufficient.

As mentioned above (see detail in next chapter as well), systems biology is diverse

discipline, and one can take thousands of methodologies depending on what she/he

would like to look into. As a common and significant fact, any approaches need to

comprehensively utilize cutting edge measurement technologies and software

infrastructure. Those technologies should be appropriately developed and well

established, and also should be well linked toward efficient analyses thereafter. Such

(14)

efforts have been already underway in the world. One of them is Alliance for Cellular Signaling (AfCS, http://afcs.org), which is aiming at making large-scale measurements with the ultimate goal of creating an in-depth simulation model of cells.

Although we could now obtain large-scale and wide spectrum of data, we are still missing huge amount of components in analysis platform. We thus started to ask ourselves following three questions:

1. Can we perform more efficient analyses than before?

• In order to facilitate systems biology research, various techniques must be employed, thus involving large amount of individual processing. We may need to convert data each time we proceed to next analyses manually. Such obstacles annoy ones to proceed in fast and cost effective manner, and also causing to speed down of research itself. We must keep in mind that any development should contribute to efficiency in research.

2. Can we obtain in-depth understanding of biological systems by employing both top-down and bottom-up approach?

• As mentioned above, both approaches should be well linked to investigate biological systems. Those approaches will be seamlessly combined in future along systems biology research cycle (see next chapter), but we would like to know first that what is the outcome by employing both approach.

3. Can we apply our methods/tools to real cases?

• Development of various tools/methods will speed up and facilitate our research, but at the same time we need to take care of its wide applicability to real cases. One of our aims is to provide the outcome to real cases as a

“useful” one.

(15)

Those questions are simple, yet important starting point for examining systems biology research. To answer the questions, we undergo two steps of research:

1. To develop analysis platform

2. To utilize the platform upon test cases

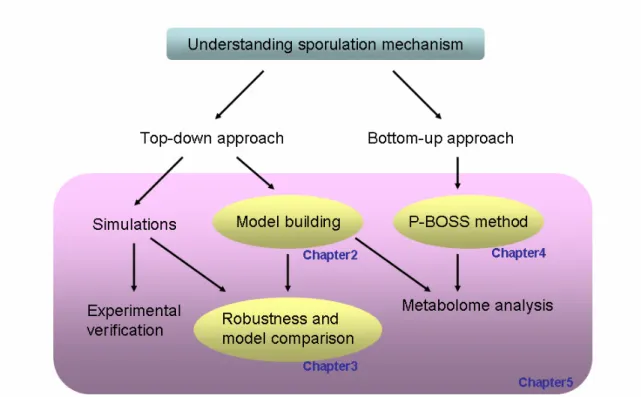
Step 1 could enable us to evaluate question 1, whereas step 2 to evaluate questions 2 and 3. By taking on developing part of systems biology cycle, we believe that we could contribute to further analyses on systems biology field. Ultimately, using sporulation in B. subtilis as a case, our aim is to understand the basis for the bistable mechanisms utilizing above methods. Figure 1 illustrates the structure of this thesis.

Figure 1: Structure of this thesis.

(16)

STRUCTURE

This thesis consists of 6 chapters detailing my work. It begins with an introductory chapter that describes the motivation of research together with background information on systems biology and, in particular, simulation and metabolomics approach. Chapter 2 focuses to the development of modeling platform, which we call

“CellDesigner.” Chapter 3 attempts to examine simulation analysis by comparing two

models of Xenopus using robustness as its plausibility measure. Chapter 4 shifts our

focus to bottom-up approach, and describes how metabolome data processing method

is developed for CE-MS based data. Chapter 5 applies above methods to examine

mechanisms of sporulation in B. subtilis, and combines omics and model driven

approach together. Chapter 6 summarizes the results of the work in previous chapters,

and presents a vision for future research in systems biology field.

(17)

CHAPTER 1: SYSTEMS BIOLOGY AND COMPUTATIONAL APPROACH

The most incomprehensible thing about the world is that it is at all comprehensible.

— Albert Einstein

Systems biology is defined as an approach to elucidate biological systems, such as cells, for “system-level” understanding (Kitano 2002, 2002; Hood et al. 2004).

Progress in molecular and cell biology has led to the identification of complex

biochemical networks involved in the normal functioning of cells, tissues and organs

and even defects associated with many diseases. While those provide a complete list

of factors, a building block, and relationship among each other, it is not enough to

understand the system. Building them all together may lead to unexpected phenomena,

because of its system characterstics – this cannot be identified by only knowing

function of each factor. For instance, system may possibly cause to catastrophic status

upon prescription of drug, which is because complete dynamics/kinetics of system is

not understood. Those side effects are critical particularly in medical/pharmaceutical

field, and thus we must examine how the individual components dynamically interact,

and predict their outcome. Here comes the systems biology approach.

(18)

Figure 2 illustrates the basic research cycle of systems biology, proposed by Kitano (Kitano 2002). Although the cycle resembles that of other science field, even of biology, it is different in a way that comprises both “dry (computational)” and “wet (experimental)” experiments. It is apparent that wide spectrum of technologies is necessary to efficiently conduct the research cycle. We believe following three technologies are inevitable to go for the work:

• Experimental technologies

• Analysis technologies

• Computer technologies

Figure 2: Hypothesis driven research in systems biology.

The image is altered from (Kitano 2002).

Here we will review each technology and discuss what is needed for further research.

Biological knowledge and contradictory issues

Data- and hypothesis- driven modeling

“Dry” experiments (simulations)

System analysis and theory formation

Predictions Experiment

design and experimental device development

“Wet” experiments Experiment data analysis

(19)

E XPERIMENTAL TECHNOLOGIES

Since the discovery of DNA structure by Watson and Crick (Watson and Crick 1953), following decades have been evolution of molecular biology field. Based on reductionism (original idea has been proposed by Dekart, a philosopher), cells were investigated by decomposing into fundamental components, particularly genes. One of traditional methods is to delete each component, and see phenotype of the mutants, comparing with wild type. Baba and colleagues have constructed whole knockout mutants of E. coli (Baba 2006), which could allow us to investigate the functions of components, and mechanisms of intra-cellular networks in detail. This method is plausible to construct, yet phenotype must be distinctly different from that of wild type. Silent mutations, DNA mutations that do not result in a change to the amino acid sequence of a protein, are representative phenomena.

After a half century of evolutionary progress in molecular biology, counterpart approach has appeared – holism. While approach of reductionism is aimed to investigate functions of parts of a system (a cell, in this context), holism is aimed to perform comprehensive analysis of intracellular components, or mathematical analysis to overview the mechanisms as a whole. One of the landmark projects is human genome project (Venter et al. 2001). This project has completed sequencing of human genome in few years, revealing 22,000 genes, which opened a gate to perform

“omics” analysis in biological and medical fields. Currently genomes have been sequenced in more than 100 organisms. In addition to the genome, other -ome technologies have also emerged since then, e.g., transcriptome (mRNAs), proteome (proteins), and metabolome (metabolites).

One of the big differences between approach of reductionism and holism (omics

analysis) is that former approach is hypothesis driven, while the latter approach is data

driven. Similar to the cycle shown in Figure 2, analysis starts from biological

knowledge, or observation of phenomena. Hypotheses are proposed based on the facts,

and experiments are designed to verify the hypotheses. Analyses are performed, from

(20)

which hypotheses are either accepted/rejected. In case they are rejected, the data are accumulated as a feedback to design next experiments. New hypotheses are then proposed again, and research cycles are repeated until hypotheses are accepted. On the other hand, omics approach starts from measurement of data. Since omics data are quite large scale, ranging in order of thousands to ten thousands, data analysis is essential part in the analysis. Detail analysis will give an idea of hypothesis, from which additional experiments are designed. The rest of the cycles will be similar to those of former one. The key idea of omics approach is to overview the data from macro viewpoint. Without the data, appropriate hypotheses cannot be proposed, from micro viewpoint, unless many facts are accumulated upon certain targets. Recently, Ishii and colleagues have carried out variable omics analysis, which, in turn, were then combined, revealing robustness of E. coli in broad sense (Ishii et al. 2007). This kind of omics technologies must be taken carefully, because it contains massive data, and thus could easily lead to misunderstanding of the results (as an example, see Chapter 5).

A NALYSIS TECHNOLOGIES

Systems biology is tightly coupled with mathematical analyses. In order to elucidate the complex mechanisms of cells, various computational and mathematical analyses are indispensable. In particular, control theory is expected to boost revealing fundamental mechanism of intracellular dynamics (Kitano 2004). There are lots of feedback loops exist in cellular networks, which seem to control stability of a biological system – in other words, robustness or homeostasis. Employing idea of control theory from engineering field, a number of applications have been investigated (Barkai and Leibler 1997; Becskei and Serrano 2000; Yi et al. 2000;

Csete and Doyle 2002; El-Samad et al. 2005).

(21)

Bifurcation analysis is another tool to investigate the dynamics of a system in detail.

Because of an intertwined network, complicated dynamics could emerge in most cases. Bifurcation analysis enables us to unravel the complication by decomposing huge parameter space to small spaces. Borisuk and colleagues have performed a detail investigation on Xenopus cell cycle model (Borisuk 1997; Borisuk and Tyson 1998), from which we extended the analysis to the comparison of two cell cycle models (this thesis). It only allows to perturb limited number of parameters at the same time (generally two at most), yet still useful to figure out the system dynamics. Sensitivity analysis might be another tool to be used for similar purpose (for example see (Ma and Iglesias 2002)).

Other than applying control theory to biological systems, which is focusing on dynamics aspect of the systems, topological analysis of networks have been well investigated. A scale-free network is a representative term describing tendency of topology in the Web, which was initially proposed by Barabasi (Barabasi and Albert 1999). In their study, some network nodes had many more connections than the average – Barabasi and colleagues called such highly connected nodes "hubs." In physics, such right-skewed or heavy-tailed distributions often have the form of a power law, i.e., the probability P(k) that a node in the network connects with k other nodes was roughly proportional to k

−γ

, and this function gave a roughly good fit to their observed data. The idea has then been applied to intracellular networks, such as metabolic pathways (Jeong et al. 2000; Barabasi and Oltvai 2004). The works have been extensively investigated, some of which can be found in (Tanaka et al. 2005;

Tanaka et al. 2005). The application to metabolic pathways, however, should be

treated carefully, because definition of network connectivity could easily alter the

results and explanation (Arita 2004, 2005).

(22)

C OMPUTATIONAL TECHNOLOGIES

Computer science plays a fundamental role in various aspects of systems biology research. It has wide spectrum of application area, from modeling to simulations, reverse engineering, visualization, parameter optimization, and database development.

Processing of computational/mathematical analyses needs extensive computing power.

Development of high performance computing is thus necessary to proceed the systems biology research. Parallel computing such as “grid computing” is a solution to provide large-scale number of PCs to exhibit extraordinary performance.

• Folding@home (http://folding.stanford.edu)

• SETI@home (http://setiathome.berkeley.edu)

Above two are the examples, in which more than 1 million PCs join the project in former one. Other than that, ordinary super computers (e.g., Blue Gene in IBM) may play a significant role in extensive data processing.

Modeling and simulations are one of the hot topics in systems biology research. While those activities have been up for more than a decade, recent advances in development of software technologies and platform allow us to work in the field more extensively.

An example is development of model exchange format, as represented by Systems Biology Markup Language (SBML, http://sbml.org) (Hucka et al. 2003), or BioPAX (http://biopax.org). Those formats have been designed to exchange computer models among various type of software tools, including simulators, databases. There are two possible approaches to develop software tools; one for integrating all functions and capabilities to handle by itself, and the other for communicating among various tools.

The formats are for the latter purpose, and the approach seems to work well so far,

being supported by over 100 tools. A reason why the former approach is not common

(or even popular) is that there are still yet to overcome various issues, such as

establishment of modeling theory for intracellular networks. While many attempts

(23)

have accomplished great results, which have also been verified experimentally, it can be applied to small range of areas, and still difficult to establish general theories (such as establishing theory of dynamics of gene expression). Without establishing those theories, various tactics or methodology must be tried – it would then be feasible to have a huge software platform which has all possible functions to handle data, and to perform simulations and various analyses.

Note that although simulations have been employed in many biological studies recently, they do not hold the all answers. Often, when a complex system is simulated, the results are equally difficult to interpret, depending on what question we are trying to answer. We may be able to demonstrate that a given model reproduces the experimentally observed behavior, but we may not understand why – in other word, what features of the model are responsible for the behavior of the system. For this reason, conventional methods of mathematical analysis may, at times, be more appropriate.

The term “reverse engineering” is the process of discovering the technological principles of a device or object or system through analysis of its structure, function and operation. It often involves taking something (e.g., a mechanical device, an electronic component, a software program) apart and analyzing its workings in detail, usually to try to make a new device or program that does the same thing without copying anything from the original. Employing the idea, biological systems are needed to be reverse engineered so that each unit (or module in other words) is to be investigated. At least unless relationship of wiring information being obtained, no further analysis can be carried out –input/output information only can tell nothing, but a just black box of the system. This approach can be readily applied to omics-based data, because omics data exhibit one aspect of a system in comprehensive manner.

Since its progress in DNA chip, or microarray technologies (known as

transcriptomics), there have been vast demand on reverse engineering. While there are

primarily two type of data, time-series data, or steady-state data, some approaches can

be found in following paper (Liang et al. 1998; Morohashi and Kitano 1999; Ideker et

al. 2000; Kyoda et al. 2000; Kyoda et al. 2004).

(24)

It is indispensable to have sophisticated database for searching information on specific species (e.g., genes, proteins, and metabolites). Depending upon type of species and organisms, there are large numbers of database publicly available, some of which are as follows:

• The GDB Human Genome Database (http://www.gdb.org)

Saccharomyces Genome Database (http://www.yeastgenome.org)

• Human Protein Reference Database (http://www.hprd.org)

• Reactome (http://www.reactome.org, reaction database)

• Brenda (http://www.brenda.uni-koeln.de, enzyme database)

• PubChem (http://pubchem.ncbi.nlm.nih.gov, small molecules database)

• KEGG (http://www.genome.jp/kegg)

• BioCyc (http://www.biocyc.org)

Yet, those databases are not fully curated, because of lack of data, or lack of coverage.

KEGG, one of most comprehensive database in the world, has advantages in covering various type of information, from genes to metabolites to proteins, but still lacking in data – only half of metabolites have been assigned for E. coli (Ohashi, personal communication).

Bio-IT companies are interested in providing more sophisticated and more curated database. To cite some of them,

• MetaCyc (GeneGo, http://www.genego.com)

• Ingenuity Pathway Analysis (Ingenuity Systems, http://www.ingenuity.com)

• PathArt (Jubilant Biosys, http://www.jubilantbiosys.com)

• PathwayStudio (Ariadne Genomics, http://www.ariadnegenomics.com)

(25)

The former 3 products are based on manually curated database, while the latter one employs machine learning based text mining approach to gather publication information. They have advantages in terms of providing valuable information, and way to extract information out of database (for example, combining pathway information or experimental data into database, so that more broad view of intracellular mechanisms can be obtained).

A PPLICATIONS OF SYSTEMS BIOLOGY

What would be the applications in systems biology? A big impact would be to contribute in medical and pharmaceutical field (Kitano 2007). While genome-based drug discovery has been paid huge attention as a next generation in pharmaceutical field, no other approaches seem to have been employed successfully so far. This could be because systems biology approach is still a new approach, and takes time to be validated in the field (one pipeline takes over ten years in average). The other reason might be that the field is still too immature to be applied to those fields, although some omics approach have for sure been applied already. Some of industrial activities are introduced in final chapter.

More feasible applications are for basic and fundamental research field. As Kitano

proposed in (Kitano 2002), there are diverse fields to aggregate, most of which are

still in mature. This is more like interdisciplinary field, and needs wide variety of

knowledge and technologies to put in, not only biology (such as molecular biology,

genetics, cell biology), but also computer science, mathematics, physics, chemistry,

and engineering. To be able to advance systems biology research, each field must be

well established to successfully apply to systems biology field. Although this may

take enormously long time to establish, it should allow us to investigate in much more

fast and accurate manner, leading to principle of biological systems – ultimately to

control them.

(26)

CONCLUSION

We have introduced various technologies and methodologies, as a part of systems

biology research. While there are huge efforts being performed, we are still underway

to fully utilize or establish methodology of systems biology. As each individual

relevant technology advances, we believe to be able to perform comprehensive

analysis and application toward various fields, such as medical and pharmaceutical

fields. Our work should be a big step for the systems biology approach from both

computational and analytical viewpoint.

(27)

CHAPTER 2: CELLDESIGNER: DEVELOPMENT OF GENETIC/BIOCHEMICAL NETWORK EDITOR

If you want to understand life, don’t think about vibrant, throbbing gels and oozes,

think about information technology.

— Richard Dawkins

Understanding of logic and dynamics of gene-regulatory and biochemical networks is a major challenge of systems biology. To facilitate this research topic, we developed CellDesigner, a modeling tool of gene-regulatory and biochemical networks.

CellDesigner supports users to easily create such networks using solidly defined and

comprehensive graphical representation (SBGN: Systems Biology Graphical

Notation). CellDesigner is SBML compliant, and SBW-enabled software so that it

could import/export SBML described documents, and could integrate with other

SBW-enabled simulation/analysis software packages. CellDesigner is implemented in

Java, thus it runs on various platforms such as Windows, Linux, and MacOS X.

(28)

INTRODUCTION

While software infrastructure is one of the most crucial components of systems biology research, there has been no common infrastructure or standard to enable integration of computational resources. To solve this problem, the Systems Biology Markup Language (SBML, http://sbml.org) (Hucka et al. 2003) and the Systems Biology Workbench (SBW, http://sbw.kgi.edu) have been developed (Sauro et al.

2003). SBML is an open, XML-based format for representing biochemical reaction networks, and SBW is a modular, broker-based, message-passing framework for simplified intercommunication between applications. More than 110 (as of Jan 2007) simulation and analysis software packages already support SBML, or are in the process to support them.

Identification of logic and dynamics of gene-regulatory and biochemical networks is a major challenge of systems biology. We believe that the standardized technologies, such as SBML, SBW and SBGN, play an important role in the software platform of systems biology. As one such approach, we have developed CellDesigner (Funahashi et al. 2003), a process diagram editor for gene-regulatory and biochemical networks.

DESIGN PRINCIPLES

Broadly classified, CellDesigner was designed according to following requirements:

・ Representation of biochemical semantics

・ Detailed description of state transition of proteins

(29)

・ SBML compliant (SBML Level-1 and Level-2)

・ Integration with SBW-enabled simulation/analysis modules

・ Extreme portability as a Java application

Our aim in developing CellDesigner is to supply a process diagram editor with the standardized technology (SBML in this case) for every computing platform, so that it could confer benefits as many users as possible. By using the standardized technology, the model could be easily used with other applications, thereby reducing the cost to create a specific model from scratch. The main standardized features that CellDesigner supports could be summarized as "graphical notation", "model description", and "application integration environment." The standard for graphical notation plays an important role for efficient and accurate dissemination of knowledge (Kitano et al. 2005), and the standard for model description will enhance the portability of models between software tools. Similarly, the standard for application integration environment will help software developers to provide the ability for their applications to communicate with other tools.

S YMBOLS AND EXPRESSIONS

CellDesigner supports graphical notation and listing of symbols based on a proposal by Kitano and colleagues (Kitano et al. 2005). The definition of graphical notation has now been developed as international community based activities called ‘Systems Biology Graphical Notation (SBGN, http://sbgn.org). Although several graphical notation systems have been already proposed (Pirson et al. 2000; Cook et al. 2001;

Kohn 2001; Maimon and Browing 2001; Kohn et al. 2006), each has obstacles to

become a standard. SBGN is proposed for biological networks designed to express

(30)

sufficient information in clearly visible and unambiguous way (Kitano et al. 2005).

We expect that these features will become part of the standardized technology for systems biology. The key components of SBGN, which we propose, are as follows:

1. To allow representation of diverse biological objects and interactions 2. To be semantically and visually unambiguous

3. To be able to incorporate notations

4. To allow software tools to convert a graphically represented model into mathematical formulas for analysis and simulation

5. To have software support to draw diagrams 6. The notation scheme to be freely available

To accomplish above requirements for the notation, Kitano (Kitano et al. 2005) firstly

decided to define a notation by using process diagram, which graphically represents

state transitions of the molecules involved. In the process diagram representation,

each node represents state of molecule and complex, and each arrow represents state

transition among states of a molecule. In the conventional entity-relationship

diagrams, arrow generally means “activation” of the molecule. However, it confuses

semantic of the diagram as well as limiting possible molecular processes that could be

represented. Process diagram is more intuitively understandable definition than the

entity-relationship diagram – one of the reasons is that the process diagram could be

explicitly represented as a temporal sequence of events which entity-relationship

cannot. For example, a process of MPF factor activation in cell cycle, kinase such as

Wee1 phosphorylates residues of Cdc2 that is one of the components of MPF (Figure

3: A process diagram representation of MPF cycle.). However, MPF is not yet

activated by this phosphorylation. If we use an arrow for activation, we cannot

properly represent the case. In the process diagram, on the other hand, whether a

(31)

molecule is “active” or not is represented as a state of the node, instead of “arrow”

symbol for activation. Promoting and inhibition of catalysis are represented as a modifier of state transition using a circle-headed line and a bar-headed line, respectively.

While process diagram is suitable for representing temporal sequence, either process diagram or entity-relationship approach could be used, depending upon the purpose of the diagram. Both notations could actually maintain compatible information internally, but differ in visualization (Kitano et al. 2005). We propose, as a basis of SBGN, a set of notation that enhances the formality and richness of the information represented.

The symbols used to represent molecules and interactions are shown in Figure 4.

The goal of SBGN is to define a comprehensive system of notation for visually describing biological networks and processes, thereby contributing to the eventual formation of a standard notation. For such a graphical notation to be practical and to be accepted by the community, it is essential that software tools and data resources to be made available. Even if the proposed notation system satisfies the requirements of biologists, lack of software support will drastically decrease its advantages.

CellDesigner currently supports most of the process diagram notation proposed, and

will fully implement the notation in the near future.

(32)

Figure 3: A process diagram representation of MPF cycle.

(33)

Figure 4: Proposed set of symbols for representing biological networks.

(34)

Figure 5: Screenshot of CellDesigner.

Main panel includes various panes, such as species list (left-sided), pathway (center), block diagram (Cdc2 in this case), and notes (right-sided).

SBML COMPLIANT

CellDesigner is an SBML-compliant application – it supports SBML reading and

writing capabilities. SBML is a tool-neutral, computer-readable format for

representing models of biochemical reaction networks, applicable to metabolic

networks, cell-signaling pathways, gene regulatory networks, and other modeling

problems in systems biology. SBML is based on XML (eXtensible Markup

(35)

Language), a simple, flexible text format for exchanging a wide variety of data. The initial version of the specification was released on March 2001 as SBML Level-1. The most recent released version of SBML is Level-2 Version 2. Currently, SBML is supported by over 110 software systems and widely used. CellDesigner uses SBML as its native model description language, and thus once a user create a model by CellDesigner, all information inside the model will be stored in SBML and the model could be used by other software systems without any conversion of the model. As mentioned, CellDesigner draws a pathway with its specialized graphical notation.

Since such layout information has not been supported by SBML, CellDesigner stores its layout information under “annotation” tag, which does not conflict with current SBML specification. There is a working group of layout extension for SBML, and will be incorporated to SBML Level-3. We are currently underway to implement a conversion module to export SBML layout extension from CellDesigner.

CellDesigner has an auto layout function so that it could read all SBML Level-1 and

Level-2 documents whether the model contains layout information or not. By using

this function, users could use existing SBML models such as KEGG, BioModels

database, and so forth. We have converted more than 12,000 metabolic pathways of

KEGG to SBML (the pathways are available from http://systems-biology.org/). Other

SBML models are available from the BioModels Database

(http://www.ebi.ac.uk/biomodels/). We could also use our own SBML models created

by CellDesigner on other SBML compliant applications (http://systems-

biology.org/001/).

(36)

S UPPORTED ENVIRONMENT

CellDesigner is implemented in Java, and could run on many platforms that support JRE (Java Runtime Environment). Currently CellDesigner runs on the following platforms:

・ Windows (98SE or later)

・ MacOS X (10.3 or later)

・ Linux (Fedora Core 4 or later)

The current version of CellDesigner requires JRE1.4.2 or higher, and X Window System for UNIX platforms.

E XPORTING CAPABILITY

Since CellDesigner is supposed to be a “design tool” for representing gene regulatory

and biochemical networks, the pathways described by CellDesigner should be easily

used in various situations. CellDesigner could thus export the pathways in various

formats – currently in JPEG, PNG and SVG format.

(37)

HOW DOES IT WORK?

Building models with CellDesigner is quite straightforward. To create a model, the user selects "New" from "File" menu, inputs the name of an SBML document – a new canvas will then appear. The user could then place a species, such as a protein, gene, RNA, ion, simple molecule and so forth. A new window will appear asking the name of the species. The size of each species could be changed by clicking and dragging the corner of species. The user could also define the default size of each species from

"Show Palette option" from the “Window” menu. Species could be moved by dragging and dropping

To draw reactions, a type of reaction should first be selected from the UI buttons, and a reactant species then clicked, followed by a product species. To add more reactants, the user could select "Add reactant" button, and then choose species and reaction.

As mentioned above briefly, the modeling process with CellDesigner is straightforward steps, which should not cause users any confusion.

CellDesigner could also represent common types of reactions, such as catalysis,

inhibition activation and so forth. The procedure for representing such reactions is just

as same as adding reactants or products to an existing reaction; that is, to select a

species (modifier), followed by a reaction. The user could also easily edit the symbols

for proteins with modification residues, and hence, could describe detailed state

transitions between species of an identical protein by adding different modifications.

(38)

The models are stored in an SBML document, which contains all the necessary information referring to species, reactions, modifiers, layout information (geometry), state transitions of proteins, modification residues and so forth. These SBML models could be used on other SBML-compliant applications.

If users want to run simulation based on the SBML model, select Simulation menu, which, in turn, calls SBML ODE Solver directly. The Control Panel appears, enabling users to specify the details of parameters, to change amount of specific species, to conduct parameter search, and to run simulation interactively. To conduct time evolving simulation, users may need to know basics of the SBML specification (See http://sbml.org for detail).

If users select SBW menu, on the other hand, CellDesigner passes the SBML data to the SBML compliant tools via SBW, while you need to set up SBW before you invoke SBW connection.

WHAT DISTINGUISHES CELLDESIGNER'S TECHNOLOGY FROM OTHERS CURRENTLY AVAILABLE?

Currently, many other applications exist that include pathway design features. The advantages of CellDesigner over other pathway design tools could be summarized as follows:

• Based on standard technology (i.e., SBML compliant and SBW enabled),

• Supports clearly expressive and unambiguous graphical notation systems (SBGN),

which is aimed at contributing to eventual standard formation

(39)

• Runs on many platforms (e.g., Windows, MacOS X, Linux)

As described above, the aim of the development of CellDesigner is to supply a process diagram editor with standardized technology for every computing platform, so that it will benefit as many biological researchers as possible. For instance, tools such as E-Cell (Tomita et al. 1999) is SBML-compliant, and tools such as Cytoscape (Shannon et al. 2003) runs on multiple platforms

These tools are powerful in some aspects and they are not intended to support the features as CellDesigner. Some of them have the facility to create pathways, and some also include a simulation engine or database integration module. CellDesigner does include a simulation engine provided by SBML ODE Solver development team, and also it could connect to other SBW-enabled applications so that user could switch the simulation engine on the fly. Furthermore, we have been converting existing databases to SBML (e.g., KEGG), and all SBML-compliant applications could easily be browsed, edit the models, and even simulate via CellDesigner.

The overriding advantage of CellDesigner is that it uses open and standard technologies. The models created by CellDesigner could be used on many other (over 110) SBML compliant applications and its graphical notation system will make the representation of models in more efficient and accurate manner.

FUTURE WORK

In future release of CellDesigner, we plan to implement further capabilities.

Improvement of auto layout function is a big issue – the bigger (e.g. > few hundreds

of nodes) the network diagram becomes, the slower the performance of CellDesigner

(40)

becomes, which causes our current version not to align each nodes and edges quite well. Integration with other modules is also underway, such as other simulation, analysis and database modules. Current version of CellDesigner has been implemented as a Java application, while we are developing a JWS (Java Web Start) version of CellDesigner so that it could be used as a web-based application as well.

To be widely used from biologists to theorists, we believe that it is essential to meet the standard. We are thus actively working as SBML and SBGN working group members, which aims to establish de facto standards in systems biology field – former one seems to have already become de facto as model description language. SBML Level-3 (next version) will include layout extension, and we will incorporate the functions in our new release of CellDesigner. BioPAX (http://ww.biopax.org) is another big activity, which tries to connect widely distributed data resources seamlessly. We also plan to connect CellDesigner with BioPAX data format so that users could use CellDesigner from BioPAX platform and vice versa.

From software development perspectives, providing API, plug-in interface or open source strategy might be a solution to speed up the development, and enable users to customize the software depending on users needs. While we have been providing binary program of CellDesigner so far, we are now working to extend our development scheme in such manner.

We wish CellDesigner to be used by anyone who is working on biology-related field.

As described throughout this manuscript, CellDesigner is designed to be user-friendly

as much as possible, thus allowing users to draw pathway diagrams quite easily as

drawing with other drawing tools, such as Microsoft Visio, or Adobe Illustrator. Since

our proposed notation itself is rigidly defined, the diagrams could be used for

(41)

presentation or even for knowledge base – the diagrams could be used as figures in manuscript, or pathway representation of databases. Since definition of the pathway diagram notation is now getting much attention, which has now resulted to form an SBGN working group (http://sbgn.org), we hope the notation will be much refined as a de facto standard representation, which will be reflected in the representation manner of CellDesigner as well.

Our concept for developing CellDesigner is "easy to create a model, to run simulation and to use analysis tools." This will be achieved by extending the development of corresponding native libraries or SBW-enabled modules. Improvement of the graphical-user interface is also required, including the mathematical equation editor, so that the user could easily write equations by selecting and dragging a species.

CONCLUSION

We introduced CellDesigner, a process diagram editor for gene-regulatory and biochemical networks based on standardized technologies and with wide transportability to other SBML-compliant applications and SBW-enabled modules.

Since first release of CellDesigner, 12,000 downloads has been already accomplished.

CellDesigner also aims to support standard graphical notation. Since the standardization process is still underway, our technologies are still changing and evolving. As we are in partnership with SBML, SBW, and SBGN working groups, we will go through with these standardization projects and hence improve the quality of CellDesigner.

(42)

CHAPTER 3: SIMULATION ANALYSIS OF CELL CYCLE MODEL OF XENOPUS

Only those who dare to fail greatly can ever achieve greatly.

— John F. Kennedy

Theory, experiment, and observation suggest that biochemical networks which are

conserved across species are robust to variations in concentrations and kinetic

parameters. Here, we exploit this expectation to propose an approach to model

building and selection. We represent a model as a mapping from parameter space to

behavior space, and utilize bifurcation analysis to study the robustness of each region

of steady-state behavior to parameter variations. The hypothesis that potential errors

in models will result in parameter sensitivities is tested by analysis of two models of

the biochemical oscillator underlying the Xenopus cell cycle. Our analysis

successfully identifies known weaknesses in the older model and suggests areas for

further investigation in the more recent, more plausible model. It also correctly

highlights why the more recent model is more plausible.

(43)

INTRODUCTION

In recent years, a series of landmark papers have reported the existence of robust behaviors in a variety of biochemical networks (Alon et al. 1999; von Dassow et al.

2000; Yi et al. 2000). Indeed, robustness in metabolism (Fell 1997), the cell cycle (Borisuk and Tyson 1998), and inter-cellular signaling (Freeman 2000) is now widely accepted. Of course, nothing can be robust to absolutely all variations. Some variations may not matter in terms of the functionality of the system in question. For example, the process that specifies the geometric relationship between hair follicles on human heads need not be very exact or robust. Nor is there any guarantee that all biological systems are necessarily optimally organized. A well-known example of this is the apparently inverted layered structure of the human retina. In this paper, we are interested in robustness to variations in kinetic parameters. That biochemical networks will exhibit robustness to variations in their kinetic parameters was theoretically predicted long ago (Savageau et al. 1972; Kacser and Burns 1973).

However, these issues have recently received more widespread attention (Hartwell et al. 1999; Dearden and Akam 2000) due to the growing need to understand the large volumes of data produced by the emerging biotechnologies.

While we tend to think primarily of functionally distinct cellular processes such as metabolism, or the cell cycle, the reality is that all cellular processes are highly interrelated and involve not only biochemical interactions, but also mechanical, electrophysiological, and other interdependencies across multiple time and space scales. Nonetheless, “if we are to comprehend [molecular biology], we must hope that it can be dissected into a series of modules or networks which can be studied in relative isolation” (Dearden and Akam 2000).

Recent discoveries of modular interspecies conserved networks suggest that such

hope may not be in vain. The fact that such networks perform homologous functions

(44)

with similar but differing proteins (hence different reaction rates) and in different cellular contexts (hence different total concentrations of chemical species) suggests functional robustness to such variations.

The chemical oscillator underlying the control of cleavage-stage cell divisions in Xenopus embryos is a well-known example of a robust biochemical module: its component proteins can be replaced by proteins from other species (e.g. human) without affecting its function, and its oscillatory behavior can be reproduced in vitro (Murray and Hunt 1993). In this paper, we compare two models of the Xenopus cell cycle oscillator to evaluate the feasibility of using robustness as a means of identifying potential weaknesses in models. Our approach extends the use of bifurcation analysis for model evaluation by Ringland (Ringland 1991) and Clarke (Clarke 1980, 1994) to include observations about the shape, smoothness, and other features of behavior regions in parameter space. The results suggest that the approach can help with iterative development of increasingly detailed models of cellular processes, and selection between alternative explanations (models) of experimentally observed phenomena.

MATERIALS AND METHODS

The analytical solution of the parameter space for the two-equation version of the

1991 model was derived using Maple (Maplesoft, Ontario, Canada). All other

numerical characterizations of the parameter spaces of the two models were

performed using the AUTO bifurcation analysis package (Ermentrout 2002). The

frequency contour plots were generated as co-dimension two bifurcation plots on

which the frequency of oscillation was superimposed post hoc. Oscillation

frequencies were calculated by sampling the oscillatory region of each plot in a 100x

100 or a 50x50 grid, grouping the results into bins, and then using the AUTO to trace

the loci of each frequency bin. Numerical parameter optimizations were carried out

interactively using Berkeley Madonna (http://www.berkeleymadonna.com/).

(45)

RESULTS

W HAT S HOULD B IOCHEMICAL N ETWORKS BE R OBUST TO ?

It would be impractical and undesirable for systems to be equally robust to everything.

For example, a system should be sensitive to particular types of variation in its inputs, otherwise, it would not respond to anything. On the other hand, there is also no reason to believe that all cellular processes will be optimally robust to everything. In this section, we delineate where one can expect robustness or sensitivity and discuss the implications.

To begin, we define a biochemical model as a mapping from parameter space to behavior space. The structure of a network is given by the set of all non-zero elements in its stoichiometry matrix (i.e. the set of interactions in the network). The parameters define reaction kinetics and total (initial) concentrations of the chemical species constituting the modeled network. Two types of parameters may be noted:

(A) Parameters whose values vary during the lifetime of an individual (e.g.

temperature, regulated gene activity level, or amount of a protein in a particular state).

(B) Parameters that are constant for individuals, but variable across individuals/species (e.g. reaction rate constants (k

cat

; k

m

), initial/total concentrations).

Any “parameter” that does not vary across individuals or across species is considered

a constant here. Inputs are parameters that control the system state trajectory. The

inputs to a network can be type A or type B parameters. Sensitivity to type A inputs is

useful for behavioral adaptation, while sensitivity to type B inputs can generate

diversity in populations without loss of function.

(46)

Carlson & Doyle (Carlson and Doyle 2000) have proposed that robustness to common variations is achieved at the cost of added system complexity. The additional complexity will generally incur some new sensitivity. Optimally robust systems are those that achieve a useful balance between robustness to frequent variations and the concomitant sensitivity to some rare events. A corollary of this view is that natural systems tend to be highly robust to frequently occurring variations and, in counterbalance, fall catastrophically when some rare variations occur. We exploit this observation to say that if a model of a robust system (e.g. a conserved biochemical network) exhibits sensitivity to a parameter p; one of the following must hold (see also (Alves and Savageau 2000)):

(1) p is a control input; in that case the model should be sensitive to p: The type of sensitivity will depend on the functionality of the modeled network. Systems that switch between a finite numbers of states tend to be sensitive to the level of inputs, but not the exact value of any input. On the other hand, systems with continuous outputs (e.g. an amplifier) tend to be sensitive to the exact value of the input(s).

(2) p is regulated (held constant) elsewhere in the system. A familiar example from engineering is power supply provision in electronic circuits: sub-circuits depend critically on receiving a supply voltage held constant by dedicated circuitry. An analogous biochemical example may be the provision of metabolic “services” in cells.

(3) p is not regulated, but the system as a whole is insensitive to p (e.g. soot buildup in a heater will tend to affect heater performance, but not room temperature). In that case, the modeled network is actually a part of a larger system and should be studied in this larger context.

(4) We have misunderstood the function of the network. For example, suppose a

system is designed to provide pressure and temperature compensation signals to other

systems on an aircraft. We might model the network as only a pressure compensator,

and then discover that it is also sensitive to temperature. In such a case, it is not that

our model of pressure compensation is wrong, but rather that we have misunderstood

the full function of the system.

(47)

(5) The model structure is incorrect (e.g. there may be missing components, or incorrect interactions between existing components).

It is often possible to guess whether a model parameter may be a control input from the nature of the processes it controls. For example, the rate of transcription of a gene, the rate of synthesis of a protein, and the initial concentration of a maternally inherited factor are all parameters which are often controlled by upstream biochemical processes and which can usefully control processes such as developmental cell fate specification.

On the other hand, enzyme-mediated reaction rates vary widely among individuals and species (Eanes 1999), so any biochemical network whose function is conserved across individuals and species may be expected to be highly robust to variations in reaction rates. Similarly, variations in total concentrations of locally synthesized chemical species should not affect the behavior of a structurally correct model dramatically.

When a biochemical model exhibits sensitivity to some of its parameters, one of conditions (1)-(5) above must hold. One may then investigate each possibility in turn.

However, sensitivity and robustness are not “all or none”, binary characteristics.

Below, we define quantitative measures that allow more exact characterization of the

type and extent of sensitivity/robustness exhibited. This greater resolution in turn

provides greater insight into the potential cause of the observed sensitivity, as

illustrated by our example analysis of models of the Xenopus cell cycle.

(48)

M EASURING R OBUSTNESS AND S ENSITIVITY

Consider an example system with only two parameters P

1

and P

2

. Suppose the system has a steady state which can be characterized by a single variable, say a concentration level, or an oscillation frequency. Two-parameter bifurcation plots delineate the range of P

1

and P

2

for which the system exhibits the measurable behavior. Figure 6 shows two example behavior loci for such a system. The figure is drawn such that the colored regions in (A) and (B) are roughly equal in area. The crosses represent example operating points, that is, the mapping from the particular values of P

1

and P

2

to a particular value for the measurable system characteristics. The arrows show the effect of example variations (noise) in P

1

on the location of the operating point. The model in (A) has two important features:

(1) Define the minimum distance between an operating point and the boundary of the behavior locus as the stability margin (SM) of the operating point. The optimum stability margin (OSM) of the model is then defined as the maximum stability margin achievable by judicious placement of the operating point. The OSM is greater for the convex locus in (A) than for the concave locus in (B). Moreover, the sum of all stability margins is greater for (A) than for (B). Therefore, the model exhibiting characteristic (A) has greater overall stability than the model exhibiting characteristic (B).

(2) For the particular drawings in this example, we note that the rate of change of the

measured characteristic with changes in P

2

is lower in (A) than in parts of (B). Which

of the two models is more plausible depends on the extent of behavioral variability

observed experimentally.

(49)

Figure 6: Schematic representation of two example behavior loci.

The symbol ‘x’ represents example operating points, mapping from the particular values of P

1

and P

2

to a particular value for the measurable characteristics. As the operating points shift from the points, quantitative measure of the behavior changes – sensitivity to the variation of parameters greatly affect behavior depending on the shape of loci.

Where a modeled system exhibits multiple steady state behaviors, there will be one or more loci for each behavior in parameter space and it would be necessary to consider issues such as (1) and (2) (above) for each locus. Often, the multiple behaviors exhibited by a model border each other. Clearly, in such cases convexity of one region would imply concavity in the neighboring region(s). In such cases (as for example in the cell cycle models below), optimum robustness for all model behaviors requires that the boundaries between behavioral regions in parameter space be flat (i.e. neither concave nor convex). The boundaries between neighboring behavior regions are parameter bifurcation loci and can be computed and plotted in two dimensional slices for visual assessment. For examples, see our cell cycle oscillator analysis below.

For parameters acting as state switch (control) inputs, once a system has switched states, it should be robust to small variations (“noise”) in the input signals, i.e., we require large stability margins for each switched state. Finally, we use Ockham’s Razor to distinguish between any two models which may match experimental

A B

Figure 1: Structure of this thesis.
Figure 3: A process diagram representation of MPF cycle.
Figure 4: Proposed set of symbols for representing biological networks.
Figure 5: Screenshot of CellDesigner.
+7

参照

関連したドキュメント

Keywords and phrases: super-Brownian motion, interacting branching particle system, collision local time, competing species, measure-valued diffusion.. AMS Subject

Analogs of this theorem were proved by Roitberg for nonregular elliptic boundary- value problems and for general elliptic systems of differential equations, the mod- ified scale of

Then it follows immediately from a suitable version of “Hensel’s Lemma” [cf., e.g., the argument of [4], Lemma 2.1] that S may be obtained, as the notation suggests, as the m A

Definition An embeddable tiled surface is a tiled surface which is actually achieved as the graph of singular leaves of some embedded orientable surface with closed braid

0.1. Additive Galois modules and especially the ring of integers of local fields are considered from different viewpoints. Leopoldt [L] the ring of integers is studied as a module

Correspondingly, the limiting sequence of metric spaces has a surpris- ingly simple description as a collection of random real trees (given below) in which certain pairs of

Since the continuum random tree is a random dendrite, the results of the previous chapter are readily applicable and so we are immediately able to deduce from these heat

While conducting an experiment regarding fetal move- ments as a result of Pulsed Wave Doppler (PWD) ultrasound, [8] we encountered the severe artifacts in the acquired image2.