• 検索結果がありません。

Pulmonary Vascular Input Impedance in Patients with Atrial Septal Defect

N/A
N/A
Protected

Academic year: 2021

シェア "Pulmonary Vascular Input Impedance in Patients with Atrial Septal Defect"

Copied!
7
0
0

読み込み中.... (全文を見る)

全文

(1)

Acta Med. Nagasaki 39: 107-113

Pulmonary Vascular Input Impedance in Patients with Atrial Septal Defect

Tadaki MATSUZAKI

The 2nd Department of Internal medicine, Nagasaki University School of Medicine

Pulmonary vascular input impedance was measured in adults with artial septal defect (ASD) to examine their pulmonary vessel lesions. Pulmonary vascular input imped- ance is a measure of the resistance of the pulmonary artery detected in the form of pulse wave. This test is more physio- logical than the conventional test of total pulmonary vascu- lar resistance. The following results were obtained.

1. The pattern of pulmonary vascular input impedance did not differ between the ASD group and the normal control group.

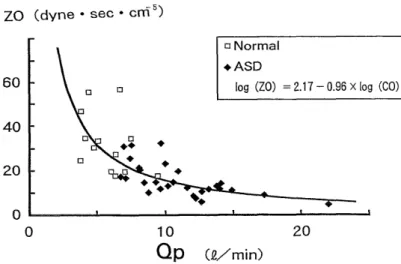
2. An increase in pulmonary artery blood folw volume (a major sign of ASD) resulted in a decrease in Z0 (the average of the pulsatile fraction of the pulmonary vascular input impedance), leading to suppressed elevation in the pulmo- nary artery pressure.

3. These features of pulmonary vascular input impedance remained unchanged when age advanced. Therefore, if Z0 is higher than its expected from the pulmonary blood flow volume, some accompanying lesions other than ASD may be responsible for such a change.

Introduction

According to the known natural history of atrial septal defect (ASD), patients with ASD show increased pulmo- nary vascular resistance, pulmonary regurgitation, re-

duced right ventricular output, right-to-left shunt, and atrial flutter or fibrillation in the latter half of their 20s

or in their 30s. Gradual progression of their pulmonary vascular lesions greatly affect the prognosis of these patients. To assess pulmonary vascular lesions in detail and to accurately assess the afterload at the time of blood ejection from the right ventricle in patients with ASD, it is essential to consider impedance which is an indicator of pulmonary vascular resistance expressed in the form of pulse wave. Pate et al.'), Berga et al.2) previously measured pulmonary vascular input impedance of the pulmonary vascular bed of dogs. Its measurement in clinical patients has seldom been performed because of the limitations imposed by the instruments needed for this measurement.

Due to recent advances in multi-sensor catheters, however, it is now relatively easy to measure pulse wave clinically.

In the present study, pulmonary vascular input impedance was measured in patients with ASD, using a multi-sensor catheter.

Subjects

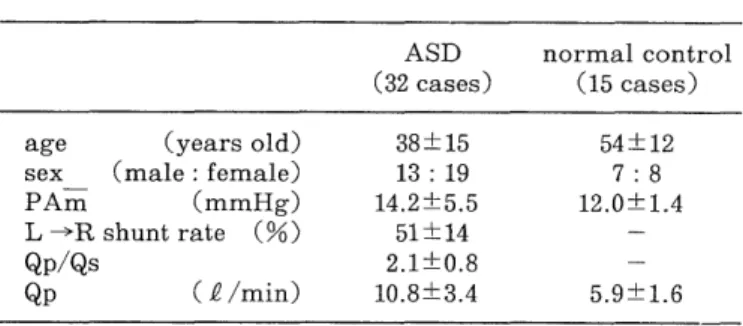
The subjects were 32 patients with ASD who had under- gone cardiac catheterizatiori. In all patients, ASD was a secundum defect, without being accompanied by any other malformation. All patients were in a chronic stable state of ASD, without showing any sign of heart failure. Sinus rhythm was noted in all subjects. Table 1 shows the profiles of the subjects. Their age was 38 ± 15 years (4 cases between 10 and 19, 9 cases between 20 and 29, 4 cases between 30 and 39, 5 cases between 40 and 49, 8 cases between 50 and 59, and 2 cases between 60 and 69). There were 13 males and 19 females. The pulmonary artery pressure was often normal and averaged 14.2±5.49 mmHg.

The left-to-right shunt rate was 51--±--14 %. The ratio of system blood flow to pulmonary blood flow was 2.1 ± 0.77.

Pulmonary blood f low was 10.8 ± 3.361/min. The left-to- right shunt rate was over 10 % in 5 cases. The normal control group was composed of 15 individuals in whom a detailed examination at our department on the basis of suspicion of ischemic heart disease or other disease re- vealed no abnormalities. Informed consent was obtained from each patient before the study.

Tab. 1 Subjects

ASD normal control

(32 cases) (15 cases)

age (years old) 38±15 54±12

sex _ (male : female) 13 : 19 7 : 8

PAm (mmHg) 14.2±5.5 12.0±1.4

L - R shunt rate (%) 51±14 -

Qp/Qs 2.1±0.8 -

Qp (P /min) 10.8±3.4 5.9±1.6

(Values are mean ± SD)

(2)

Methods

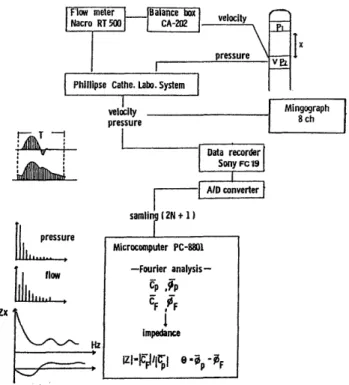
1. Measurement of pulmonary vascular input impedance After the diagnosis was established by routine right cardiac catheterization, pulmonary vascular input imped- ance was measured (Fig. 1). The zero balance of flow velocity was calibrated in physiological saline. A multi- sensor catheter was subsequently inserted into the pulmo- nary atrery. A flow velocity sensor was placed at a point of the upper margin of the sinus trunci pulmonalis where the flow velocity wave was maximal. In this way, the pulmonary artery pressure and the flow velocity pattern were recorded simultaneously. A Millar VPC-684C multi- sensor catheter (2 pressures and 1 velocity) was used.

2. Analysis of impedance

On pressure-velocity curves, the impedance was ana- lyzed, according to the block diagram shown in Fig. 1. The flow meter used for this study was a Narcomatic RT500 (Narco Bio-System). The frequency response characteristic of this flow meter was approximately flat up to 30 Hz. A pressure-velocity curve was recorded together with an electrocardiogram, using a Mingograph 8Ch. The data were fed through a Logitec digitizer Mypad-A3 into a microcomputer, followed by Fourier analysis and calcula- tion of pulmonary vascular input impedance.

Fig. 1 Sampling and analytic method of pulmonary arterial input impedance.

T. Matsuzaki : ASD, Pulmonary vascular input impedance The first step of obtaining pulmonary vascular input impedance was Fourier transformation of the pulmonary artery pressure (P) and flow volume (F) curves, using the following equations

00

CP (t) = Po + E CPn sin (nc) t + 0Pn) (1) n=1

00

CF (t) = Fo + E CFn sin (n cut + OFn) (2) n=1

where Po and Fo denote the average pressure and flow volume, CPn and CFn indicate the high frequency ampli- tude of pressure and flow volume, 95 P and 0 F indicate the topological angle of pressure and flow volume, and w indicates the basal frequency.

The impedance for each harmonic can be calculated as follows, using Equations 1 and 2 :

IZI=ICFI/ ICPI=OP-OF

Each velocity and pressure wave were sampled on electro- cardiograms, regarding an R-R intervals as one cycle.

Considering noise, the analysis was done for the range from 10 to 20 Hz. Each value of impedance was obtained by averaging the data for 5-10 cardiac beats. The conversion of flow velocity into flow volume was calibrated using the relationship between pulmonary. blood volume and mean blood flow velocity, simultaneously measured using the method of Fick. The following indicators were obtained from the impedance curve :

ZO (dyne • sec • cm-5) : characteristic impedance, an arithmetical mean of the modulus for 2-10 Hz pulsation

fmin (Hz) : the frequency for the first minimal modulus of the pulsatile fraction

The inner diameter of the pulmonary trunk was meas- ured, using digital subtraction angiography (DSA).

All data were expressed as mean ± SD. For statistical comparison of the variables, Student's t-test was used.

Differences in data and correlation coefficients were considered significant at P less than 0.05.

Results

1. The pattern of pulmonary arterial input impedance in the control group

Fig. 2 shows the pulmonary vascular input impedance

for a normal control. The upper column of this figure

shows a modulus curve. The input resistance (Rin) was the

modulus at 0 harmonics and was equal to the total

pulmonary vascular resistance. The modulus decreased

sharply in the pulsatile fraction and formed the first

trough at about 3-4 Hz (fimin). It subsequently increased,

depicting a gentle curve. The mean ZO for 15 normal

(3)

Fig. 2 Pulmonary vascular input impedance curve in a patient belonging to control group.

Fig. 4 Characteristic impedance value in atrial septal defect and normal subjects.

Fig. 3 Pulmonary vascular input impedance curve in 2 patients with atrial septal defect.

controls was 31 ±14 dyne • sec • cm-', and the mean f min for the same was 3.6 ± 1.1 Hz. The lower column shows phase differences. In the low frequency range, the curve was negative, which indicates that the flow volume wave preceded. At a frequency approximately equal to fmin, it crossed the zero point towards the positive zone, showing a gentle curve thereafter.

2. The pattern of pulmonary arterial input impedance in ASD

Fig. 3 shows the impedance pattern for one ASD patient wtih normal average pulmonary artery pressure and one ASD patient accompanied by pulmonary hypertension. The mean ZO for 32 ASD patients was 10±10 dyne • sec • cm-5.

ZO was significantly lower in the ASD group as compared to the normal controls (Fig. 4). The mean fmin for the 32 ASD patients was 4.2 ± 0.94 HZ, which did not differ

significantly from the normal control group and did not

correlate with any other cardiovascular parameter. The

pattern of impedance was similar for both the ASD group

and the control group.

(4)

Fig. 5-a The relationship between left to right shunt rate and Characteristic impedance in atrial septal defect.

Fig. 5-b The relationship between pulmonary blood flow and Characteristic impedance in atrial septal defect.

Fig. 5-c The relationship between total pulmonalry vascular resistance and Characteristic impedance in atrial septal defect.

3. The relationship between circulatory indices and charac- teristic impedance (ZO) in the ASD group

Factors which might affect ZO were explored. Fig. 5-a, b, c show the relationship of ZO to the left-to-right shunt rate, pulmonary blood flow volume (Qp) and total pulmo- nary vascular resistance (TPVR) for the ASD group, respectively. ZO had a significant negative correlation with the left-to right shunt rate and the pulmonary blood flow

volume. ZO had a positive correlation with the total

pulmonary vascular resistance. ZO had no correlation with

any other parameter examined (age, sex, pulmonary

arterial pressure, right-to-left shunt or pulmonary arterial

oxygen saturation). The relationship between pulmonary

blood flow volume and ZO was defined by a similar expo-

nential function in both the control group and the ASD

group (Fig. 6). The hypothesis that this relationship

differs between the groups was rejected at a significance

(5)

Fig. 6 The relationship between pulmonary blood flow and Characteristic impedance.

Fig. 7 The relationship between pulmonary arterial dimension and Characteristic impedance in atrial septal defect.

level of 5 %. This means that the relationship between pulmonary blood flow volume and ZO in both groups was depicted by the same curve.

4. The inner diameter of the pulmonary trunk

These were greater in some ASD patients as compared to the normal controls. However, this parameter was not related with ZO.

Discussion

Pulmonary circulation is not subjected to complicated and sensitive regulation by the nerve system, which is seen

for systemic circulation. The influence of chemical factors

on pulmonary circulation is usually small, excluding the

close involvement of hypoxemia in pulmonary circula-

tion'). These facts suggest that blood flow through pulmo-

nary circulation is primarily determined by mechanical

factors such as the pulmonary artery and the pulmonary

vascular bed. For this reason, the pressure-flow volume

relationship is important when we analyze pulmonary

hemodynamics. The pressure-flow volume relationship in

pulmonary circulation is usually expressed by pulmonary

peripheral vascular resistance, when constant blood flow is

assumed. In practice, however, resistance varies depending

on the flow volume. Pulmonary vascular input impedance,

which is obtained on the assumption that pulmonary blood

flow is pulsatile, is expected to serve as a more

(6)

physiological indicator of pulmonary hemodynamics.

Theoretical attempts to analyze the impedance of pulmo- nary artery have been reported by several investigators.

The reports made by Womersley') and Caro et al') demon- strated the linearity of pulmonary circulation in experi- mental animals. The first report of measuring pulmonary artery input impedance in clinical cases was published by Milnor et al.'). Their data have some problems related to the accuracy of measurement because they obtained flow velocity waves from the phase differences of pressure waves obtained with a fluid catheter. The recent develop- ment of multi-sensor catheters has made it possible to measure pressure and flow velocity at a time, using a single catheter. Murgo et al.') and Wilcox et a18) have reported such measuremnt.

When the changes in blood flow velocity, as measured in the pulmonary artery using a multi-sensor catheter, are converted into chronological changes in pulmonary blood flow volume, it is prerequisite that the flow velocity varies little along the entire cross-section of the blood vessel to be measured (the pulmonary trunk in the present study). In this connection, Reuben') reported that the velocity profile across the diameter of the pulmonary trunk is almost flat. It is therefore possible to convert the flow velocity at a given point of the blood vessel into a flow volume.

In the present study, 32 patients with ASD were evalu- ated. Diseases which accompany ASD and affect pulmo- nary circulation include malformations (e. g., valvular disease), abnormal rhythms (e. g., atrial flutter and atrial fibrillation) and hypoxemia due to severe right-to-left shunt. In the present study, only patients with secundum defect who had sinus rhythm were included in the ASD group. When the influence of reflection is small, the flow velocity wave resembles the pressure wave, and the abso- lute value of impedance is not changed much by changes in frequency. Furthermore, deviation is close to zero in this setting. Although reflective waves elevate pressure and reduce flow velocity, compliance is higher for pulmonary circulation than for systemic circulation, resulting in a smaller pulse wave velocity for pulmonary circulation. For this reason, the influence of reflective waves does not appear soon after the start of ejection, and the blood flow volume wave is almost completely equal to the pressure wave from its rising point to a point near the peak, despite the fact that the distance to the periphery is short in pulmonary circulation. Most of the present patients with ASD showed a single-peak velocity wave which was ap- proximately zero at diastole and resembled the right ventricular pressure pattern. Patients accompanied by pulmonary hypertension showed a two-peak flow pattern.

ZO is usually calculated, using the frequency domain method, by which ZO is obtained as an arithmetical mean of the modulus for a range of frequency. Theoretically, high frequency ranges which are less affected by reflective

waves are suitable for this calculation. In the present study, an arithmetical mean of modulus was obtained for a 2-10 Hz range, as proposed by Tagawa10). This frequency range was selected because it contained frequencies and it is unlikely to be affected by noise. The ZO calculated in this way for the normal control group was approximately equal to that reported by Murgo et al.'s and Wilcox et al!). The impedance pattern for the ASD group was similar to that for the normal controls, while ZO was lower for the ASD group.

Since ZO is considered to represent the extensibility of the vascular wall near the measuring point, a decrease in ZO seems to be attributable to an elevated compliance of the vascular wall with the palsatile flow. When we ana- lyzed specific factors to ASD were to analyzed to clarify

those responsible for the decrease in ZO, it was found that the L-R shunt rate and the pulmonary blood flow volume (Qp) correlated negatively with ZO, and that total pulmo- nary vascular resistance (TPVR) correlated positively with ZO. In the presence of ASD, the elevation in pulmo- nary artery pressure is small relative to the increase in pulmonary blood flow volume. For this reason, changes in TPVR in ASD patients can be largely attributed to the pulmonary blood flow component. Thus, all 3 of these factors seem to be related to pulmonary blood flow volume. These findings suggest that pulmonary vascular input impedance is closely related to pulmonary blood flow volume. Because the impedance pattern for the ASD group did not differ greatly from that for the control group, we ..plotted ZO against Qp for both groups on the same graph

(Fig. 6). This revealed that the plots for both groups lay on the similar exponential curve. This suggest that the response of the pulmonary trunk to elevated pulmonary blood flow volume in ASD patients does not substantially differ from that in normal controls, but that the former represent a slight modification of the latter. In normal pulmonary artery, therefore, the impedance decreases as a result of increase in pulmonary blood flow volume, thus allowing the pulmonary artery to function as a capacitive vessel which receives blood from the right ventricle with- out elevating the pulmonary artery pressure. This seems to occur when the pulmonary blood flow volume is less than 3 or 4 times the normal volume. In this respect, ASD differs from diseases such as ventricular septal defect in which the pulmonary artery is directly loaded with part of the left ventricular pressure at systole. Because of this feature, ASD is less likely to be complicated by pulmonary vascular lesinos. When age-matched analyses of pulmo- nary blood flow volume, shunt rate, etc. were performed, none of the pulmonary artery pressure, TPVR and ZO had any correlation with any particular age group. This probably explains why patients with ASD maintain the reactivity of the pulmonary trunk from birth to adult- hood, and that low pressure and high flow are often

maintained even at advanced ages. Therefore, patients

(7)

with ASD accompanied by pulmonary hypertension (ex- cluding patients in whom ASD is quite extensive) may have some abnormalities of the pulmonary artery. ZO, which is considered to reflect the vascular characteristic at a measuring point, is defined as follows according to the theoretical equation prepared by Womersley on the basis of a model experiment" :

CO 1 1/2

ZO =

7t R2 (1- Q2) (M'10) 1/2 e- 10 p : fluid density a : poisson ratio CO: wave velocity

According to this equation, ZO decreases as the cross- sectional area of the trunk increases, while ZO increases with wave velociry. As is noted on chest X-rays, patinets with ASD usually show dilatation of the pulmonary trunk through the peripheral pulmonary artery. This was sup- ported by the present study. Unlike the theoretical equa- tion of Womersley, the present analyses revealed no

relationship of decreased ZO with the diameter of the pulmonary trunk, the square of its diameter or the retio of pulmonary trunk diameter to body surface area. Also no evident relationship was noted between pulmonary blood flow volume and pulmonary artery diameter. However, injection of contrast material may have slightly dilated the pulmonary artery, leading to some errors in measure- ment. Although dilation of the pulmonary artery may be indispensable for ZO of ASD patients to decrease, it will be difficult to simply compare this among different patients, because of inter-individual variances and because ASD (a congenital heart diseases) is related to development of individuals after birth. Even when the pulmonary artery dilates to accept an increase in pulmonary blood flow, blood flow soon saturates, and, hence, the blood received needs to be sent to the lung periphery by the next cardiac beat. For these reasons, the pulmonary artery needs to retain its elasticity when it dilates. In other words, the pulmonary artery plays the role of the second stage of the right ventricular function, and that not only the original diameter of the pulmonary trunk but also its diameters during dilation and contraction will have to be considered.

In the present study, wave velocity was not analyzed.

Regarding fmin, which is considered to correlate well with wave velocity, these were no characteristic changes in fmin in ASD patients. A decrease in fmin is thought to be attributable to the influence of reflective waves and to be determined by the location of the reflective point and the pulse wave velocity. This probably explains why the decrease in peripheral pulmonary artery compliance was small in the ASD group. In this connection, Era") reported that an increase in wave velocity in ASD patients was within a range of reversible increase of wave velocity seen

in the control group in response to changes in pressure.

Of pathological studies reported previously, the study of Edwards1) indicated that the pulmonary blood vessels of adults with ASD who had normal pulmonary artery pressure and low pulmonary vascular resistance were anatomically the same as the pulmonary vessels of normal individuals, except for a tendency for the vessels of ASD patients to meander. In brief, the present study of pulmo- nary vascular input impedance in adults with ASD yielded the following results :

1. The pattern of pulmonary vascular input impedance did not differ between the ASD group and the normal control group.

2. ZO was reduced by an increase in pulmonary artery blood flow volume, resulting in suppression of elevation in pulmonary artery pressure.

3. These features did not weaken even when age advanced.

Therefore, if ZO increases over the level expected from the pulmonary blood flow volume in ASD patients, such a change should be attributed to some accompanying lesions.

Acknowledgments : The author is indebted to Prof. Kouhei Hara for his advice.

References

1) Patel, D. J., Defreitas, F. M. and Fry, D. L. : Hydraulic input impedance to aorta and pulmonary in dogs. J. Appl. Physiol., 18: 134

(1963)

2) Bergal, D. II. and Milnor, W. R.: Pulmonary vascular impedance in the dog. Circulation Res., 29: 401 (1965)

3) Sugawara, M., Matsuo, H., Kajiya, F. and Kitabatake, A.: Blood Flow, p. 250. Koudannsha, 1985 (Japanese)

4) Womersley, J. R.: An elastic tube theory of pulse transmission and oscillator flow in mammalian arteries. Wright Air Development

Center, Technical Report TR56-614 (1957)

5) Caro, C. G. and McDonald, D. A.: The relation of pulsatile pressure and flow in the pulmonary vascular bed. J. Physiol., 157: 426 (1961.) 6) Milnor, W. R., Conti, C. R., Lewis, K. B. and O'Rourke, VI. F.:

Pulmonary arterial pulse wave velocity and impedance in man.

Circulation Res., 25: 637 (1969)

7) Murgo, J. P. and Westerhof, N.: Input impedance of the pulmonary arterial system in normal man. Circulation Res. 54 : 666 (1984) 8) Wilcox, B. R. and Lucas, C. L.: Pulmonary input impedance in children

with left-right shunt. J. Surg. Res. 29:40 (1980)

9) Reuben, S. R., Swadling, J. P. and Lee, G. J.: Velocity profile in the main pulmonary artery of dogs and man measured with a thin film

resistance anemometer. Circulation Res. 27: 995 (1970)

10) Tagawa, H.: Pulmonary arterial input impedance in patients with chronic pulmonary diseases. The Japanese Journal of Thoracic Disease

27: 1031 (1989) (Japanese)

11) Era, 0.: The study on pulmonary arterial pulse wave velocity and in heart disease. The Japanese Journal of Applied Physiolosy, 17: 101

(1987) (Japanese)

12) Edwards, J. E.: The Lewis Cornner Memorial Lecture, Functional pathology of the pulmonary vascular tree in congenital cardiac disease.

Circulation 15: 164 (1957)

Tab.  1  Subjects
Fig.  1  Sampling  and  analytic  method  of  pulmonary  arterial  input  impedance.
Fig.  3  Pulmonary  vascular  input  impedance  curve  in  2  patients  with  atrial  septal  defect.
Fig.  5-c  The  relationship  between  total  pulmonalry  vascular  resistance  and  Characteristic  impedance  in  atrial  septal  defect.
+2

参照

関連したドキュメント

It is suggested by our method that most of the quadratic algebras for all St¨ ackel equivalence classes of 3D second order quantum superintegrable systems on conformally flat

Kilbas; Conditions of the existence of a classical solution of a Cauchy type problem for the diffusion equation with the Riemann-Liouville partial derivative, Differential Equations,

We present sufficient conditions for the existence of solutions to Neu- mann and periodic boundary-value problems for some class of quasilinear ordinary differential equations.. We

Then it follows immediately from a suitable version of “Hensel’s Lemma” [cf., e.g., the argument of [4], Lemma 2.1] that S may be obtained, as the notation suggests, as the m A

Definition An embeddable tiled surface is a tiled surface which is actually achieved as the graph of singular leaves of some embedded orientable surface with closed braid

0.1. Additive Galois modules and especially the ring of integers of local fields are considered from different viewpoints. Leopoldt [L] the ring of integers is studied as a module

Finally, in Figure 19, the lower bound is compared with the curves of constant basin area, already shown in Figure 13, and the scatter of buckling loads obtained

Hence, for these classes of orthogonal polynomials analogous results to those reported above hold, namely an additional three-term recursion relation involving shifts in the