2
Introduction
Water is essential to sustaining life. There are numerous challenges concerning water that include problems such as increasing local water supply associated with lifestyle changes, increasing water usage due to expansion in food production associated with increasing population, the virtual water related food self-sufficiency in Japan, growing demand for bottled water derived due to concerns over safety of tap drinking water, increasing demand in agricultural water utilization associated with increasing biomass production such as corn, etc., and regionally distorted water demands due to population intensification of
Current Situation and Problems of Contiguous Water
KUNIKO URASHIMA
Environment and Energy Research Unit
1
urban areas. Ninety percent of the natural disastersduring the last ten years have been water related, and sixty-three percent of the people who have no access to safe drinking water and seventy- five percent of the people who have no access to sanitary facilities in the world concentrated in Asia and the Pacific region. The situation is very serious.
Figure 1 shows that in 2004 the amount of water used throughout Japan totaled approximately 83.5 billion cubic meters per annum. Usage of municipal water including domestic water and industrial water came to approximately 28.3 billion cubic meters per annum, and water for agricultural use came to 55.2 billion cubic meters per annum.[1] Although the amount of municipal water, which includes water used by industry and domestic household
100 million m3/year
(Year)
Figure 1 : National water usage volumes in Japan
Source: Reference [1]
Notes:
1. These are values based on water withdrawal volumes according to estimates by the Water Resources Department, Ministry of Land, Infrastructure and Transport, which include water volume released to rivers after usage.
2. Industrial water includes the amount of freshwater supply for plants or offices with four or more employees. However, water used in public-utility industries is not included.
3. Regarding agricultural water, the 1980 estimate value is used for 1981 - 1982, the 1983 estimate value is used for 1984 - 1988, and the 1989 estimate value is used for 1990 - 1993.
4. Some totals may differ due to rounding off.
Domestic water Industrial water Agricultural water Municipal water Total water usage amount
use, shows an increasing trend from 1965, over recent years the trend has almost leveled or slightly decreased reflecting the enhancements in water- saving technologies and the economic climate.[2]
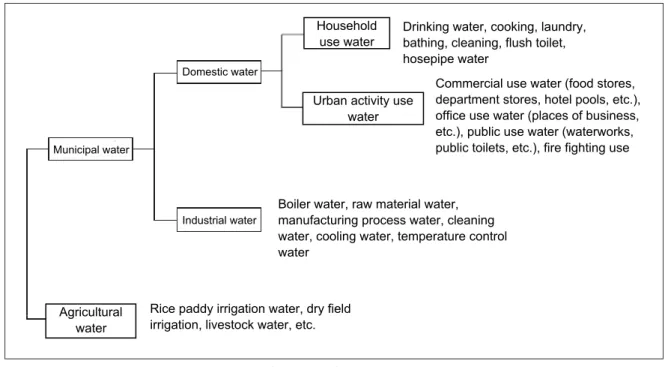
The groupings of the water utilization pattern are shown in Figure 2. This article investigates the problems, centering on local water, concerning water quality and water shortage with current anxieties, the energy increases associated with fresh water generation, and the ways that we should be reducing the impact on the environment associated with the treatment of wastes such as plastic bottle containers, etc.
Current situation of water in daily life
2-1 Domestic water
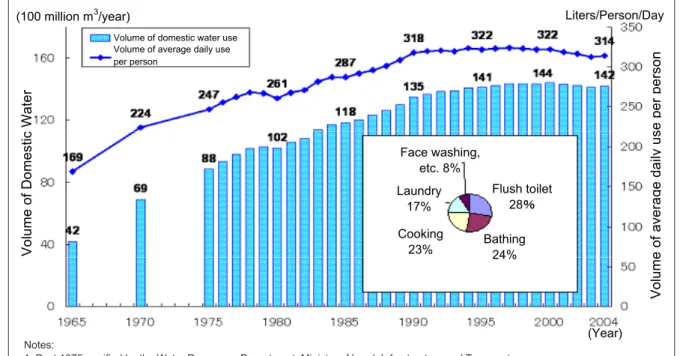
During the course of the last twenty years, droughts have occurred almost everywhere in Japan. The stoppage of water supply due to droughts not only bears a great impact on daily life, it also damages farm produce, raises prices of vegetables, etc., and obstructs the operation of manufacturing plants. For example, in 1995 an estimated 17 million people in 42 prefectures were affected by drought. As Figure 3 shows, the amount of water usage in general daily life has increased throughout the country due to changes of lifestyle.[1] Here, in particular, we will look at
the example of the problem occurring in Okinawa prefecture, which has had a history of suffering water shortages, to see how the water problem affects everyday life.
In Okinawa prefecture region where inclouding islands such as Ishigaki, Miyako, Kume etc., the population has increased from approximately 950,000 inhabitants in 1970 to 1.36 million in 2005. In addition, the numbers of tourists has also increased from approximately. 740,000 visitors in 1973 to approximately 2.05 million in 1984, reaching approximately. 5.50 million by 2005.
This increase is due to the increase in the numbers of flights and the numbers of direct flights to each of the islands. Along with the increase in tourists, the number of accommodation facilities has also increased. On the main island of Okinawa, the water service criterion of such facilities is 200 to 300 liters per day per staying customer;
however, in a survey of 29 accommodations conducted by the Okinawa Bureau of Enterprise, it was revealed that a daily maximum of 2,375 liters, minimum 332 liters, and an average of 778 liters were used per day per staying guest.[3] In the Okinawa countryside, there was no previous custom of taking baths, and taking showers was the established norm. However, in recent years, the water consumption rate has increased together with the growing numbers of tourists. Ensuring a supply of clean water has become a problem. In
Municipal water
Agricultural water
Domestic water
Industrial water
Household use water
Urban activity use water
Drinking water, cooking, laundry, bathing, cleaning, flush toilet, hosepipe water
Commercial use water (food stores, department stores, hotel pools, etc.), office use water (places of business, etc.), public use water (waterworks, public toilets, etc.), fire fighting use
Boiler water, raw material water, manufacturing process water, cleaning water, cooling water, temperature control water
Rice paddy irrigation water, dry field irrigation, livestock water, etc.
Figure 2 : Grouping of water usage pattern
Source: Reference [2]
2
particular, in the more remote islands which are poorer in water resources, in years of low rainfall tap water is in short supply even though there is sufficient water for irrigating the sugarcane crops because ensuring water for agricultural use is the principal objective of the many water resource developments, and residents become dissatisfied regarding water usage rights. Another example, in a village that has two simple waterworks, the water regulated supply time inside the village varies and thereby creating a sense of injustice among its residents. Also, there is regional disparity in water rate charges. For example, in Naha City, the price of tap water is 1,500 JPY per 10m3, whereas in Minamidaito village where the seawater is desalinated the price is 3,400 JPY, which is two to three times higher than Naha. This charge is also applicable to residents who are not associated with the tourist industry. Consequently, there is a trade-off between reducing the risk of drought and promoting tourism - which has created conflict among the residents.[4] This regional problem that is seen to be a feature of the small municipalities is not only found on Okinawa but is a common problem that occurs throughout the entire country.
In particular, on the smaller remote islands there are villages where the only one employce of water supply office is in charge of running the mains
water supply from managing the water purification plant to collecting water payments, and therefore the installation of technologically-simplified, easy- to-operate waterworks system is required.
In accordance with these changes in lifestyle and industrial structures, the necessity to produce water by the desalination of seawater is escalating. As the desalination of seawater requires energy, there are concerns about the shortage of energy which is generated only by thermal power plants and related global warming in Okinawa where no nuclear power generation is available.
2-2 Problems associated with food imports
Japan has been importing approximately 60%of food which naturally means that water is also required for its production overseas. This “Virtual Water” as it is called has many problems associated with its quality and quantity. For example, it is estimated that 500 to 600 liters are required to make a loaf of bread, whereas 200 g steak requires approximately 4,000 liters.[4] Since importing food also simultaneously imports the water that is incidental to the food items, there is the issue regarding the quality of such imported waters.
Figure 4 shows the flow of virtual water into Japan from each region of the world. By looking at this diagram, we can see that the majority of
Liters/Person/Day
(Year) (100 million m3/year)
Volume of domestic water use Volume of average daily use per person
Volume of Domestic Water Volume of average daily use perperson
Flush toilet 28
䋦
Bathing 24%
Cooking 23%
Laundry 17%
Face washing, etc. 8%
Figure 3 : Transitions in domestic water usage volume
Source: Reference [1]
Notes:
1. Post 1975, verified by the Water Resources Department, Ministry of Land, Infrastructure and Transport.
2. Values for 1965 and 1970 are according to the Health, Labour and Welfare Ministry's "Tap Water Statistics".
3. Based on the effective volume of water.
virtual water is imported from North America and Australia, followed by China and South East Asia, and also from Europe. The total imported volume of virtual water comes to approximately 64 billion m3 per annum. Whereas the total volume of water resources used inside Japan is approximately 90 billion m3, and the virtual water which is effectively the volume used by Japan overseas, corresponds to approximately two-thirds of the actual volume that is used in Japan. If Japan aimed to reach an annual food self-sufficiency of 30 million tons, it would be necessary to generate irrigation water that is needed for food production.[6]
2-3 Problems associated with bottled water
In Japan, the use of mineral water and natural water when drinking whisky, etc., became generally widespread some time ago. However, recently, the amount of safe and good-tasting bottled water that is purchased daily at almost every opportunity is increasing. Besides domestically produced bottled water, imported products are also increasing. In 2000, the imported amount of bottled water was 195,000 m3. Approximately one-third of bottled water sold in Japan is imported from North America and Europe. Since transporting bottled water is directly associated with CO2 generation through the use of fueled transportation, it isseen as a part of the problem concerning further usage energy resources and generation of global greenhouse gases. It also creates the problem of dealing with the waste treatment of plastic bottles.
In June 2007, the mayor of San Francisco issued a permanent ban on the purchasing of bottled water in the city for the purpose of saving taxes and protecting the environment. In America, trial calculations show that 40 million gallons of oil are consumed per annum in the production of container materials of bottled water purchased by its citizens.
Furthermore, because this also generates the problem of disposing of the containers, there are many controversies concerning this matter.[8, 9]
Present water situation
3-1 Attitudes to water
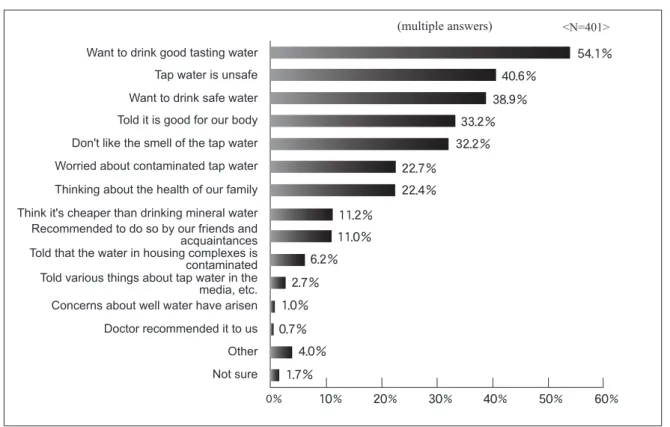
Presently, the national average of the popularization of water purifiers has exceeded 30%, and that of large metropolitan areas in which the water is considered to be “unpleasant” is comparatively higher than in other areas. Figure 5 shows the results of a survey on water purifiers conducted in Japan.[10] Among the reasons for installing water purifiers, “To improve the taste”
accounted for 54.1%, or just over half, whereas the health and safety concerns regarding tap water
Total imported volume: 64 billion m3/year
Volume of water used for irrigation in Japan: 59 billion m3/year (Japan unit yield amount: estimate value from statistics of the food supply and demand tables for the year 2000)
Figure 4 : Virtual water total import volume
Source: Reference [6]
3
Virtual water volume inported to Japan per
individual item (100 million m3/year) 2213
25 36
140
2024 94
121 146
was also considered to be of importance. A large number of households installed water purifiers because they were more concerned about corroded pipes and contaminated storage tanks through which the water passes than about the actual quality of water supplied as tap water. Figure 6 shows the result of an opinion poll of the tap water supplied by the Bureau of Waterworks, Tokyo Metropolitan Government.[11] These results suggest that there is a considerable sense of distrust regarding the quality of tap water.
3-2 Current situation of tap water
As Figure 7 shows, Japan’s water supply system covers 97.2% of the country. Since the number of patients suffering waterborne diseases is nil, almost all residents are supplied with safe drinking water. Furthermore, the water quality standard conformance over the last few years has been 99.9% or higher.[12, 13] However, the water management infrastructure includes a large number of vulnerable small and medium-scale water service operators.
The water quality of tap water is regulated by the
“Ministerial Ordinance Concerning the Standard for Water Quality” (Ministerial Ordinance of Ministry of Health, Labour and Welfare, No. 101,
Figure 5 : Reasons for installing water purifiers
Source: Reference [10]
Reasonably worried
31.3%
Worried 11.6%
Neither 0.9% Other 0.6%
Confident 8.8%
Reasonably confident
46.9%
Confidence levels regarding tap water (Survey by Tokyo Metropolitan Government)
Figure 6 : Confidence levels regarding tap water Source: Reference [11]
Waterborne Disease Patient Numbers (x 1,000) Water Quality Conformance
Figure 7 : Transitions of water supply system coverage (right axis) and waterborne disease patient numbers (left axis) in Japan
Source: Reference [12]
54.1%
40.6%
38.9%
33.2%
32.2%
22.7%
22.4%
11.2%
11.0%
6.2%
2.7%
1.0%
0.7%
4.0%
1.7%
0% 10% 20% 30% 40% 50% 60% (multiple answers) <N=401>
Want to drink good tasting water Tap water is unsafe Want to drink safe water Told it is good for our body Don't like the smell of the tap water Worried about contaminated tap water Thinking about the health of our family Think it's cheaper than drinking mineral water Recommended to do so by our friends and
acquaintances Told that the water in housing complexes is
contaminated Told various things about tap water in the
media, etc.
Concerns about well water have arisen Doctor recommended it to us Other Not sure
May 30, 2003) based on the Waterworks Law.
The inspection data (maximum value, minimum value, average value, and inspection frequency) for the water purification plants of the water service operators and water providers are tabulated separately for raw water and purified water and the quality of water is controlled by each operator.[14]
There are currently 50 inspection items [15] such as common bacteria, coliform bacteria, heavy metals, and organic materials such as benzene, etc., and also pH, color, and turbidity. However, in light of recent knowledge, these are considered to need revising, and therefore the gathering of necessary information and successive investigations are already underway.[16] While the cost of tap water varies from region to region, the national average cost per cubic meter is approximately 170 JPY.
Although water contained in a 1.5 liter bottle costs approximately 200 JPY, costing 500 to 1000 times more than tap water, the consumption of bottled water is on the increase as Figure 8 shows.[18]
3-3 Current situation of bottled water
The water (raw water) used as the raw material of mineral waters must be suitable for drinking and also conform to the criteria regulated by the Waterworks Law or the Food Sanitation Law.
Since bottled water is in a form that is subject to the Food Sanitation Law and not the Waterworks Law, it comes under the soft drinks category and, therefore, the manufacturing criteria and component standards are set by the Ministry of Health, Labour and Welfare. In Food Sanitation Law, mineral waters are described as a “soft drink of which the raw material is water only”, and include plain mineral water and waters into which carbon dioxide is injected and/or calcium added.
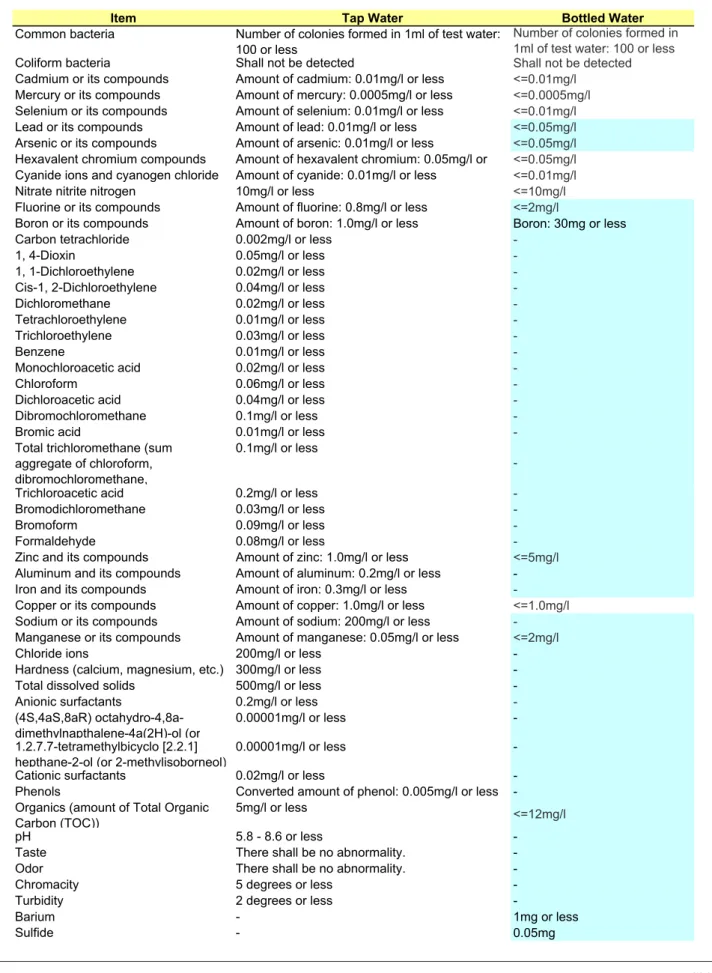
The quality of mineral waters is controlled by the “Standard for Food and Additives” based on Article 11 of the Food Sanitation Law. The number of controlled inspection items for raw water used in the manufacturing of bottled water is 18 items, which include common bacteria, lead, cadmium, and arsenic, etc. In addition, the bottled water manufactured using raw water other than tap water must satisfy the component standards criteria such as turbidity, sediments, arsenic, lead, cadmium, tin, coliform group bacteria, gram-positive micrococcus, and pseudomonas aeruginosa, etc.[19, 20] But, there is still a significant difference by comparison to the 50 items that are applicable to tap water regulated by the Waterworks Law. Table 1 shows a comparison of each item. It is plainly evident that quality of tap water is far more strictly controlled.
Note: Orepared by the Water Resources Department, Ministry of Land, Infrastructure and Transport based on data from The Mineral Water Association of Japan
Figure 8 : Transition in mineral water production and imported amounts
Source: Reference [18]
2005 2000
1995 1990
1986 2,500
2,000
1,500
1,000
500
-
Production Volume/Imported Volume
(Million Liters) Domestic
production volume Imported volume
(year)
Item Tap Water Bottled Water Common bacteria Number of colonies formed in 1ml of test water:
100 or less Number of colonies formed in
1ml of test water: 100 or less
Coliform bacteria Shall not be detected Shall not be detected
Cadmium or its compounds Amount of cadmium: 0.01mg/l or less <=0.01mg/l Mercury or its compounds Amount of mercury: 0.0005mg/l or less <=0.0005mg/l Selenium or its compounds Amount of selenium: 0.01mg/l or less <=0.01mg/l Lead or its compounds Amount of lead: 0.01mg/l or less <=0.05mg/l Arsenic or its compounds Amount of arsenic: 0.01mg/l or less <=0.05mg/l Hexavalent chromium compounds Amount of hexavalent chromium: 0.05mg/l or <=0.05mg/l Cyanide ions and cyanogen chloride Amount of cyanide: 0.01mg/l or less <=0.01mg/l
Nitrate nitrite nitrogen 10mg/l or less <=10mg/l
Fluorine or its compounds Amount of fluorine: 0.8mg/l or less <=2mg/l
Boron or its compounds Amount of boron: 1.0mg/l or less Boron: 30mg or less
Carbon tetrachloride 0.002mg/l or less -
1, 4-Dioxin 0.05mg/l or less -
1, 1-Dichloroethylene 0.02mg/l or less -
Cis-1, 2-Dichloroethylene 0.04mg/l or less -
Dichloromethane 0.02mg/l or less -
Tetrachloroethylene 0.01mg/l or less -
Trichloroethylene 0.03mg/l or less -
Benzene 0.01mg/l or less -
Monochloroacetic acid 0.02mg/l or less -
Chloroform 0.06mg/l or less -
Dichloroacetic acid 0.04mg/l or less -
Dibromochloromethane 0.1mg/l or less -
Bromic acid 0.01mg/l or less -
Total trichloromethane (sum aggregate of chloroform, dibromochloromethane,
0.1mg/l or less
-
Trichloroacetic acid 0.2mg/l or less -
Bromodichloromethane 0.03mg/l or less -
Bromoform 0.09mg/l or less -
Formaldehyde 0.08mg/l or less -
Zinc and its compounds Amount of zinc: 1.0mg/l or less <=5mg/l Aluminum and its compounds Amount of aluminum: 0.2mg/l or less - Iron and its compounds Amount of iron: 0.3mg/l or less -
Copper or its compounds Amount of copper: 1.0mg/l or less <=1.0mg/l Sodium or its compounds Amount of sodium: 200mg/l or less -
Manganese or its compounds Amount of manganese: 0.05mg/l or less <=2mg/l
Chloride ions 200mg/l or less -
Hardness (calcium, magnesium, etc.) 300mg/l or less -
Total dissolved solids 500mg/l or less -
Anionic surfactants 0.2mg/l or less -
(4S,4aS,8aR) octahydro-4,8a-
dimethylnapthalene-4a(2H)-ol (or 0.00001mg/l or less -
1.2.7.7-tetramethylbicyclo [2.2.1]
hepthane-2-ol (or 2-methylisoborneol) 0.00001mg/l or less -
Cationic surfactants 0.02mg/l or less -
Phenols Converted amount of phenol: 0.005mg/l or less -
Organics (amount of Total Organic
Carbon (TOC)) 5mg/l or less <=12mg/l
pH 5.8 - 8.6 or less -
Taste There shall be no abnormality. -
Odor There shall be no abnormality. -
Chromacity 5 degrees or less -
Turbidity 2 degrees or less -
Barium - 1mg or less
Sulfide - 0.05mg
Table 1 : Comparison of the quality inspection items for tap water and bottled water
Prepared by the STFC based on References [19, 20]
Water technologies
4-1 Water-saving technologies
Amid the global heightening of environmental awareness, while presently every conceivable industry and every conceivable product is compelled to be environmentally friendly, the water-saving technologies available for general households are also progressing.
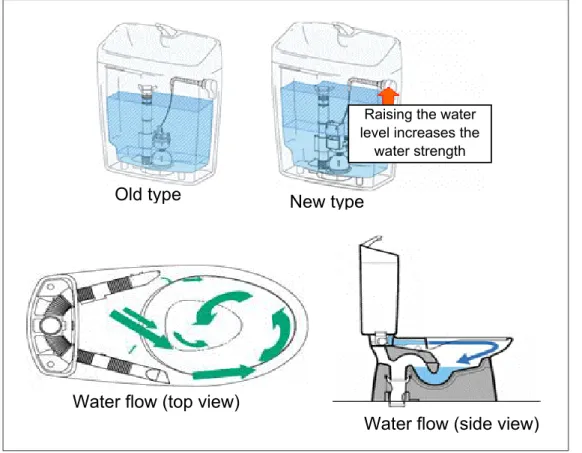
For example, ordinary toilet cleaning is achieved by flushing water that enters either directly from the water mains or from a storage tank. Due to recent technological developments, by effectively combining these two water flow systems, it is now possible to flush the toilet by using a much smaller volume of water. Many overseas toilets require approximately 13 liters, whereas products by Japanese manufactures require only 5.5 liters of water per large flush and 4.5 liters per small flush.
This can be achieved by the results of research into water flows or, in other words, basic fluid dynamics as shown in Figure 9. Compared to earlier toilets, the amount of cleaning water is more than halved to approximately 40%. This indicates a water saving efficiency equivalent to one bathtub
of water (calculated to be 180 liters when full) over two days, which amounts to an annual saving of approximately 12,000 JPY. In addition, this also enables a CO2 reduction of approximately 27 kg per year,*1 which also contributes to preventing global warming. On the other hand, technology is also being developed that makes it possible to reduce the amount of water used in heated bidet toilet seats to approximately half the amount formerly used by pulse-jetting the water at 70 cycles per second.[21]
4-2 Water circulation by reclaimed wastewater system
Reclaimed wastewater system refers to system that processes rain water and drain water and then reuses it as reclaimed wastewater. There are standalone circulatory systems, regional circulatory systems, and wide area circulatory systems. Biodegradation, membrane filtration, and
Raising the water level increases the
water strength
cleaning from100%
t
Old type New type
Water flow (top view)
Water flow (side view)
Figure 9 : Toilet flushing systems (old and new designs)
Source: Reference [21]
4
*1
This value is calculated based on the fact that 0.59 kg of CO2 is released per cubic meter in processing sewage water or purifying river water.
a combination of these are used for the treatment methods. Applications of reclaimed wastewater include, depending on the water quality, toilet flushing, watering, cooling tower supply, fire extinguishing, and vehicle washing, etc.
Introduction of these reclaimed wastewater systems is an effective way to save water, alleviate water shortages, reduce the load on sewage systems, and save money.[22]
4-3 Water thermal energy utilization technologies
During recent years, due to the popularization of heat utilization instruments such as heat pumps, etc., it is possible to utilize the thermal energy of water that exists in large volumes in low- temperature heat sources such as river water, etc.
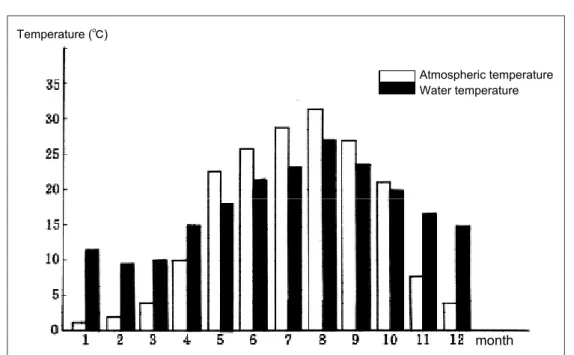
Table 2 shows examples utilizing water thermal energy similar to ground thermals. For example,
heated or cold water from effluents, or water from hot springs is used either directly or by heat pipes for cooling and heating and melting snow, etc. In addition, groundwater and treated sewage water is also utilized for cooling and heating and for supplying areas with hot water, etc. by using heat pumps which transfer heat from low temperature heat source to high temperature medium.
Compared to the atmospheric temperature, the temperature of a large volume of water is higher in winter and cooler in summer, and during the course of the year, the temperature is comparatively stable. So it can be utilized as an effective heat source. For example, as shown in Figure 10, by using the waters as a heat source, an energy saving of approximately 20% is foreseeable compared to using the air in the center of Tokyo. There are also other examples of injecting surfactants into circulatory water used in heaters to reduce the energy
Description Water Source Utilizing Facility and Application Volume of Water Used (m3/day) Tokyo Nakano treatment plant Treated sewage water Air conditioning of administration building
䋨5,600m2) Approx. 3,000
Tokyo Yushima pumping station Untreated water Air conditioning of office building (490m2䋩 Approx. 2,000 Tokyo Ariake treatment plant Treated sewage water Air conditioning of administration building
䋨4,419m2䋩 Approx. 1,500
Yamagata prefecture, Mogami-machi
town office Groundwater Heating, supplying hot water to 5 town
office facilities 䋨10,604m2䋩 Approx. 2,300 Tokyo Hakozaki district River water Regional air conditioning, supplying hot
water to business premises, other 䋨22.7ha䋩 Approx. 34,700 Tokyo Koraku, 1-chome district Untreated water Regional air conditioning of business
premises, other 䋨21.6ha䋩 Approx. 130,000
Table 2 : Examples of utilizing heat from water by using heat pumps
Source: Reference [23]
Atmospheric temperature Water temperature Temperature (㷄)
month Figure 10 : Comparison of water temperature and atmospheric temperature
Source: Reference [23]
consumed by the pump’s power source by 65%.
By introducing this technology in buildings, hotels, and hospitals, etc., throughout Japan, assuming that overall energy consumption is 2.6 million kWh per year, a reduction of 4.55 million tons of CO2 per year is possible. By applying these kinds of technologies in the majority of buildings, there is potential for a further effective energy savings.[23]
The use of water thermal energy makes practical use of a clean unused source of energy, which is also effective in preventing global warming.
However, in order to use this type of thermal energy source, it must be utilized appropriately by considering the impact on the environment by returning low temperature water back into effluents or underground and potential obstructions such as land subsidence associated with using groundwater.
In addition, the amount of thermal energy stored in each water source and the economic efficiencies are also to be investigated. In fact, because ground subsidence in metropolitan areas used to be a serious issue, measures such as the groundwater extraction regulations were adopted to prevent the dropping of groundwater levels. Presently, the groundwater levels have recovered and the water levels are rising. However, certain cases where new detrimental and adverse impacts on subterranean structures and groundwater environment taking place are becoming apparent.[24]
Areas of future advancement
5-1 Global distribution of Japanese technology
Throughout the world, the amount of water resources per person differs greatly from country to country, as shown in Figure 11. By comparison to Canada, which has the most amount of water per person, Japan has a meager 4% of that amount.[25]
As the world’s population is increasing, it is vital to secure food resources and the amount of water used for daily living is expected to increase. In China, in particular, where not only there is an increase in industrial water usage, but with the approaching Beijing Olympic Games, there is also a huge problem concerning the quality of water. In order to deal with these types of problems, it would be desirable to popularize Japan’s sophisticated water
treatment technologies, general household water- saving technologies, and reclaimed wastewater utilization systems around the world.
In Okinawa, the island is not blessed with water resources from the natural environment, and water shortages have led to enforced supply restrictions each year. Therefore a number of water resource developments are underway centering on multipurpose dam developments.
Since 1996, the resultant effect of these ongoing water resource developments and the completion of seawater desalination plants have stabilized the situation, thereby mitigating the need to impose supply restrictions. Also, the effective utilization of waste reverse osmosis membranes in seawater desalination plants, byproducts of hardness reduction processes, and granular activated carbon used in high purification processes, in addition to actions such as the introduction of small- scale hydroelectric power plants, etc., serve as a reference for regions that have limited water natural resources.[26]
5-2 Improving water recycling efficiency
It is possible to enhance the recycling ratio of water from current level by, for example, the reuse of rainwater in everyday life and recycling bathtubFigure 11 : Amount of Water Resources per Person/Year for each country
Prepared by STFC based on Reference[25]
5
0 20000 40000 60000 80000 100000 World
Kuwait Saudi Arabia China Japan France The Netherlands Thailand Switzerland America Australia Russia Brazil Canada
water resources per person /year
Amount of water resources per personAmount of water
resources per person (m3/person/year)
90,767 45,039
31,841 24,487 10,169 7,475 6,397 5,583 3,355 3,337 2,127 94 7
8,559
20,000 40,000 60,000 80,000 100,000
water, etc.. Presently, many older buildings are being rebuilt, and reclaimed wastewater utilization systems are being introduced in high-rise buildings.
As indicated in Chapter 4, this system can be applied to many kinds of buildings, and improving the efficiency of water recycling is achievable by further popularizing this system in general households.
5-3 Raising public awareness
It is vital to raise the public awareness regarding tap water. In Tokyo, highly purified bottled tap water is sold under the brand of “Tokyo Water”.[27]
For sometime now, the waterworks department has been manufacturing bottled water as stockpile provisions to be used in times of emergency;
however, the bottled water manufactured by the waterworks department has been put on sale as a public relations exercise to raise awareness of its higher purity water. These sorts of activities are expected to contribute to change the perception of people who buy bottled water simply for peace of mind and to help popularize the notion that tap water is safe and reliable.
Due to climate change brought about by global warming, the fluctuation in the amount of rainfall increases and the impact on the balance of supply and demand is becoming more apparent. According to the No. 4 evaluation report released by the Intergovernmental Panel on Climate Change (IPCC) in 2007, the average global surface air temperature is anticipated to rise by a maximum of 6.4℃at the end of the 21st century. In the first half of this century, it is anticipated that the annual average river flow rates and usable water volume will decrease by 10 to 30% in the mid-latitude areas.[25] In order to tackle these kinds of problems, it is important to recognize that this water issue is not merely a question of supply and demand, but it is also linked to numerous other environmental problems. In particular it is necessary to improve the image of tap water.
Acknowledgments
The author would like to take this opportunity to thank Mr. Sombou Yamamura, Manager of the Water Supply Division, Health Service Bureau, Ministry of Health, Labour and Welfare; Mr. Akira Nitta, Deputy Director, Acid Rain Research Center,
Japan Environmental Sanitation Center; Professor Keisuke Taira, Department of Engineering, and Dr. Daisuke Kamiya, Department of Civil Engineering and Architecture of the University of the Ryukyus; Professor Taikan Oki, Institute of Industrial Science, University of Tokyo; Mr.
Kazunari Yoshimura of Global Water Japan; and Dr. Norifumi Isu, Creative Technology laboratory, Technical Research Center, INAX Corporation for providing valuable discussion and information in the writing of this article.
References
[1] Japan’s Water Resources, Ministry of Land, Infrastructure and Transport (2007) (Japanese) : http://www.mlit.go.jp/tochimizushigen/mizsei/
c_actual/images/03-02.gif
[2] Water resources white paper: Utilization of Water Resources, Ministry of Land, Infrastructure and Transport (Japanese): http://
www.mlit.go.jp/tochimizushigen/mizsei/
hakusyo/H19/3-2.pdf
[3] D. Kamiya, Research into Droughts and Changes in Water Supply and Demand in Okinawa, Proceedings of the 34th Environmental Systems Research Association Conference, pp. 331-338, 2006 (Japanese) [4] D. Kamiya , Analysis of Drought Problems
and Regional Community Characteristics in Okinawa, Proceedings of the 43rd Annual Meeting of the Japan Section of the Regional Science Association International, 2006 (Japanese)
[5] World Water Map, translated by Taikan Oki, et al., Maruzen (Japanese)
[6] World Water Crisis and Japan’s Water Problems (Japanese): http://hydro.iis.u-tokyo.
ac.jp/Info/Press200207/#VW
[7] Excutive Directive 07-07, Permanet Phase-Out of Bottled Water Purchases by San Francisco City and Country Government, June 21, 2007 [8] The Water Connoisseur, July 2007: http://
www.finewaters.com/Newsletter/July_2007/
San_Francisco_Mayoral_Ban_on_Bottled_
Water_Purchases_Ignores_Important_Facts.
asp?utm_source=rss
[9] The Washington Times, July 26, 2007 "The war on bottled water": http://www.freerepublic.
com/focus/f-news/1872094/posts
[10] Investigation into the Popularization and Efficiency of Water Purifiers, Japan Water Purifier Association (Japanese)
[11] Reliability of Tap Water, Bureau of Wa t e r w o r k s , To k y o M e t r o p o l i t a n Government (Japanese): http://www.
waterworks.metro.tokyo.jp/jigyo/mntr_e/
data/h15_04_01.pdf
[12] Recent Trends in Tap Water Administration, 5th Meeting of the Life Environmental Health Sciences Council on Environmental Water Supply (Japanese): http://www.mhlw.
go.jp/shingi/2006/08/dl/s0804-4a3-01.pdf [13] Public-private competitive bidding
management committee hearings materials, tap water fields (Japanese): http://www5.cao.
go.jp/kanmin/kaisai/bukai/kobutsu/2007/529 /070529-1.pdf
[14] Tap Water Quality Database, Japan Water Works Association (Japanese): http://www.
jwwa.or.jp/mizu/index.html
[15] Water Quality Criteria, Bureau of Waterworks, Tokyo Metropolitan Government (Japanese):
http://www.waterworks.metro.tokyo.jp/
[16] Tap Water Quality Standards, Ministry of Health, Labour and Welfare (Japanese):
http://www.mhlw.go.jp/topics/bukyoku/
kenkou/suido/kijun/index.html
[17] The Circumstances Surrounding Tap Water and the Current Situation and Future Prospects, Water Vision Follow-Up Study Committee, Water Supply Division, Health Service Bureau, Ministry of Health, Labour and Welfare, May 2007 (Japanese): http://
www.mhlw.go.jp/topics/bukyoku/kenkou/
suido/vision2/dl/one2-06.pdf,
[18] Securing Safe, Good-Tasting Drinking Water – Japan’s Water Resources, Ministry of Land, Infrastructure and Transport (Japanese):
http://www.mlit.go.jp/tochimizushigen/
mizsei/c_actual/images/07-01.gif
[19] Standard for Foods and Additives, Ministry of Health, Labour and Welfare (Japanese):
http://wwwhourei.mhlw.go.jp/cgi-bin/
t_document.cgi?MODE=hourei&DMODE=
CONTENTS&SMODE=NORMAL&KEY WORD=&EFSNO=667&PAGE=9&FILE=
&POS=0&HITSU=0
[20] Bureau of Waterworks, Tokyo Metropolitan Government, Topic 12: Mineral Water (Japanese): http://www.waterworks.metro.
tokyo.jp/w_info/s_kekka_topi12.htm [21] INAX Product Catalog (Japanese)
[22] Reclaimed Wastewater Reuse Systems, Wa t e r C i r c u l a t i o n S y s t e m s , C i v i l Engineering Technologies, Ministry of Land, Infrastructure and Transport (Japanese):
http://www.mlit.go.jp/kokudokeikaku/iten/
kankyo/pdf/tyuusui.pdf
[23] Topics, Energy Fields. Science & Technology Trends No. 76: http://www.nistep.go.jp/
achiev/ftx/jpn/stfc/stt076j/index.html
[24] Japan’s Water Resources - Groundwater Utilization and Measures for Land Subsidence, Water Resources Department of the Ministry of Land, Infrastructure and Transport (Japanese): http://www.mlit.go.jp/
tochimizushigen/mizsei/f_groundwater/
groundwater01.thm
[25] Current Situation of Japan’s Water Resources and Water Supply and Demand, Ministry of Land, Infrastructure and Transport, Chapter 3 Japan’s Water Resources, 2007 Edition (Japanese)
[26] Okinawa Bureau of Enterprise (Japanese):
http://www.eb.pref.okinawa.jp
[27] Bureau of Waterworks, Tokyo Metropolitan Government website (Japanese): http://
www.waterworks.metro.tokyo.jp/tokyo-sui/
campaign/cam.html
Kuniko URASHIMA, PhD
Senior Research Fellow Science and Technology Foresight Center
Doctor of Engineering. She joined her present post in 2003 after working in the development of treating and eliminating environmental pollutants using plasma technology at Japanese electronics manufacturers, universities in Canada, America, and France, the National Research Institute, and other industries. She is principally engaged in investigating science and technology trends related to the world environment and energy as a whole.
(Original Japanese version: published in November 2007)