ISSN 1884−1503 財団法人ひょうご環境創造協会
兵庫県環境研究センター紀要
第3号
BULLETIN OFTHE HYOGO PREFECTURAL INSTITUTE OF
ENVIRONMENTAL SCIENCES
No.3 2011
兵庫県環境研究センター紀要第3号
2012.3
財団法人ひょうご環境創造協会
兵庫県環境研究センター紀要
第3号
目
次
ノート
Development and Application of Simultaneous Analytical Method
for Perfluorinated Compounds in Waste Samples by LC/MS/MS
(LC/MS/MS を用いた廃棄物中における有機フッ素化合物 (PFCs)の
一斉分析法の開発及び適用)
Mihoko YOSHIDA,Shusuke TAKEMINE and Chisato MATSUMURA
1
加古川流域陸域起源有機物との比較における播磨灘海域の難分解性有機物に
関する特性評価
仲川直子,吉田光方子,金澤良昭,前川真徳
9
兵庫県姫路市における大気中粒子状物質及びガス状物質の並行測定(1)
−成分濃度の季節変動−
常友大資,中坪良平,平木隆年,島
正之,余田佳子,齊藤勝美
16
兵庫県姫路市における大気中粒子状物質及びガス状物質の並行測定(2)
−PM
2.5の発生源解析−
中坪良平,常友大資,平木隆年,島
正之,余田佳子,齊藤勝美
21
最終処分場における有機フッ素化合物の同族体毎の挙動
山本勝也,竹峰秀祐,松村千里,英保次郎
26
資
料
平成 22 年度の兵庫県における微小粒子状物質(PM
2.5)に係る
常時監視測定結果の考察
常友大資,中坪良平,平木隆年
32
BULLETIN
OF
THE
HYOGO
PREFECTURAL
INSTITUTE
OF
ENVIRONMENTAL
SCIENCES
No.3
CONTENTS
Notes
Development and Application of Simultaneous Analytical Method
for Perfluorinated Compounds in Waste Samples by LC/MS/MS
Mihoko YOSHIDA, Shusuke TAKEMINE and Chisato MATSUMURA
1
Characteristics of Refractory Organic Matters in Surface Water at the Sea of Harima
in Comparison with Organic Matters from the Kako River Watershed
Naoko NAKAGAWA, Mihoko YOSHIDA, Yoshiaki KANAZAWA
and Masanori MAEKAWA
9
Parallel measurement of atmospheric particulate and gases in Himeji, Hyogo (1)
– Season variation of components –
Daisuke TSUNETOMO, Ryouhei NAKATSUBO, Takatoshi HIRAKI, Masayuki SHIMA,
Yoshiko YODA and Katsumi SAITOH
16
Parallel measurement of atmospheric particulate and gases in Himeji, Hyogo (2)
– Source characterization of PM
2.5–
Ryouhei NAKATSUBO, Daisuke TSUNETOMO, Takatoshi HIRAKI, Masayuki SHIMA,
Yoshiko YODA and Katsumi SAITOH
21
Behavior of Perfluorinated Organic Compounds in Final Landfill Site
Katsuya YAMAMOTO, Shusuke TAKEMINE
1, Chisato MATSUMURA
and Jiro EIHO
26
Report
A study on measurement result by air pollution monitoring stations
for PM
2.5concentration in Hyogo Prefecture in 2010
[Note]
Development and Application of Simultaneous Analytical
Method for
Perfluorinated Compounds in Waste Samples by LC/MS/MS
Mihoko YOSHIDA
1, Shusuke TAKEMINE
2and Chisato MATSUMURA
21Water Environment Division, Hyogo Prefectural Institute of Environmental Sciences,
3-1-27, Yukihira-cho, Suma-ku, Kobe, Hyogo 654-0037, Japan, 2 Environmental Safety Division,
LC/MS/MS を用いた廃棄物中における有機フッ素化合物 (PFCs)の
一斉分析法の開発及び適用
吉田
光方子
1竹峰
秀祐
2松村
千里
21兵庫県環境研究センター 水質環境科(〒654-0037 神戸市須磨区行平町 3-1-27),2安全科学科
The investigation was carried out to establish the simultaneous and high sensitive analysis for the perfluorinated compounds (PFCs) in waste sample.
In pretreatment of the waste, the extraction efficiency of three techniques; accelerated solvent extractor (ASE), soxhlet extraction and ultrasonic extraction were compared and examined. Operation blank test, recovery test spiked with mass labeled PFCs (MPFCs) and content examination in waste sample were experimented for 14 kinds PFCs.
As for the pretreatment method, the ultrasonic extraction method which had shown good results both in the operation blank and isotope spiked recovery tests were adopted. The PFCs in waste were extracted with methanol and separated as well as concentrated with nitrogen-gas and analyzed by LC/MS/MS determination. And the waste was used in solid form. PFCs were detected at retention time between 3.75~7.15 min by the technique which was established in this study. In addition, the chromatogram of waste sample shows that PFCs and isomer were detected at almost the same time without interference. Since the existence ratios of PFCs in various wastes are different, by
establishing profile of each waste at different sources, this study will contribute to developing countermeasures that would prevent environmental contamination of PFCs at global level.
Ⅰ
INTRODUCTION
The fluorochemical compounds such as perfluorooctanoate(PFOA) and perfluorooctane sulfonate(PFOS) are stain and water repellant. It is these superior properties that are widely applied to various fields in the modern society for pursuing comfortable and convenient life styles.
On the other hand, negative properties of PFCs such
as hazardous, persistent and bioaccumulative properties have been concerned1). Thus, in May 9th, 2009, the 4th Conference of the Parties (COP4) for the Stockholm Convention on Persistent Organic Pollutants adopted perfluorooctane sulfonate and perfluorooctane sulfonyl fluoride (PFOS and PFOSF) in Annex B. In addition, these PFOS and PFOSF were designated as a class I specified chemical substances under the Law Concerning the Examination and
Regulation of Manufacture, etc., of Chemical Substances in Japan, and were subject to global regulation. Since the further production and use of these compounds will be strictly controlled, the widespread of the compounds into the environment would be reduced. However, PFCs products have still been widely stocked and used as well as disposed and discharged into our living environment. It is highly likely that the compounds will continue to present ubiquitously in whole society through the various environmental routes and media.
In recent years, many surveys and risk assessment have been carried out with regard to environmental contamination of PFCs in various media including atmosphere and water2) -9). However, little information has been available with regard to the waste generated as a result of anthropogenic activities and transported to waste treatment facilities. PFCs are detected in high concentrations from leachate at some final disposal sites10) 11). Thus, the investigation of PFCs in waste will be an important information source to develop countermeasures for PFCs pollution. In this study, sensitive method by using LC/MS/MS for the determination of PFCs in waste samples was developed and presented.
Ⅱ
MATERIALS AND METHODS
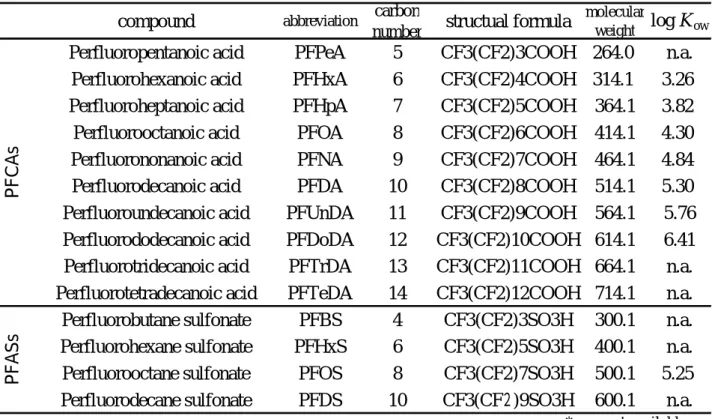
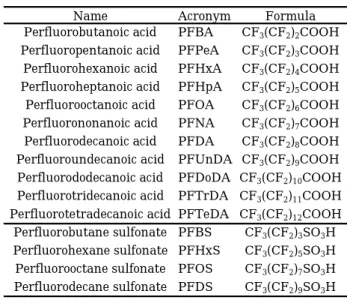
1. Target PFCs, Reagents and Reagent preparation The target substances of the development of our analytical method are 14 compounds. The target PFCs and octanol-water partition coefficient (log Kow) are shown in Table 1. The target PFCs in
this study were perfluorocarboxylic acids (PFCAs):10, perfluoro alkyl sulfonates (PFASs): 4 substances and mass-labeled PFCs (MPFCs) were mass-labeled PFCAs (MPFCAs):7, mass-labeled PFASs (MPFASs):2 for surrogate compounds. The former target PFCs used PFAC-MXB as standard substances, and the latter MPFCs used MPFAC-MXA as internal standard substances, these were all commercially available products. The both mixture solutions were manufactured by Wellington Laboratories Inc. The
PFOA-13C8 used as internal standard was the
product of Cambridge Isotope Laboratories. All compounds were linear chains. Methanol was originally for residual agrochemical analysis use obtained from Wako Junyaku Kogyo (Wako Pure Chemical Industries, Ltd.). No interference of the reagents with the measurement of substances was confirmed. The 100ug/L-standard solution for the calibration curve was prepared with 2000ug/L-PFAC-MXB in methanol.
compound
abbreviationcarbon
number
structual formula
molecular
weight
log K
owPerfluoropentanoic acid
PFPeA
5
CF3(CF2)3COOH
264.0
n.a.
Perfluorohexanoic acid
PFHxA
6
CF3(CF2)4COOH
314.1
3.26
Perfluoroheptanoic acid
PFHpA
7
CF3(CF2)5COOH
364.1
3.82
Perfluorooctanoic acid
PFOA
8
CF3(CF2)6COOH
414.1
4.30
Perfluorononanoic acid
PFNA
9
CF3(CF2)7COOH
464.1
4.84
Perfluorodecanoic acid
PFDA
10
CF3(CF2)8COOH
514.1
5.30
Perfluoroundecanoic acid
PFUnDA
11
CF3(CF2)9COOH
564.1
5.76
Perfluorododecanoic acid
PFDoDA
12
CF3(CF2)10COOH 614.1
6.41
Perfluorotridecanoic acid
PFTrDA
13
CF3(CF2)11COOH 664.1
n.a.
Perfluorotetradecanoic acid
PFTeDA
14
CF3(CF2)12COOH 714.1
n.a.
Perfluorobutane sulfonate
PFBS
4
CF3(CF2)3SO3H
300.1
n.a.
Perfluorohexane sulfonate
PFHxS
6
CF3(CF2)5SO3H
400.1
n.a.
Perfluorooctane sulfonate
PFOS
8
CF3(CF2)7SO3H
500.1
5.25
Perfluorodecane sulfonate
PFDS
10
CF3(CF2)9SO3H
600.1
n.a.
P
F
C
A
s
P
F
A
S
s
2. Waste samples
The details of the characteristics of the waste samples such as water content, pH, and appearance are shown in Table2. The waste samples are dewatered sludge, automobile shredded residues (ASR), incombustible general solid wastes generated from effluent treatment facilities and incinerating process.
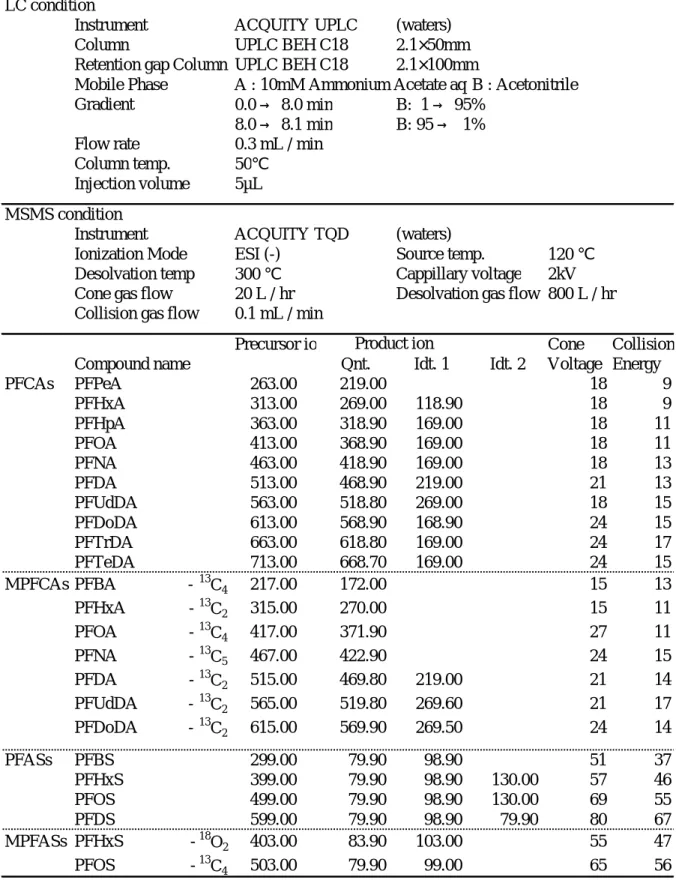
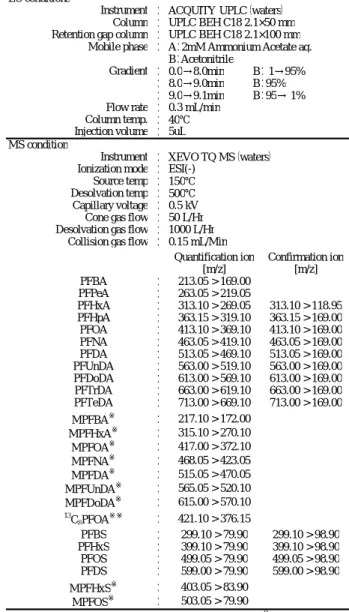
3. Equipment and instrumentation, LC/MS/MS analytical condition
The solid phase extract cartridge adopted Precep-C agri (short) (Wako Pure Chemical Industries, Ltd.). The target measurement substances were passed through the cartridge and adsorbed to the cartridge using a Sep-Pak Concentrator System Controller Plus (Waters) by 10 mL/min. The extraction solution was concentrated in TurboVap LV (Zymark) with nitrogen. Analytical conditions of LC/MS/MS are shown in Table 3. As for the ultrasonic generator, ULTRA SONIC AUTOMATIC WASHER (AS ONE Corporation) was used. A model 05PR-22 (Hitachi) was used as the centrifugal separator. DIONEX ASE-200 (DIONEX) was selected for the Accelerated Solvent Extractor (ASE). The pulverized wastes were prepared by vibrating sample mill (TI-100, HEIKO Co.), and sieved with 0.5mm-mesh after drying overnight at 50 degrees Celsius.
4. Development of PFCs analysis technique in waste and Examination of the preprocessing method
The following three extraction methods were compared and discussed for sample pretreatment: ASE, soxhlet extraction in Methanol for 12hours and ultrasonic extraction with Methanol. In each
procedure, the operation blank test without interference from the waste and recovery test using real waste samples spiked with 1ng MPFCs were carried out at the same time. In preparing samples, 1ng of MPFCs was spiked to the waste sample as surrogate.
The sample solutions extracted by ASE or soxhlet extraction were concentrated to about 1ml with nitrogen injection. The PFCs adsorbed on the cartridge were then eluted with 2mL methanol. The eluent was concentrated to about 1mL using the TurboVap LV. The pretreated solution extracted by ultrasonic extraction was measured up to 10ml and TurboVap LV. The pretreated solution extracted by ultrasonic extraction was measured up to 10ml and 1mL aliquot of the 10ml extract was taken for
determination. Then 1ng of PFOA-13C8 standard
solution was spiked as internal standard to the obtained extract, as described above. And 5EL was injected into the LC/MS/MS for determination. For the measurement of minimum detection limit (MDL), sample6 which contains little or no PFCs was taken. The waste was spiked with standard mixture methanol solution and adjusted to the final concentration of 2ng/g. The recovery test was repeated for 7 times and the results were used for calculating MDL by using the following equation.
MDL = 2 × s × t(n-1,0.05) s : standard deviation
t(n-1,0.05) : t value of n-1 degree of freedom, level of significance 5% Table 2 Characterization of waste samples
Sample No.
1
2
3
4
5
6
water content ratio (%)37.0
11.1
34.4
0.9
52.3
57.7
pH
6.8
8.0
7.6
7.9
7.4
6.8
appearance
dewatered sludgesludge
automobile shredder residueshredded
solid
residue
sludge
sludge
color
black
white
black
gray
brown
white
Table 3 Analytical condition for PFCs with LC/MS/MS
LC condition
Instrument
ACQUITY UPLC
(waters)
Column
UPLC BEH C18
2.1×50mm
Retention gap Column UPLC BEH C18
2.1×100mm
Mobile Phase
A : 10mM Ammonium Acetate aq B : Acetonitrile
Gradient
0.0 → 8.0 min
B: 1 → 95%
8.0 → 8.1 min
B: 95 → 1%
Flow rate
0.3 mL / min
Column temp.
50℃
Injection volume
5µL
MSMS condition
Instrument
ACQUITY TQD
(waters)
Ionization Mode
ESI (-)
Source temp.
120 ℃
Desolvation temp
300 ℃
Cappillary voltage
2kV
Cone gas flow
20 L / hr
Desolvation gas flow 800 L / hr
Collision gas flow
0.1 mL / min
Precursor ion
Cone
Collision
Compound name
Qnt.
Idt. 1
Idt. 2
Voltage Energy
PFCAs
PFPeA
263.00
219.00
18
9
PFHxA
313.00
269.00
118.90
18
9
PFHpA
363.00
318.90
169.00
18
11
PFOA
413.00
368.90
169.00
18
11
PFNA
463.00
418.90
169.00
18
13
PFDA
513.00
468.90
219.00
21
13
PFUdDA
563.00
518.80
269.00
18
15
PFDoDA
613.00
568.90
168.90
24
15
PFTrDA
663.00
618.80
169.00
24
17
PFTeDA
713.00
668.70
169.00
24
15
MPFCAs PFBA -
13C
4217.00
172.00
15
13
PFHxA -
13C
2315.00
270.00
15
11
PFOA -
13C
4417.00
371.90
27
11
PFNA -
13C
5467.00
422.90
24
15
PFDA -
13C
2515.00
469.80
219.00
21
14
PFUdDA -
13C
2565.00
519.80
269.60
21
17
PFDoDA -
13C
2615.00
569.90
269.50
24
14
PFASs
PFBS
299.00
79.90
98.90
51
37
PFHxS
399.00
79.90
98.90
130.00
57
46
PFOS
499.00
79.90
98.90
130.00
69
55
PFDS
599.00
79.90
98.90
79.90
80
67
MPFASs PFHxS -
18O
2403.00
83.90
103.00
55
47
PFOS -
13C
4503.00
79.90
99.00
65
56
Product ion
Ⅲ RESULTS AND DISCUSSION
1. Result of the pretreatment procedure
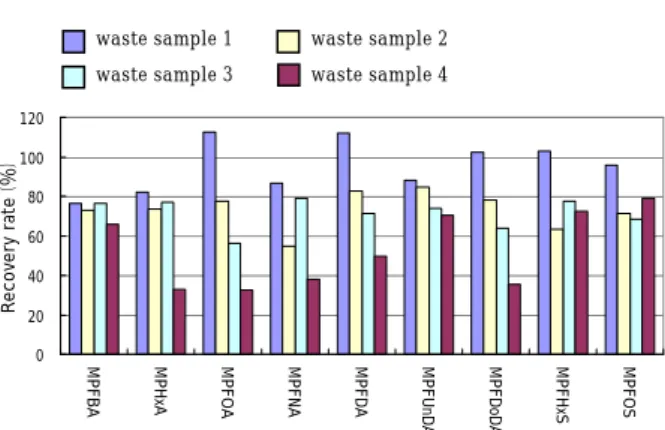
The results of operation blank by using the 3 methods are shown in Fig.1. High concentrations of PFHxA and PFHpA in PFCAs that exceeded 7ng/g-wet were detected by the ASE and soxhlet extraction. The result confirmed cross contamination in the operation process. The concentrations of the other PFCs and those of the PFCs extracted by ultrasonic extraction method were under 1ng/g-wet. The contamination level of PFCs was not as significant as to affect the analysis seriously. The result of the recovery test of the samples from 1 to 4 spiked with 1ng MPFCs is shown in Fig.2. The 3 color bar charts show the average recovery rate. The recovery rate of the
MPFHxA and MPFDoA by the ASE, soxhlet extraction, as well as MPFHxS by the ASE were under 60%, while the rest of the recovery rates show no significant differences among the extraction methods. Despite the use of wastes in various forms nd properties as target samples, the recovery rates of the samples from 1 to 4 were not significantly affected by the extraction methods used in the study. It is, therefore, concluded that extraction can be performed by either technique without a problem.
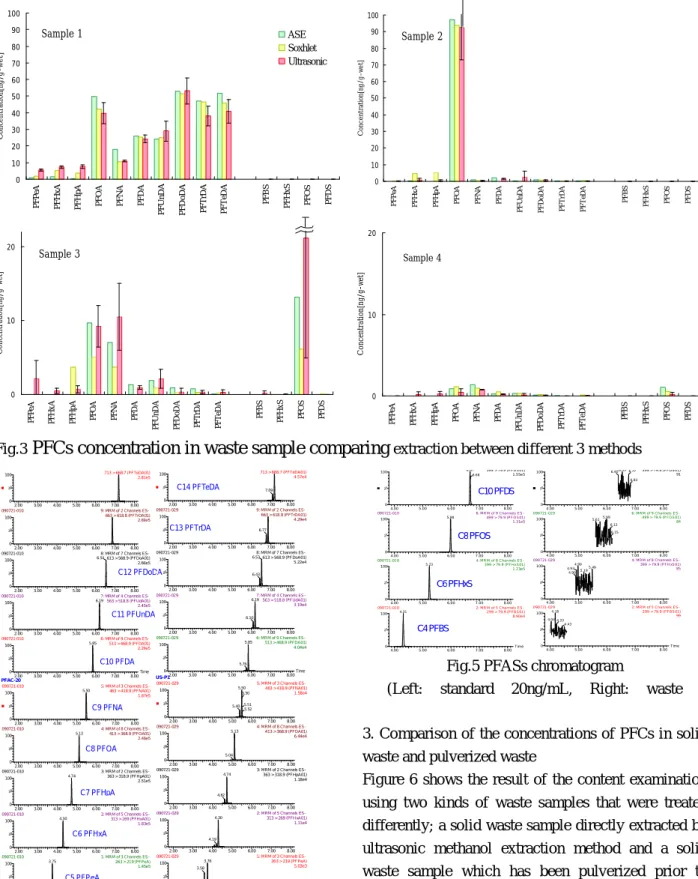
2. Content examination in the waste sample
The results of content in waste sample1-4 with every method to compare extraction efficiency show in Fig.3.
The PFCs content were indicated to be deducted with the content obtained by the operation blank. In ultrasonic extraction method, each sample were analyzed repeatedly 3 times and showed the range of concentration (black bar line), the average (red bar charts). PFCs were detected from all waste samples. As an example of PFCs analysis, the PFCAs chromatograms of the standard solution (20ng/L) and the sample1 are shown in Fig.4, and the PFASs chromatograms are shown in Fig.5, respectively. In the chromatogram of standard solution (left), PFCAs was detected between 3.75~7.15 min. The chromatograms of waste sample (right) show that PFCAs and isomer were detected almost at the same time without interferences. And the minimum detection limit values of PFCs obtained by ultrasonic extraction method were 1.4 - 3.9ng/g.
0 0.2 0.4 0.6 0.8 P F P eA P F H x A P F H p A P F O A P F N A P F D A P F U n D A P F D o D A P F T rD A P F T eD A P F B S P F H x S P F O S P F D S C o n ce n tr at io n (n g /g -w et ) ASE Soxhlet Ultrasonic PFCAs PFASs 6.7 7.1 7.6 9.1
Fig.1 PFCs concentration of operational blank
0 20 40 60 80 100 M P F H x A M P F O A M P N A M P F D A M P F U n D A M P D o D A M P F H x S M P F O S R e c o v e ry ra te [% ]
ASE Soxhlet Ultrasonic
MPFCAs MPFASs
3. Comparison of the concentrations of PFCs in solid waste and pulverized waste
Figure 6 shows the result of the content examination using two kinds of waste samples that were treated differently; a solid waste sample directly extracted by ultrasonic methanol extraction method and a solid waste sample which has been pulverized prior to being extracted by ultrasonic methanol extraction method, as an example, sample1 and sample3. The concentrations of PFCs in the solid sample and the pulverized sample were nearly the same for waste sample1 (dewatered sludge). On the other hand, the waste sample3 (ASR) shows higher concentrations of PFCs in the solid state than the pulverized one.
PFAC-20 Tim e 4.0 0 5 .0 0 6.0 0 7 .0 0 8.0 0 % 0 10 0 4.0 0 5 .0 0 6.0 0 7 .0 0 8.0 0 % 0 10 0 4.0 0 5 .0 0 6.0 0 7 .0 0 8.0 0 % 0 10 0 4.0 0 5 .0 0 6.0 0 7 .0 0 8.0 0 % 0 10 0
09 0 72 1-01 0 8: M R M of 7 Cha n nels ES-
59 9 > 7 9.9 (PFD S01 ) 1 .5 5e 5 6.67
6.68
09 0 72 1-01 0 6: M R M of 9 Cha n nels ES-
49 9 > 7 9 .9 (PFO S01 ) 1 .3 1e 5
5.98
09 0 72 1-01 0 4: M R M of 8 Cha n nels ES-
3 9 9 > 79 .9 (PF Hx S01 ) 1 .2 3e 5 5.23
09 0 72 1-01 0 2: M R M of 5 Cha n nels ES-
2 9 9 > 7 9 .9 (P FB S01 ) 8 .9 0e 4 4.31 C6 PFHxS C8 PFOS C10 PFDS C4 PFBS U S-P1 Tim e 4 .0 0 5.0 0 6 .0 0 7.0 0 8 .0 0 % 0 1 00 4 .0 0 5.0 0 6 .0 0 7.0 0 8 .0 0 % 0 1 00 4 .0 0 5.0 0 6 .0 0 7.0 0 8 .0 0 % 0 1 00 4 .0 0 5.0 0 6 .0 0 7.0 0 8 .0 0 % 0 1 00 0 90 7 21 -02 9 8: M RM o f 7 Ch a nne ls ES- 5 9 9 > 7 9 .9 (PFD S0 1) 91 6.55 6.40 6.77 6.83 0 90 7 21 -02 9 6: M RM o f 9 Ch a nne ls ES- 4 9 9 > 79 .9 (P FO S0 1) 84 5.99 5.61 6.12 6.15 0 90 7 21 -02 9 4: M RM o f 8 Ch a nne ls ES- 39 9 > 7 9.9 (PFH xS0 1) 85 4.99 4.93 4.90 5.49 5.19 0 90 7 21 -02 9 2: M RM o f 5 Ch a nne ls ES- 2 9 9 > 79 .9 (PFBS0 1) 99 4.18 4.04 4.23 4 .43 PFAC-20 Time 2.00 3.00 4.00 5.00 6.00 7.00 8.00 % 0 100 2.00 3.00 4.00 5.00 6.00 7.00 8.00 % 0 100 2.00 3.00 4.00 5.00 6.00 7.00 8.00 % 0 100 2.00 3.00 4.00 5.00 6.00 7.00 8.00 % 0 100 2.00 3.00 4.00 5.00 6.00 7.00 8.00 % 0 100 090721-010 10: MRM of 2 Channels ES- 713 > 668.7 (PFTeDA01) 2.81e5 090721-010 9: MRM of 2 Channels ES- 663 > 618.8 (PFTrDA01) 2.69e5 090721-010 8: MRM of 7 Channels ES- 613 > 568.9 (PFDoA01) 2.66e5 6.54 090721-010 7: MRM of 4 Channels ES- 563 > 518.8 (PFUdA01) 2.43e5 6.19 090721-010 6: MRM of 9 Channels ES- 513 > 468.9 (PFDA01) 2.29e5 5.85 PFAC-20 Time 2.00 3.00 4.00 5.00 6.00 7.00 8.00 % 0 100 2.00 3.00 4.00 5.00 6.00 7.00 8.00 % 0 100 2.00 3.00 4.00 5.00 6.00 7.00 8.00 % 0 100 2.00 3.00 4.00 5.00 6.00 7.00 8.00 % 0 100 2.00 3.00 4.00 5.00 6.00 7.00 8.00 % 0 100 090721-010 5: MRM of 3 Channels ES- 463 > 418.9 (PFNA01) 1.87e5 5.50 090721-010 4: MRM of 8 Channels ES- 413 > 368.9 (PFOA01) 2.46e5 5.13 090721-010 3: MRM of 2 Channels ES- 363 > 318.9 (PFHpA01) 2.51e5 4.74 090721-010 2: MRM of 5 Channels ES- 313 > 269 (PFHxA01) 1.83e5 4.30 090721-010 1: MRM of 3 Channels ES- 263 > 219 (PFPeA) 1.45e5 3.75 C5 PFPeA C6 PFHxA C7 PFHpA C8 PFOA C9 PFNA C10 PFDA C11 PFUnDA C12 PFDoDA C13 PFTrDA C14 PFTeDA US-P1 Time 2.00 3.00 4.00 5.00 6.00 7.00 8.00 % 0 100 2.00 3.00 4.00 5.00 6.00 7.00 8.00 % 0 100 2.00 3.00 4.00 5.00 6.00 7.00 8.00 % 0 100 2.00 3.00 4.00 5.00 6.00 7.00 8.00 % 0 100 2.00 3.00 4.00 5.00 6.00 7.00 8.00 % 0 100 090721-029 5: MRM of 3 Channels ES- 463 > 418.9 (PFNA01) 1.58e4 5.50 5.40 5.50 5.51 5.52 090721-029 4: MRM of 8 Channels ES- 413 > 368.9 (PFOA01) 6.44e4 5.13 5.04 090721-029 3: MRM of 2 Channels ES- 363 > 318.9 (PFHpA01) 1.18e4 4.74 4.62 090721-029 2: MRM of 5 Channels ES- 313 > 269 (PFHxA01) 1.11e4 4.30 4.19 090721-029 1: MRM of 3 Channels ES- 263 > 219 (PFPeA) 5.03e3 3.76 3.58 US-P1 Time 2.00 3.00 4.00 5.00 6.00 7.00 8.00 % 0 100 2.00 3.00 4.00 5.00 6.00 7.00 8.00 % 0 100 2.00 3.00 4.00 5.00 6.00 7.00 8.00 % 0 100 2.00 3.00 4.00 5.00 6.00 7.00 8.00 % 0 100 2.00 3.00 4.00 5.00 6.00 7.00 8.00 % 0 100 090721-029 10: MRM of 2 Channels ES- 713 > 668.7 (PFTeDA01) 4.57e4 7.09 090721-029 9: MRM of 2 Channels ES- 663 > 618.8 (PFTrDA01) 4.29e4 6.77 090721-029 8: MRM of 7 Channels ES- 613 > 568.9 (PFDoA01) 5.22e4 6.53 6.43 090721-029 7: MRM of 4 Channels ES- 563 > 518.8 (PFUdA01) 3.19e4 6.19 6.10 090721-029 6: MRM of 9 Channels ES- 513 > 468.9 (PFDA01) 4.04e4 5.85 5.76
Fig.4 PFCAs chromatogram
(Left: standard 20ng/mL, Right: waste sample 1) Sample 3 0 10 20 P F P e A P F H x A P F H p A P F O A P F N A P F D A P F U n D A P F D o D A P F T rD A P F T e D A P F B S P F H x S P F O S P F D S C o n ce n tr at io n [n g/ g-w et ] Sample 1 0 10 20 30 40 50 60 70 80 90 100 P F P eA P F H x A P F H p A P F O A P F N A P F D A P F U n D A P F D o D A P F T rD A P F T eD A P F B S P F H x S P F O S P F D S C o n ce n tr at io n[ n g /g -w e t] ASE Soxhlet Ultrasonic Sample 2 0 10 20 30 40 50 60 70 80 90 100 P F P eA P F H x A P F H p A P F O A P F N A P F D A P F U n D A P F D o D A P F T rD A P F T eD A P F B S P F H x S P F O S P F D S C on ce nt ra ti on [n g/ g-w e t] Sample 4 0 10 20 P F P e A P F H x A P F H p A P F O A P F N A P F D A P F U n D A P F D o D A P F T rD A P F T e D A P F B S P F H x S P F O S P F D S C o n ce n tr at io n [n g/ g-w et ]
Fig.3
PFCs concentration in waste sample comparing
extraction between different 3 methodsFig.5 PFASs chromatogram
Ⅳ CONCLUSIONS
The analysis method for PFCs in waste samples was established.
Ultrasonic extraction method was employed, which gave good results as a pretreatment method, for both operation blank and isotope recovery tests. These analytical procedures are composed by methanol extraction, centrifugation, concentration with nitrogen-gas and determination by LC/MS/MS. And the waste was used in solid form.
PFCs were detected at retention time between 3.75~7.15 min without interferences.
MDL was 1.4 - 3.9ng/g. It was confirmed that this method was applicable for PFCs analysis in waste samples. As the result, the difference existence ratios of PFCs in various wastes was shown, establishing profile of each waste at different sources became possible.
The result indicates that the existence ratios of PFCs in various wastes are different, which leads to the possible establishment of a profile of each waste generated from different sources.
REFERENCES
1)Kannan K., Corsolni S., Falandysz J., Fillmann G., Kumar KS., Loganathan BG, Mohd MA, Olivero J, Van Wouwe N., Ho Yang J.,Aldous K.M.:
Perfluorooctanesulfonate and related
fluorochemicals in human blood from several countries, Environ. Sci. Technol., 38,
4489-4495(2004)
2)Murakami M., Takizawa S.:Current Status and Future Prospects of Pollution in Water
Environments by perfluorinated surfactants,
Journal of Japan Society on Water Environment, 33(8), 103-114 (2010)
3)Harada K., Saito N.,Inoue K., Yoshinaga T., Watanabe T., Sasaki S., Kamiyama S., Koizumi A.:The Influence of Time, Sex and Geographic Factors on Levels of perfluorooctane sulfonate and perfluorooctanoate in human serum over the Last 25 years, J. of Occupational Health, 46,
141-147(2004)
4)Lien N.P.H., Fujii S., Tanaka S.:PFOS and PFOA contamination in Surface Water and Drinking Water in Kinki Area, The 41st Annual Conference of Japan Society on Water Environmental, 497(2007)
5)Sasaki K., Yaegashi K., Saito N.:Perfluorooctane sulfonate(PFOS) and perfluorooctanoate(PFOA), Environmental Monitoring Report 2004:
37-59(2004)
6)Yoshida M., Kobuke Y., Nakano T.:
Contamination of PFOA and PFOS in the rivers of Hyogo pref. Japan, Organohalogen Compounds,69, 2881-2884(2007)
7)Matsumura C., Takemine S., Yoshida M., Nakano T.:Contamination of perfluorinated compounds in water environment of Hyogo prefecture, 18th
Symposium on Environmrntal Chemistry Programs and Abstracts, 592-593 (2009)
8)Matsumura C., Takemine S., Yoshida M., Suzuki M., Yamamoto A., Tsurukawa M., Nakano T.: Contamination of perfluorinated compounds in the river water of Hyogo pref. Japan, Organohalogen
Compounds,71, 2315-2319(2009)
9)Yoshida M., Matsumura C., Takemine S., Okuno T., Nakano T., Yamamoto A., Tokai A., Morioka T.: Risk assessment of PFOA, PFOS and determination of perfluorinated compounds in blood,
Organohalogen Compounds, 71, 2605-2608(2009) Fig.6 Comparison solid waste with pulverized waste
sample1 0 20 40 60 P F P e A P F H xA P F H pA P F O A P F N A P F D A P F U n D A P F D o D A P F T rD A P F T e D A P F H xD A P F O D A P F B S P F H xS P F O S P F D S c o n c e n tr at io n (n g/ g) solid waste pulverized waste sample3 0 2 4 6 8 10 P F P e A P F H xA P F H pA P F O A P F N A P F D A P F U n D A P F D o D A P F T rD A P F T e D A P F H xD A P F O D A P F B S P F H xS P F O S P F D S c o n c e n tr at io n (n g/ g) solid waste pulverized waste
10)Yagi M., Yamaji A., Shibutani I.:Tendency of fluorinated organic compounds in the process of leachate disposal of final landfill site, 18th
Symposium on Environmrntal Chemistry Programs and Abstracts, 558-559 (2009)
11)Kurihara M., Yoshizawa T., Oishi O., Fujimura Y., Kojima H.:Study of PFCs in water treatment of disposal site, 19th Symposium on Environmrntal Chemistry Programs and Abstracts, 508-509(2010)
要
約
本研究は,廃棄物中において,高感度な PFCs 一斉分析手法を確立するために実施した.廃棄物 の前処理法には,ASE,ソックスレー,超音波 抽出法の3手法を比較検討した.14 種の PFCs に ついて,操作ブランク試験,同位体を用いた添加 回収試験,固形及び粉砕廃棄物を用いた含有量試 験などを実施した. その結果,前処理法としては,操作ブランク, 同位体回収試験で良好な結果であった超音波抽出 法を採用した.即ち,廃棄物中 PFCs は,メタノー ル抽出,遠心分離,窒素ガスでの濃縮,LC/MS/MS で分析した.また,廃棄物の形状は,固形状のま ま用いることとした.本研究で確立した手法で廃 棄物の含有量を測定したところ,妨害もなく,保 持時間 3.75 分∼7.15 分の間に検出できることを 確認した.様々な廃棄物中の PFCs の存在割合は異 なり,排出源の異なる廃棄物ごとのプロファイル を確立することで汚染防止対策に寄与できると期 待される.[ノート]
加古川流域陸域起源有機物との比較における
播磨灘海域の難分解性有機物に関する特性評価
仲川
直子
1吉田
光方子
1金澤
良昭
1前川
真徳
11兵庫県環境研究センター 水質環境科(〒654-0037 神戸市須磨区行平町 3-1-27)
Characteristics of Refractory Organic Matters in Surface Water at the Sea of
Harima in Comparison with Organic Matters from the Kako River Watershed
Naoko NAKAGAWA
1, Mihoko YOSHIDA
1,
Yoshiaki KANAZAWA
1and Masanori MAEKAWA
11Water Environment Division, Hyogo Prefectural Institute of Environmental Sciences,
3-1-27, Yukihira-cho, Suma-ku, Kobe, Hyogo 654-0037, Japan
近年,瀬戸内海では化学的酸素要求量(COD)の発生負荷量が減少したにもかかわらず,COD に係る環 境基準達成率の改善が進まない状況にあり,その原因の一つとして難分解性有機物の存在が懸念されて いる. そこで,これまで行ってきた大阪湾における難分解性有機物の特性評価に加え,播磨灘における難分 解性有機物の特性を流入する陸域起源有機物との比較において評価するため,播磨灘海域の海面表層水 中有機物及び難分解性有機物,さらには,加古川流域の陸域起源有機物を対象として,COD,全有機炭素 (TOC)及び紫外線吸光度の測定を行うとともに,ゲルクロマトグラフィーを実施し,有機物の構造特性, 分子サイズ特性を比較検討した.
Ⅰ
はじめに
瀬戸内海は,高度経済成長による産業活動の拡 大に伴い,産業排水や生活排水の負荷による水質 汚濁が進行していった.そのため,瀬戸内海の水 質改善を目指した総量規制が始まり,有機汚濁負 荷量は大幅に減少し,水質汚濁状況や赤潮の発生 件数等で改善がみられるようになった. しかし,瀬戸内海では,未だ有機汚濁の指標で ある COD に係る環境基準未達成の海域は存在して おり,近年では COD の改善が進まない状況にある. そこで,本研究では,閉鎖性海域のCODの改善が 進まない原因の一つとして考えられる難分解性有 機物1)の実態解明を目的に,これまで行ってきた 大阪湾における難分解性有機物の特性評価1)2)に 加え,播磨灘海域を対象とした難分解性有機物の 特性を把握するために,播磨灘海域の表層水につ いて生分解試験を行い,生分解前後における有機 物量や分子サイズ特性の変化について解析すると ともに,加古川流域の陸域起源有機物の特性との 比較を行うことにより,難分解性有機物の生成メ カニズムの解明に繋がる知見を得た.Ⅱ
方
法
1.試料採取及び試料調製方法 2011 年夏季に Fig.1 に示す播磨灘海域 5 地点 (S1∼S5)の海面表層水を採取するとともに,加 古川水系 4 地点(R1∼R4)の河川表層水,ダム湖 (Q2)及びため池(Q3)の表層水,水田(Q1)からの放流水,下水処理場(P1)及び 2 工場(P2,P3) の排出水を採取した.採取した試料は,保冷した 状態で実験室に持ち帰り,未処理の生試料とガラ ス繊維ろ紙(Whatman GF/C)によりろ過し,得ら れたろ過試料とに分けた. また,海面表層水である 5 地点(S1∼S5)の生 試料については,暗所,20±1℃の条件下で通気性 を保ち毎分 100 回転の振とう状態で,100 日間の 生分解試験を行った.この生分解試験後の試料は, 採取直後と同様にろ過し,生試料とろ過試料に分 けた. なお,100 日間生分解試験を行った後残存する 有機物は,今井らの報告3)4)に従い,難分解性有機 物とみなし,ろ過試料中に残存する有機物を難分 解性溶存有機物とみなした. 2. 態別有機物濃度の分析 1 において採取及び調製した生試料及びろ過試 料について,化学的酸素要求量 COD 及び全有機炭 素濃度 TOC を分析した. ただし,COD については,JIS K0102 175)に定め る 100℃過マンガン酸カリウムによる酸素消費量 により求め,TOC については,島津製全有機体炭 素計 TOC−5000A を用いた JIS K0102 22.26)に定 める燃焼酸化−赤外線式 TOC 自動計測法により求 めた. なお,ろ過試料から得られた結果は溶存態とし, 生試料から得られた結果から溶存態を差し引いた 値を懸濁態とした. 3. 紫外線吸光度(UV260)の分析 芳 香族 化 合 物 や不 飽 和 二 重 結合 を 持 つ 化合 物 が紫外部波長 250∼280nm に大きな吸収を示す 7) ことから,日立製分光光度計 U−2001 により,光 路長 5cm の石英セルを用いて,1 において採取及 び調製したろ過試料の紫外部波長 260nm における 吸光度(UV260)について測定した. ただし,単位はセル長当たりのミリ吸光度とし, mABS/cm で表現した. 4. ゲルクロマトグラフィー 1 において採取及び調製したろ過試料の内 P3 を 除くろ過試料についてロータリーエバポレーター を用いて 5 倍濃縮になるように減圧濃縮を行った. 得られた濃縮試料と P3 のろ過試料はシリンジフ ィルター(Whatman GD/X)でろ過処理をし,ゲル クロマトグラフィー測定用試料とした. ゲルろ過は,内径 2.5cm のカラムを用いて,担 体として Sephadex G-15 を 90cm の高さになるよう に充填し,亀井らの報告8)9)に準拠した方法で実施 した. なお,ゲルクロマトグラフィー測定用試料の添 加量は 5mL とし,溶離液は蒸留水を用いて,自然 流下速度で溶出させ,得られた溶出液を 5mL ごと に試験管に分取した.分取した溶出液については, それぞれ溶存態有機炭素濃度 DOC を測定し,ゲル クロマトグラムを作成した. ただし,DOC については,2 に示す TOC と同様の 方法により求めた.
Fig.1 Location of sampling sites
Ⅲ
結果および考察
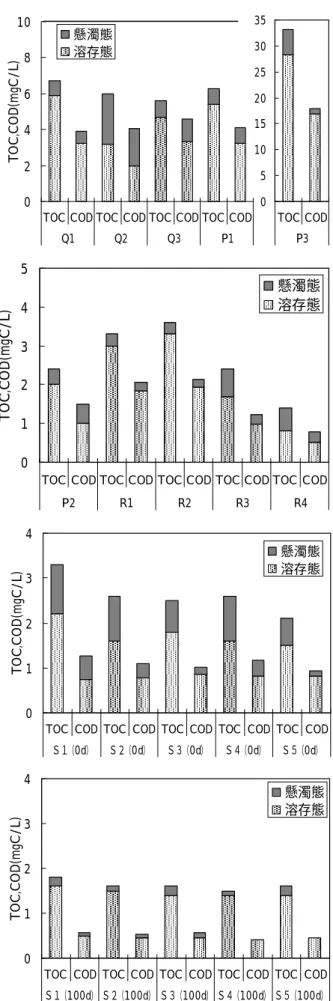
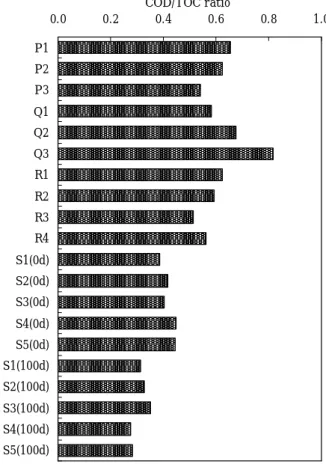
1. COD 及び TOC を指標とした態別有機物量 陸 域 地 点 採 取 試 料 , 海 域 地 点 の 生 分 解 前 試 料 (0d)及び 100 日生分解後試料(100d)の COD 及 び TOC の結果を溶存態と懸濁態に区分して,Fig.2 に,TOC に対する COD の割合を Fig.3 に示すとと もに,海域 5 地点における生分解試験前の 0 日目 の有機物濃度に対する 100 日生分解試験後の有機 物濃度の割合を COD 及び TOC 別に Table 1 に示す. なお,COD の単位は TOC と同じとするため,酸 素濃度を炭素濃度に換算〔COD(mgC/L)=(12/32) ×COD(mgO2/L)〕して表記している. Fig.2 より,ダム湖(Q2)を除く陸域試料に比 5S5 5S4 5S3 S25 5 S1 5 5 5 5 5 5 5 5 5 5 Q1 Q3 Q2 R2 R1 R3 R4 P3 P1 P2
べて,生分解前の海域試料 S1(0d)∼S5(0d)は,懸 濁態の占める割合が高いことが分かった.一方, 100 日生分解後の海域試料 S1(100d)∼S5(100d)は 溶存態の占める割合が高く,いずれも 80%以上が 溶存態であることが分かった.そのため,海面表 層水中には,生分解を受けやすい懸濁態の有機物 が存在していると考えられ,比較的生分解を受け やすいと考えられる植物プランクトンが懸濁態有 機物として多く含まれていたと推察された. また,この 100 日間の生分解後に残存する有機 物である難分解性有機物の 80%以上が溶存態で あるという結果は大阪湾における難分解性有機物 の特性1)と一致した. 次に,Fig.3 より,COD/TOC の値を比較すると, ため池(Q3)において最も高い値を示し,次いで, ダム湖(Q2),下水処理場(P1),河口域(R1),工 場(P2)が高く,海域試料 S1(0d)∼S5(0d) はい ずれも陸域試料より低い値となった.そのため, 海面表層水は陸水に比べ,酸化を受け COD 値とし て評価される有機物の全有機物に占める存存比率 が低いことが示された.また,100 日生分解後の 海域試料 S1(100d)∼S5(100d)では,いずれも生分 解前の海域試料 S1(0d)∼S5(0d)に比べて COD/TOC の値が低くなっており,生分解前の有機物に比べ て生分解後に残存する難分解性有機物は,酸化を 受け COD 値として評価される有機物の含まれる割 合が小さいことが分かった. さらに,Table 1 に示される 100 日生分解後に 残存する有機物の割合を TOC,COD 別に見ると, COD を指標とした場合の方が TOC を指標とした場 合に比べて低い値となった.これらのことより, 有機物量を COD 値で評価した場合,有機物量を TOC 値で評価した場合に比べて生分解を受けて減少す る有機物の割合を大きく表してしまうことが示唆 された. 一方,TOC を指標とした場合のみで 100 日生分 解後の残存率をみると,いずれの地点においても 残存率は 50%以上であることが分かった.そのた め,播磨灘海域では,海面表層水中の有機物は炭
Fig.2 Suspended and Dissolved COD and TOC 0
1 2 3 4
TOC COD TOC COD TOC COD TOC COD TOC COD
S1(0d) S2(0d) S3(0d) S4(0d) S5(0d) T O C ,C O D (m gC / L ) 懸濁態 溶存態 0 1 2 3 4
TOC COD TOC COD TOC COD TOC COD TOC COD S1(100d) S2(100d) S3(100d) S4(100d) S5(100d) T O C ,C O D (m gC / L ) 懸濁態 溶存態 0 1 2 3 4 5
TOC COD TOC COD TOC COD TOC COD TOC COD
P2 R1 R2 R3 R4 T O C ,C O D (m gC / L ) 懸濁態 溶存態 0 2 4 6 8 10
TOC COD TOC COD TOC COD TOC COD
Q1 Q2 Q3 P1 T O C ,C O D (m gC / L ) 懸濁態 溶存態 0 5 10 15 20 25 30 35 TOC COD P3
Table 1 Ratio of COD and TOC after a 100−day incubation to COD and TOC before incubation
Sample No. S1 S2 S3 S4 S5
0.55 0.62 0.64 0.58 0.76 0.44 0.48 0.56 0.35 0.48 TOC (100d)/TOC(0d)
素換算で50%以上が難分解性有機物であることが 示され,100日生分解試験後に残存する難分解性有 機物の割合が炭素換算で50%以上であった大阪湾 1)と同様の結果が得られた. 次に,これらのTOCにおける残存率を地点毎に比 較すると,Fig.2に示される生分解前の海域試料 S1(0d)∼S5(0d)におけるTOC値から,TOC値が低い 地点ほど残存率は高くなることが分かり,播磨灘 海域では,有機物濃度の低い地点ほど有機物中に 含まれる難分解性有機物の割合が高くなる傾向が 認められた. 2. 溶存態有機炭素濃度 DOC に対する UV260 の比 (UV260/DOC)による溶存有機物の構造特性 陸域地点のろ過試料,海域地点の生分解前のろ 過試料(0d)及び 100 日生分解後のろ過試料(100d) における DOC,UV260 及び UV260/DOC を Table 2 に示す. Table 2 より,河川 R1∼R4 における UV260/DOC は,22∼25(mABS/cm/(mg/L))という結果になり, UV260/DOC の値が 20∼30(mABS/cm/(mg/L))の範 囲に入る河川の割合が高いという報告 10)と一致 した.また,最も上流に位置する R4 と水田(Q1) において UV260/DOC は高い値を示しており,土壌 腐植物質を多く含む森林流出水の UV260/DOC が 30 (mABS/cm/(mg/L))前後と高くなるという知見10) から,河川上流域において森林等から流出する土 壌腐植物質が多く含まれていることと水田に土壌 腐植物質由来の有機物が多く含まれていることが 伺えた. さらに,工場(P2)の試料は,他の陸域試料よ り UV260/DOC の値が低く,海域試料 S1(0d)∼ S5(0d)の試料と同程度となっていたが,これは, 外来性由来の有機物に比べて内部生産由来の有機 物の方が DOC に対する UV260 の比が低いという報 告10)があることから,陸域からの影響より海水中 に含まれる植物プランクトンの影響が大きかった ためと考えられた. 次に,生分解前の海域試料S1(0d)∼S5(0d)の と100日生分解後の海域試料S1(100d)∼S5(100d) を比較すると,比較的DOCの値が高いS1は,生分解 を受けることによりUV260/DOCの値が高くなった が,その他の地点では逆にUV260/DOCの値が低くな ることが分かった.このことより,DOC値の高い沿 岸域では,芳香族や不飽和二重結合等の官能基を 持っていない溶存有機物で比較的生分解を受けや
Fig.3 COD ratio for TOC
Table 2 DOC,UV absorbance at 260nm and
ratio of UV absorbance at 260nm to DOC COD/TOC ratio 0.0 0.2 0.4 0.6 0.8 1.0 P1 P2 P3 Q1 Q2 Q3 R1 R2 R3 R4 S1(0d) S2(0d) S3(0d) S4(0d) S5(0d) S1(100d) S2(100d) S3(100d) S4(100d) S5(100d)
Sample No. DOC (mg/L) UV260 (mABS/cm) UV260/DOC (mABS/cm/(mg/L)) P1 5.4 104 19.3 P2 2.0 32 16.2 P3 28.3 606 21.4 Q1 5.9 153 25.9 Q2 3.2 56 17.6 Q3 4.7 98 20.8 R1 3.0 66 22.1 R2 3.3 76 22.9 R3 1.7 37 21.9 R4 0.8 20 25.0 S1(0d) 2.2 39 17.8 S2(0d) 1.6 24 14.8 S3(0d) 1.8 27 14.9 S4(0d) 1.6 28 17.4 S5(0d) 1.5 28 18.4 S1(100d) 1.6 29 18.1 S2(100d) 1.5 18 12.3 S3(100d) 1.4 20 14.4 S4(100d) 1.4 18 13.1 S5(100d) 1.4 17 12.4
すい有機物が多く存在するが,他の地点では,溶 存有機物中に含まれる芳香族や不飽和二重結合等 の官能基の部分の方が生分解を受けやすいことが 推察された. 3. ゲルクロマトグラフィーによる溶存有機物の 分子量分布特性 陸域地点のろ過試料,海域地点の生分解前のろ 過試料(0d)及び100日生分解後のろ過試料(100d) を用いて実施したゲルクロマトグラフィーにより 得られたゲルクロマトグラムをFig.4に示す. なお,本研究に使用したSephadex G-15は分画可 能範囲が分子量1,500以下である11)ため,分子量 20,000,000 の Blue Dextran の 溶 出 位 置 で あ っ た Fraction No.34をみかけの分子量1500以上の位置 とし,分子量1,355のVitamin B12の溶出位置であ ったFraction No.55をみかけの分子量1,355とし た. Fig.4 より,みかけの分子量 1500 以上の高分子 量域 に最 大値 を 示す ピー クが 認め られ たの は水 田(Q1),河川上流側(R3,R4)であり,これら は Table 2 において UV260/DOC の値も高かったこ とから,河川上流域と水田には土壌腐植物質を多 く含 んで いる た めに 高分 子量 域に 最大 値を 示す ピークが現れたと考えられた.また,河口域に位 置する R1 を除いた陸域試料は,その大部分がみ かけの分子量 1355 以上の範囲にピークが現れて おり,陸域起源の溶存有機物は低分子量域にはほ とんど分布しないことが分かった.さらに,河川 R1∼R4 を比較すると,上流から下流にいくに従い, ピー クの 位置 が 高分 子量 側か ら低 分子 量側 へと 変化することが分かった.このことから,河川水 に含 まれ る溶 存 有機 物は 上流 から 下流 に向 かっ て,分子量が小さくなっていくことが示唆された. 一方,海域試料 S1(0d)∼S5(0d)では,みかけの 分子量 1500 以上の高分子量域に小さなピークが 認められたものの,最大を示すピークはみかけの 分子量 1355∼1500 の間とみかけの分子量 1355 以 下の低分子量域であったため,高分子量域に分布 する 陸域 起源 の 溶存 有機 物は 海面 表層 水中 には ほとんど存在しないことが分かった.また,みか けの分子量 1355∼1500 の間に示されるピークの 位置はダム湖(Q2)とため池(Q3)において示さ れるピークの位置と類似していたため,海水,淡 水にかかわらず閉鎖性水域では,この位置にピー クを示す溶存有機物が存在すると推察された. 次に,生分解前の海域試料 S1(0d)∼S5(0d)と 100 日生分解後の海域試料 S1(100d)∼S5(100d)を 比較すると,みかけの分子量 1355 以上の位置に 認められるピークは 100 日生分解後に大きな減少 は認められず,みかけの分子量 1355 以下の低分 子量域の位置に認められるピークは 100 日生分解 後に大きく減少することが分かった.一方,大阪 湾海面表層水では,100 日間の生分解による低分 子量域のピークの減少がほとんど認められず 2), 植物プランクトン由来の溶存有機物では,低分子 量域のピークが 100 日生分解後に減少していた12) ことから,播磨灘海域において低分子量域に分布 する 溶存 有機 物 は植 物プ ラン クト ン由 来の 有機 物である可能性が高いと考えられた. さらに,100日生分解後の海域試料S1(100d)∼ S5(100d)に共通して認められるピークの位置は, みかけの分子量1355∼1500の間と低分子量域であ り,これは大阪湾における難分解性溶存有機物が 示すピークの位置2)と一致していたため,海域に 係わらず,海面表層水中に存在する難分解性溶存 有機物はみかけの分子量1355∼1500の間と低分子 量域に分布すると考えられた.
Ⅳ
結
論
本研究では,播磨灘の海面表層水中難分解性有 機物の特性を把握するため,生分解特性,構造特 性及び分子サイズ特性について,加古川流域の陸 域起源有機物との比較をしながら解析を行い,さ らに,大阪湾における難分解性有機物の特性との 相違について検討した. その結果,播磨灘海域における難分解性有機物 の特性の一部が大阪湾海域における難分解性有機 物の特性と一致していることが認められた他,陸 域起源有機物と海域中有機物では多くの点で特性 が異なること等が示された.本研究からは,陸域 起源有機物が与える海域有機物への影響を明確に 示すことができなかったが,今後は,陸域起源有 機物が海域中で生分解を受ける過程についての分 析を加え,陸域起源有機物が海域中難分解性有機 物の生成に及ぼす影響についてさらに検討してい くこととする.Fig.4 Gel chromatograms with Sephadex G-15 0 1 2 3 4 20 30 40 50 60 70 80 90 Fraction No.(1Fr.=5mL) D O C (m g/ L ) P1 P2 0 1 2 3 4 5 20 30 40 50 60 70 80 90 Fraction No.(1Fr.=5mL) D O C (m g/ L ) P3 Q1 0 1 2 3 4 20 30 40 50 60 70 80 90 Fraction No.(1Fr.=5mL) D O C (m g/ L ) Q2 Q3 0 1 2 3 4 20 30 40 50 60 70 80 90 Fraction No.(1Fr.=5mL) D O C (m g/ L ) R1 R2 0 1 2 20 30 40 50 60 70 80 90 Fraction No.(1Fr.=5mL) D O C (m g/ L ) R3 R4 0 1 2 3 20 30 40 50 60 70 80 90 Fraction No.(1Fr.=5mL) D O C (m g/ L ) S1(0d) S1(100d) 0 1 2 20 30 40 50 60 70 80 90 Fraction No.(1Fr.=5mL) D O C (m g/ L ) S2(0d) S2(100d) 0 1 2 20 30 40 50 60 70 80 90 Fraction No.(1Fr.=5mL) D O C (m g/ L ) S3(0d) S3(100d) 0 1 2 20 30 40 50 60 70 80 90 Fraction No.(1Fr.=5mL) D O C (m g/ L ) S4(0d) S4(100d) 0 1 2 20 30 40 50 60 70 80 90 Fraction No.(1Fr.=5mL) D O C (m g/ L ) S5(0d) S5(100d)
謝
辞
本研究を実施するにあたり,試料採取にご協力 を頂きました関係機関,関係者の皆様に厚くお礼 申し上げます. また,本研究は大阪湾広域臨海環境整備センタ ーによる「大阪湾圏域の海域環境再生・創造に関 する研究助成制度」の助成を受けました. ここに記して謝意を表します.文
献
1) 仲川直子, 金澤良昭,梅本諭,上村育代:大阪 湾表層水中有機物の生分解前後における特性変化 に つ い て . 兵 庫 県 環 境 研 究 セ ン タ ー 紀 要 , 1 , 25-30(2010) 2) 仲川直子, 金澤良昭,梅本諭,上村育代:陸域 溶存有機物との比較における大阪湾域難分解性溶 存有機物の構造特性及び分子量分布特性について. 兵庫県環境研究センター紀要,1,31-36(2010) 3) 今井章雄:難分解性溶存有機物.環境儀,(13), 4−5,独立行政法人国立環境研究所発行,茨城県 (2004) 4) 今井章雄:湖沼トレンドモニタリングでみる難 分解性有機物の特性と動態.地球環境研究センタ ーニュース,14(7),11-14(2003) 5) 日本規格協会:工場排水試験方法JIS K 0102, 42-44,日本規格協会発行,東京(1998) 6) 日本規格協会:工場排水試験方法JIS K 0102, 57,日本規格協会発行,東京(1998) 7) 矢部禎昭:COD 及び排出量の測定技術.用水と 廃水,22(10),11-19(1980) 8) 亀井翼,丹保憲仁:水質のマトリックス的評価 のためのゲルクロマトグラフィー.水道協会雑誌, (519),24-41(1977) 9) 丹保憲仁,亀井翼:マトリックスによる都市水 代謝の水質評価.水道協会雑誌,(502),2-24(1976) 10) 福島武彦,今井章雄,松重一夫,井上隆信, 小澤秀明:湖水溶存有機物の紫外線吸光度:DOC 比 の 特 性 と そ れ の 水 質 管 理 へ の 利 用 . 水 環 境 学 会 誌,20(6),397-403(1997)11) Sephadex : gel filtration in theory and
practice,Pharmacia Fine Chemicals,8
12) 仲川直子, 金澤良昭,宮原一隆,上村育代, 梅本諭:珪藻類を対象とした植物プランクトン由 来の難分解性溶存有機物に関する特性評価.兵庫
県環境研究センター紀要,2,1-7(2011)
Abstract
The existence of the refractory organic matters (ROM) have been pointed out as reason that the Seto Inland Sea has the problem that the chemical oxygen demand (COD) values have remained at the same level.
In comparison with the organic matters from the Kako River watershed, the ROM in surface water at the Sea of Harima were examined by total organic carbon, COD, UV absorbance, and analysis of molecular weight by gel chromatography.
These results suggested that COD was not suitable as the index for evaluation of the ROM, and the ROM in sea area had the same molecular weights.
[ノート]
兵庫県姫路市における大気中粒子状物質及びガス状物質の並行測定(1)
−成分濃度の季節変動−
常友
大資
1,中坪
良平
1,平木
隆年
1,
島
正之
2,余田
佳子
2,齊藤勝美
2,3 1兵庫県環境研究センター 大気環境科(〒654-0037 神戸市須磨区行平町 3-1-27) 2兵庫医科大学 公衆衛生学(〒663-8501 西宮市武庫川町 1-1) 3環境計測株式会社(〒612-8419 京都市伏見区竹田北三ツ杭町 84)Parallel measurement of atmospheric particulate and gases
in Himeji, Hyogo (1) - Season variation of components -
Daisuke TSUNETOMO
1, Ryouhei NAKATSUBO
1, Takatoshi HIRAKI
1,
Masayuki SHIMA
2, Yoshiko YODA
2and Katsumi SAITOH
2,31Atmospheric Environmental Division, Hyogo Prefectural Institute of Environmental Sciences,
3-1-27, Yukihira-cho, Suma-ku, Kobe, Hyogo 654-0037, Japan
2Department of Public Health, Hyogo College of Medicine,
1-1, Mukogawa-cho, Nishinomiya, Hyogo 663-8501, Japan
3Eco Analysis Corporation,
84, Takeda-kita Mitsugui-cho, Fushimi-ku, Kyoto, Kyoto 612-8419, Japan
兵庫県における PM2.5濃度の変動要因に関する情報を得ることを目的とし,2010 年 7 月から 2011 年 5
月までの 1 年間 4 季節,兵庫県姫路市において粒子状物質(PM10<,PM10-2.5,PM2.5)及びガス状物質(HCl,
HNO3,SO2,NH3,HONO)の測定を各季 20 日間実施した.また,粒子状物質については質量濃度及び主要
成分(炭素成分,イオン成分,無機元素成分)の分析を行った.その結果,PM2.5中の主要成分の割合は,
全期間において SO42-が最も高く,次いで OC が高かった.SO42-の濃度変動が大きいのに対し,OC の濃度
変動は小さく,PM2.5質量濃度の高濃度時には SO42-が大半を占めるが,低濃度時には OC が大半を占めて
いた.また,PM2.5成分濃度の OC,SO42-,NH4+,K+及び大気中総イオン濃度の T-SO42-,T-NO3-,T-NH4+は全
期間において PM2.5質量濃度と相関が高く,通年で PM2.5質量濃度の支配要因になっていると考えられた.
Ⅰ
はじめに
平成21年9月9日,環境省は空気動力学径が2.5 μmより大きい粒径の粒子を50%の割合で除去した 大気中微小粒子状物質(PM2.5,以下同様に粒径の差 異によって粒子状物質をPM10<,PM10-2.5,PM2.5に分 類する)の 環境 基準を 告 示し,1年 平均 値が15μ g/m3以下であり,かつ,1日平均値が35μg/m3以下 であることとしている1).また,測定方法を濾過 捕集による質量濃度測定方法(濾過捕集法)又はこの方法によって測定された質量濃度と等価な値 が得 られ る と認 めら れ る 自動 測定 機 によ る方 法 (自動測定法)としている. 現在,大気汚染防止法に基づき地方自治体によ る常時監視体制の整備が進められているところで あるが,これまでに環境省等が実施したPM2.5の測 定結果2)より,我が国の都市部におけるPM 2.5の質 量濃度は全国的に環境基準を上回ると予想されて いる. PM2.5の低減対策を検討する上では,質量濃度だ けでなく成分濃度の把握が重要であり,そのため には濾過捕集法によるPM2.5の測定が必要である. 濾過捕集法によるPM2.5質量濃度と成分濃度の測定 に関する日本国内での報告例は,名古屋市での測 定3)や,埼玉県での測定4)5),環境省の調査報告2) 等があるが,未だ少ないのが現状である. 当センターにおいても,中坪ら6)7)8)がPM 2.5と同 時にPM10-2.5の質量濃度及び主要成分濃度を2週間 程度の平均濃度で把握することを目的とした兵庫 県(神戸市須磨区,芦屋市,姫路市)におけるモ ニタリング調査について報告してきたが,PM2.5の 質量濃度及び主要成分濃度の日平均値を通年で季 節別に測定した報告はなかった. また,熊谷ら9)は,関東平野内陸部では光化学 反応に起因すると推察される二次生成粒子の濃度 増加によって微小粒子濃度が増加することを報告 しており,PM2.5の高濃度要因や発生源を把握する 上では,質量濃度や主要成分濃度だけでなく,二 次生成粒子の前駆ガス状物質の把握も重要となる. 本報告では,兵庫県姫路市においてPM2.5をはじ めとする粒子状物質と同時にガス状物質を測定し, PM2.5質量濃度の高濃度及び低濃度時の主要成分を 把握すると共に,PM2.5の濃度変動要因を考察した.
Ⅱ
方
法
2.1 測定地点及び期間 測定は,兵庫県の姫路市飾磨市民センター屋上 (北緯34.80度,東経134.68度,地上高約30m)で, 夏季(2010年7月30日∼8月18日),秋季(同年10 月21日∼11月9日),冬季(2011年1月11日∼30日), 春季(同年5月10日∼29日)において,夏季のみ午 前9時30分から翌午前9時30分まで,夏季以外は午 前10時00分から翌午前10時00分までの24時間周期 で実施した. 2.2 試料の採取方法 粒子状物質は,東京ダイレック社製マルチノズ ルカスケードインパクタを装着したNILUフォルダ 及び10ライングローバルサンプラ(マスフローコ ントローラー付,フィルタ別に2台使用)を用いて, 流速10.0L/minで,PM10<,PM10-2.5,PM2.5に分級し, 捕集した. フィルタは,47mmφ及び47×20mmφのPTFEフィ ルタ(PALL社製サポートリング付Teflo)及び石英 繊維フィルタ(PALL社製2500QAT-UP)を使用した. ガス状物質は,フィルタパック法(5段ろ紙)に より粒子状物質を捕集するPTFEフィルタの後段に連結することで,HCl,HNO3,SO2,NH3,HONOを捕
集した. 2.3 質量濃度及び成分濃度の測定方法 捕集前後のPTFEフィルタは,環境省が定める標 準測定法10)であるフィルタ法に準じ,相対湿度約 35%に調整したデシケーターに24時間以上静置し た後,温度21.5±1.5℃,相対湿度35±5%に調整し た秤量室内にて,Sartorius社製ウルトラミクロ天 秤SE2-F(秤量下限0.1μg)を用いて秤量した. 炭素成分(有機炭素OC,元素状炭素EC)は,熱 分 離 光 学 補 正 法 ( IMPROVE 法 ) に よ り , Sunset Laboratory社製カーボンアナライザーを用いて分 析した. イオン成分(Cl-,NO 3-,SO42-,Na+,NH4+,K+, Mg2+,Ca2+)は,イオンクロマトグラフ法により, DIONEX社製ICS-2100を用いて分析した. 無機元素成分(Na,Al,K,Ca,Sc,Ti,V,Cr, Mn,Fe,Ni,Cu,Zn,As,Sr,Mo,Cd,Sb,Pb) は,誘導結合プラズマ質量分析法(ICP-MS法)に よりThermo社製Xシリーズ2を用いて分析した.
Ⅲ
結果および考察
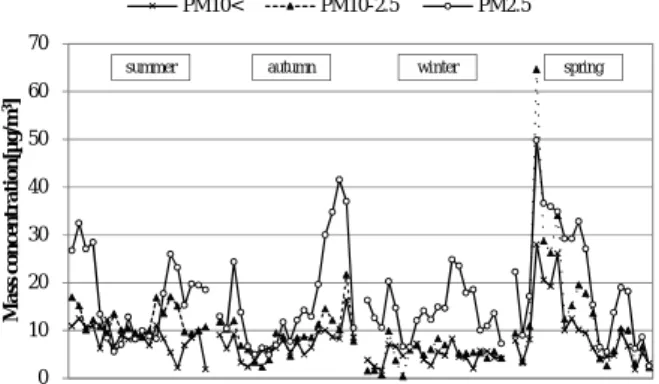
3.1 質量濃度の測定結果 Fig.1に,粒子状物質質量濃度(日平均)の推移 を粒径別に示し,Table 1に,粒子状物質質量濃度 (日平均)の平均値,最大値及び最小値を粒径別, 期間別に示した.全期間における平均値は,PM2.5 が最も高く17.0μg/m3,次いでPM 10-2.5が10.3μg/m3, PM10<が7.6μg/m3となった.日平均値が最大を示し たのは,全粒径において,春季の神戸において黄 砂が観測された2011年5月13日であり11),PM 10-2.5 が最も高く64.7μg/m3,次いでPM 2.5が49.8μg/m3,0 10 20 30 40 50 60 M a ss co n c e n tr a ti o n [µ g /m 3]
OC0 EC Cl- NO3- SO42- Na+ NH4+ K+ Mg2+ Ca2+ Total elements unknown
10 20 30 40 50 60 M a ss co n ce n tr a ti o n [µ g /m 3]
OC EC Cl- NO3- SO42- Na+ NH4+ K+ Mg2+ Ca2+ Total elements unknown
0 10 20 30 40 50 60 M a ss co n ce n tr a ti o n [µ g /m 3]
OC EC Cl- NO3- SO42- Na+ NH4+ K+ Mg2+ Ca2+ Total elements unknown
26.2% 6.5% 2.0% 28.8% 9.7% 3.1% 20.5% 0 10 20 30 40 50 60 M a ss c o n c en tr a ti o n [µ g /m 3]
OC EC Cl- NO3- SO42- Na+ NH4+ K+ Mg2+ Ca2+ Total elements unknown
19.9% 8.9% 5.5% 20.4% 8.5% 2.3% 31.4% 13.6% 9.7% 1.4% 11.3% 19.9% 10.3% 3.7% 27.6% 17.0% 6.6% 5.4% 20.2% 7.9% 3.7% 35.8% autumn summer winter spring
Fig.2 Variations of daily mean component concentration of PM2.5
OC EC Cl- NO
3- SO42- Na+ NH4+ K+ Mg2+ Ca2+ Total elements unknown
[μg/m3] PM10< PM10-2.5 PM2.5 PM10< PM10-2.5 PM2.5 PM10< PM10-2.5 PM2.5 summer 8.3 12.0 16.9 12.5 17.1 32.4 1.9 8.6 5.6 autumn 7.3 9.2 16.2 16.4 21.7 41.6 2.4 2.4 4.9 winter 4.7 4.9 14.1 8.3 9.9 24.8 1.7 0.4 6.6 spring 10.1 15.1 21.0 28.0 64.7 49.8 1.8 2.3 2.6 spring* 9.2 12.4 19.5 26.1 34.1 36.6 1.8 2.3 2.6 all seasons 7.6 10.3 17.0 28.0 64.7 49.8 1.7 0.4 2.6
※ "spring*" excludes observational day of yellow sand.
Mean Max. Min.
0 10 20 30 40 50 60 70 M a ss co n ce n tr a ti o n [µ g /m 3] PM10< PM10-2.5 PM2.5 spring winter autumn summer
Fig.1 Variations of daily mean mass concentration of particulate
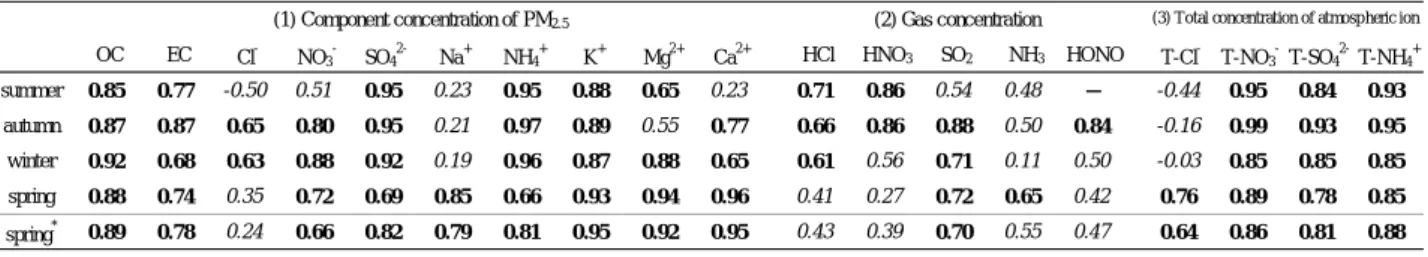
Table 1 Daily mean, maximum, minimum mass concentration of particulate PM10<が28.0μg/m3となった. 黄砂観測日を除くと,全期間においてPM2.5の濃 度変動が最も大きく,大気中の全粒子状物質の濃 度変動に及ぼす影響が大きかった.また,PM2.5が 高濃度を示した場合でも他の粒径が高濃度を示す とは限らず,粒径毎に濃度変動の要因が異なる可 能性が示唆された. 3.2 PM2.5成分濃度の測定結果 Fig.2に,PM2.5成分濃度の日平均値の積み上げグ ラフを期間別に示し,各期間における各成分の平 均割合を円グラフで示した.全期間において,炭 素成分及びイオン成分がPM2.5質量濃度の大半を占 めており,SO42-の割合が最も高く,次いでOCの割 合が高かった.また,SO42-の濃度変動が大きいの に対し,OCの濃度変動は小さく,PM2.5質量濃度の 高濃度時にはSO42-が大半を占める一方で,低濃度 時にはOCが大半を占めていた. 夏季においては,SO42-の割合が平均で28.8%を占 め,全期間を通じて最も高かった.一方,冬季に おいては,半揮発性のNO3-の割合が高くなり,平 均で11.3%を占め,全期間を通じて最も高かった. 日平均値が最大を示した黄砂観測日においては, 炭素成分,イオン成分及び無機元素成分の割合の 合計が32.8%と低く,黄砂に含まれるPM2.5の主要成 分はこれら以外の成分であることが示唆された. 3.3 PM2.5質量濃度と他成分の相関 Table 2に,PM2.5質量濃度と(1)PM2.5成分濃度及 び(2)ガス状物質濃度,(3)大気中総イオン濃度(全 粒径の粒子状物質中のイオン成分とガス状物質濃 度の合計)との相関係数を示した. (1)PM2.5成分濃度については,OC及びK+が全期間 において0.8以上,SO42-及びNH4+が春季以外におい て0.9以上,春季についても黄砂観測日を除くと 0.8以上となることから,これらは通年でPM2.5質量 濃度の支配要因になっていると考えられた. (2)ガス状物質濃度については,HNO3が冬季及び 春季で0.8未満,SO2が夏季で,NH3が全期間で0.7 未満であることから,これらは季節によっては PM2.5質量濃度の支配要因になっていないと考えら れた.
0.0 0.1 0.2 0.3 0.4 0.5 0.6 0.7 0.8 0.9 1.0 R a ti o o f p a r ti c u la te [-] PM10< PM10-2.5 PM2.5 NO3- SO42- NH4+ Cl
-Fig.3 Ratio of particulate for each component
OC EC Cl- NO3- SO42- Na+ NH4+ K+ Mg2+ Ca2+ HCl HNO3 SO2 NH3 HONO T-Cl- T-NO3- T-SO42-T-NH4+
summer 0.85 0.77 -0.50 0.51 0.95 0.23 0.95 0.88 0.65 0.23 0.71 0.86 0.54 0.48 − -0.44 0.95 0.84 0.93
autumn 0.87 0.87 0.65 0.80 0.95 0.21 0.97 0.89 0.55 0.77 0.66 0.86 0.88 0.50 0.84 -0.16 0.99 0.93 0.95
winter 0.92 0.68 0.63 0.88 0.92 0.19 0.96 0.87 0.88 0.65 0.61 0.56 0.71 0.11 0.50 -0.03 0.85 0.85 0.85
spring 0.88 0.74 0.35 0.72 0.69 0.85 0.66 0.93 0.94 0.96 0.41 0.27 0.72 0.65 0.42 0.76 0.89 0.78 0.85
spring* 0.89 0.78 0.24 0.66 0.82 0.79 0.81 0.95 0.92 0.95 0.43 0.39 0.70 0.55 0.47 0.64 0.86 0.81 0.88
※1 "Italic " means "p ≧0.01", others mean "p <0.01". ※2 "−" means "unmeasured". ※3 "T" means "Total". ※4 "spring*" excludes observational day of yellow sand. (1) Component concentration of PM2.5 (2) Gas concentration (3) Total concentration of atmosp heric ion
Table 2 Coefficient of correlation between mass concentration of PM2.5 and component concentration of PM2.5, gas concentration,
total concentration of atmospheric ion
(3)大気中総イオン濃度については,全硝酸成分 T-NO3-及び全アンモニア成分T-NH4+が全期間で0.8 以上,全硫酸成分T-SO42-が全期間で0.7以上である ことから,これらは通年でPM2.5質量濃度の支配要 因になっていると考えられた. 3.4 粒子化率 Fig.3に,大気中総イオン濃度に占める粒子状物 質の成分濃度の割合を粒子化率とし,捕集した全 イオン成分における粒子が占める平均割合を粒径 別,期間別に示した. Cl-については,春季を除いて粒子化率が0.5以 上であり,そのうちの大半がPM10<及びPM10-2.5の粗 大粒子で占めていた.また,半揮発性のCl-は夏季 及び春季よりも秋季及び冬季の方が粒子化率が高 かった.PM2.5については,冬季が最も高く,夏季 が最も低かった. NO3-については,全期間を通じて粒子化率が0.6 以上であり,冬季のみPM2.5が大半を占める一方で, 冬季以外については,粗大粒子の割合が大きかっ た.また,Cl-同様,半揮発性のNO 3-は夏季よりも 冬季の方が粒子化率が高かった.PM2.5については, 冬季が最も高く,夏季が最も低かった. SO42-については,秋季を除いて粒子化率が0.5 未満であった.また,全期間で大半をPM2.5が占め ていた. NH4+については,冬季を除いて粒子化率が0.4未 満であった.また,SO42-同様,全期間で大半をPM2.5 が占めていた. PM2.5の主要成分であるSO42-及びNH4+は,捕集した 大半がPM2.5で構成されているが,粒子と同等以上 にガスとして捕集されていることが示唆された.
Ⅳ
結
論
2010年7月から2011年5月までの1年間4季節,姫 路市において粒子状物質(PM10<,PM10-2.5,PM2.5)及びガス状物質(HCl,HNO3,SO2,NH3,HONO)の
測定を行った.粒子状物質については,質量濃度 及び主要成分(炭素成分,イオン成分,無機元素 成分)の分析を行い,以下の結果を得た. ①全期間における粒子状物質質量濃度の平均値は, PM2.5が17.0μg/m3,PM 10-2.5が10.3μg/m3,PM10<が7.6 μg/m3であった.また,PM 2.5質量濃度が高濃度を 示した場合でも他の粒径が高濃度を示すとは限ら ず,粒径毎に濃度変動の要因が異なる可能性が示 唆された. ②PM2.5中の主要成分の割合は,炭素成分とイオン 成分が大半を占め,全期間で60%以上であり,SO4 2-が最も高く,次いでOCが高かった.また,SO42-の 濃度変動が大きいのに対し,OCの濃度変動は小さ く,PM2.5質量濃度の高濃度時にはSO42-が大半を占 める一方で,低濃度時にはOCが大半を占めていた. ③PM2.5成分濃度のOC,SO42-,NH4+,K+及び大気中総 イ オ ン 濃 度 の T-SO42-, T-NO3-, T-NH4+は 全 期 間 で PM2.5質量濃度と相関が高く,通年でPM2.5質量濃度 の支配要因になっていると考えられた.