How is the form of our head, face or body de- termined? We know, to some extent, how genes and ontogenetic processes influence such struc- tures. Recent post-genome researches are now identifying many genes for various characters in- cluding morphological ones (e.g., Dorus et al., 2004). But the question remains: how and when those genes appeared and were fixed in our an- cestral populations? It is impossible to determine the causes and mechanisms of their appearance by exploring only the genes of the human body.
In order to attain this understanding, we must collect data on ancient environments in which morphological characters (namely, their genes) were brought into existence. At present, however,
we do not have sufficient paleoecological data.
We have, therefore, used data on environments inhabited by modern humans instead to search for the causes for the appearance of morphologi- cal characters, though indirectly.
As a result, some characters such as the cephalic index (Beals, 1972; Mizoguchi, 1985;
Kouchi, 1986), nasal index (Yamaguchi, 1970;
Carey and Steegmann, 1981; Mizoguchi, 1985), tooth crown size (Mizoguchi, 1993b), incisor shoveling (Mizoguchi, 1985) and Carabelli trait (Mizoguchi, 1993a) have demonstrated an asso- ciation with environmental variables such as cli- matic factors, foodstuff intakes and/or ways of life. Although a few anthropologists like Scott
Pilot Research Seeking Causative Factors for Morphological Characters:
Ecological Correlations Between Morphological Characters, Genes of Biochemical/Physiological Characters, and Environmental Factors
in Modern Humans
Yuji Mizoguchi
Department of Anthropology, National Science Museum 3–23–1 Hyakunincho, Shinjuku-ku, Tokyo, 169–0073 Japan
E-mail: [email protected]
Abstract As a step toward elucidating the causative factors of morphological characters, ecologi- cal correlations were estimated between specific morphological characters, the gene frequencies for biochemical/physiological characters, and environmental factors. Principal component analyses of the ecological correlations or the rotation of their results showed that the cephalic index had sig- nificant inverse associations with phosphoglucomutase 1, average annual temperature, and the amount of annual rainfall; that the nasal index had an inverse association with glyoxalase I and, si- multaneously, positive associations with average annual temperature and the amount of annual rainfall; that the mesiodistal crown diameter of the maxillary first molar had significant associa- tions with haptoglobin-alpha and average temperature in the coldest month; and that the buccolin- gual crown diameter of the maxillary second molar had an inverse association with alleles MS of the MNS system and, simultaneously, positive associations with average annual temperature and the amount of annual rainfall. These findings suggest that a morphological character comprises a character complex together with some biochemical/physiological characters which support the emergence or existence of the morphological character in a certain environment, or, merely, that an ecological association between a morphological character and a biochemical/physiological charac- ter is due to two independent adaptations to the same environmental factor or due to gene flow.
Key words : Morphological character, Protein, Gene, Principal component analysis, Bootstrap
method
and Turner (1997) regard the geographical varia- tions in frequencies of morphological dental characters as generated mainly through the processes of random genetic drift, many morpho- logical characters have, in general, been accepted to have formed through adaptations to the envi- ronment.
On the other hand, it is widely known that some genes for biochemical characters, such as the ABO blood-group system, the Rhesus sys- tem, hemoglobin S, beta-thalassemia, glucose-6- phosphate dehydrogenase, alpha-2HS-glycopro- tein, etc., show geographical clines in their fre- quencies or have ecological correlations with lat- itude and/or climatic factors (Piazza et al., 1981;
O’Rourke et al., 1985; Cavalli-Sforza and Caval- li-Sforza, 1995; Lewontin, 1995; Spitsyn et al., 1998; Ciminelli et al., 2000). Some of these clines or correlations have been interpreted as the result of gene flow or migration, and the causes of others have been explained by adaptations to various environments through selection.
Further, there is a study by Relethford (2004) which comprehensively examined the contribu- tion of isolation by geographic distance to the present global variation patterns in three kinds of characters, i.e., red blood cell polymorphisms, microsatellite DNA markers, and craniofacial measurements. In his paper, Relethford maintains that, since a common pattern of global gene flow mediated by geographic distance is detectable in diverse genetic and morphological data sets, the correspondence between genetic similarity and geographic distance may reflect the history of dispersal of the human species out of Africa.
In this preliminary study, the present author at- tempts to examine how a morphological charac- ter is associated with natural or cultural environ- mental factors along with biochemical/physiolog- ical characters by analyzing all these data types simultaneously. In other words, this study exam- ines the possibility that some biochemical/physi- ological characters support the existence of a morphological character in a certain environ- ment.
Over ten years ago, the present author (Mi-
zoguchi, 1994) conducted a similar study. At that time, he examined ecological correlations (Yasu- da, 1969), i.e., among-group correlations be- tween ten morphological characters, ten alleles for biochemical/physiological characters, and ten environmental variables, and found that as many as eight of the ten alleles for biochemical/physio- logical characters showed significant ecological correlations with morphological characters, sug- gesting the existence of some character complex- es composed of both morphological and bio- chemical/physiological characters. In the present study, many more, i.e., 37 alleles for biochemi- cal/physiological characters are examined to in- vestigate the biochemical/physiological back- ground of morphological characters in more depth.
Materials and Methods
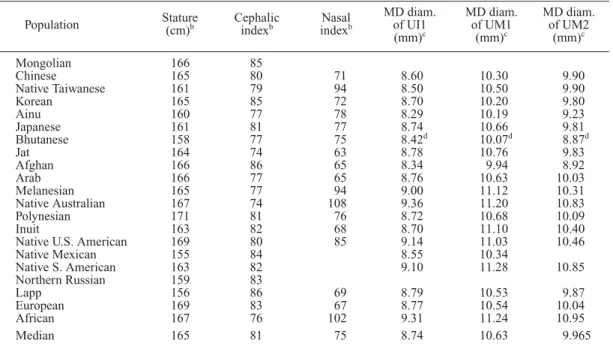
All the data used were collected from the liter- ature (Table 1). Morphological data are the mean values or frequencies of somatometric and dental characters compiled by Mizoguchi (1985, 1993a), and biochemical/physiological data are the frequencies of 37 alleles of various polymor- phic genes for enzymes, proteins, blood groups, etc. published by Roychoudhury and Nei (1988).
Environmental variables are climatic and cultural ones, the latter of which are the way of life vari- ables from the 15th century, and were compiled by Mizoguchi (1985). Using these data, 21 pooled samples were created for the present analysis.
The analysis has three steps. In the first step, those alleles for biochemical/physiological char- acters which were significantly correlated with a morphological character were screened using Kendall’s rank correlation coefficient, tau (Siegel, 1956).
In the second step, a set comprised of a mor- phological character and all the related biochemi- cal/physiological characters was examined by principal component analysis (Lawley and Maxwell, 1963; Okuno et al., 1971, 1976;
Takeuchi and Yanai, 1972; abbreviated as PCA
Table 1. Means or frequencies of morphological characters, environmental variables and polymorphic genes in modern human pozpulations worldwide.
aMD diam. MD diam. MD diam.
Population Stature Cephalic Nasal
of UI1 of UM1 of UM2 (cm)
bindex
bindex
b(mm)
c(mm)
c(mm)
cMongolian 166 85
Chinese 165 80 71 8.60 10.30 9.90
Native Taiwanese 161 79 94 8.50 10.50 9.90
Korean 165 85 72 8.70 10.20 9.80
Ainu 160 77 78 8.29 10.19 9.23
Japanese 161 81 77 8.74 10.66 9.81
Bhutanese 158 77 75 8.42
d10.07
d8.87
dJat 164 74 63 8.78 10.76 9.83
Afghan 166 86 65 8.34 9.94 8.92
Arab 166 77 65 8.76 10.63 10.03
Melanesian 165 77 94 9.00 11.12 10.31
Native Australian 167 74 108 9.36 11.20 10.83
Polynesian 171 81 76 8.72 10.68 10.09
Inuit 163 82 68 8.70 11.10 10.40
Native U.S. American 169 80 85 9.14 11.03 10.46
Native Mexican 155 84 8.55 10.34
Native S. American 163 82 9.10 11.28 10.85
Northern Russian 159 83
Lapp 156 86 69 8.79 10.53 9.87
European 169 83 67 8.77 10.54 10.04
African 167 76 102 9.31 11.24 10.95
Median 165 81 75 8.74 10.63 9.965
a
Each of the 21 groups listed here was created by pooling several samples which were supposedly derived from a certain population. Each listed value is the median among the frequencies or means for one or more samples from the population.
bMale data (Mizoguchi, 1985).
cMale data (Mizoguchi, 1993a).
dPrakash et al. (1979).
Table 1. (Continued—2)
Average Population
BL diam. BL diam.
Shoveling Carabelli
Latitude annual of UM1 of UM2
(%)
etrait
(°)
gtemp.
(mm)
c(mm)
c(%)
f(°C)
gMongolian 100 14 48 N 3.1
Chinese 11.50 11.70 92 9 31 N 13.6
Native Taiwanese 11.70 11.60 98 37 24 N 23.5
Korean 11.60 11.80 84 25 38 N 12.1
Ainu 11.30 11.10 83 9 43 N 7.1
Japanese 11.92 11.56 94 29 36 N 14.2
Bhutanese 11.16
d11.11
d28 N 23.3
Jat 11.21 10.69 87 36 30 N 25.3
Afghan 11.14 11.26 34 33 N 15.0
Arab 11.54 11.55 33 65 32 N 17.7
Melanesian 12.10 12.35 73 18 6 S 26.3
Native Australian 12.55 12.77 68 24 S 20.7
Polynesian 11.95 12.22 82 34 20 S 26.7
Inuit 11.80 11.80 100 63 69 N 4.0
Native U.S. American 98 17 36 N 15.5
Native Mexican 11.40 66 23 N 21.7
Native S. American 11.76 11.41 98 14 25 S 23.4
Northern Russian 26 68 N 0.2
Lapp 11.73 11.66 44 28 68 N 2.4
European 11.32 11.28 34 40 54 N 7.1
African 11.80 11.90 34 34 5 S 25.5
Median 11.65 11.60 84 29 32
h15.5
e
All affected expressivities of UI1 shoveling (Mizoguchi, 1985). Males and females are combined.
f
Strongest expressivities (grades 2 3) in the UM1 (Mizoguchi, 1993a). Males and females are combined.
g
Mizoguchi (1985). The climatic measurements for each group were approximately estimated based on data from several meteorological stations near the localities from which the samples were derived.
h
Median of the absolute values regardless of whether data were from the Northern or Southern Hemisphere.
Table 1. (Continued—3)
Av. temp. Av. Temp. Mean Amount in the in the relative of
Population hottest coldest annual annual Hunting- Cattle month month humidity rainfall gathering
ibreeding
i(°C)
g(°C)
g(%)
g(mm)
gMongolian 16.1 25.6 65 208 0 1
Chinese 28.0 2.8 60 677 0 1
Native Taiwanese 28.1 17.9 80 2281 0 1
Korean 25.1 1.0 69 1126 0 1
Ainu 20.0 5.5 78 1212 1 0
Japanese 25.7 2.6 72 1210 0 0
Bhutanese 28.1 15.2 77 1582 0 1
Jat 34.5 14.3 49 715 0 1
Afghan 26.8 1.8 50 258 0 1
Arab 26.6 8.0 51 254 0 1
Melanesian 26.8 24.8 82 2055 0 1
Native Australian 28.2 15.0 59 523 1 0
Polynesian 27.6 26.0 78 2224 0 1
Inuit 6.9 19.9 82 236 1 0
Native U.S. American 23.9 6.5 48 309 1 0
Native Mexican 27.2 14.2 66 726 0 0
Native S. American 25.8 17.0 76 1531 0 1
Northern Russian 14.1 11.7 80 464 0 1
Lapp 13.5 6.9 78 713 0 1
European 17.1 2.2 83 594 0 1
African 26.1 24.4 80 1625 1 1
Median 26.1 6.5 76 715
i
Ways of life in the 15th century (Ishige, 1973; Mizoguchi, 1985). 1 Adoption; 0 No adoption.
Table 1 (Continued—4)
Enzymes
jPopulation Milking
iAgri-
culture
iACP1*a ACP1*b ADA*1 AK1*1
Mongolian 1 0 .227 .773 .953 .984
Chinese 0 1 .214 .786 .939 1.000
Native Taiwanese 0 1 .935 1.000
Korean 0 1 .220 .780 .947 .967
Ainu 0 0 .274 .726 .972 1.000
Japanese 0 1 .210 .790 .969 1.000
Bhutanese 1 1 .171 .829 1.000
Jat 1 1
Afghan 1 1 .297 .683 .866 .920
Arab 1 1 .181 .810 .862 .975
Melanesian 0 1 .205 .795 .847 1.000
Native Australian 0 0 .010 .990 .995 1.000
Polynesian 0 1 .214 .786 .890 1.000
Inuit 0 0 .601 .399 1.000 .992
Native U.S. American 0 0
Native Mexican 0 1 .175 .825
Native S. American 0 1 .061 .939 1.000 1.000
Northern Russian 0 0 .190 .794 .998
Lapp 0 0 .488 .493 .863 .993
European 1 1 .356 .588 .944 .964
African 1 1 .133 .849 .996 .994
Median .212 .788 .9455 .999
j
Roychoudhury and Nei (1988). ACP1*a allele a of acid phosphatase 1; ACP1*b allele b of acid phosphatase 1;
ADA*1allele 1 of adenosine deaminase; AK1*1allele 1 of soluble adenylate kinase 1;
Table 1. (Continued—5)
Enzymes
jPopulation
ESD*1 GPT1*1,
CHE1*u CHE2* [=FGH*1] G6PD*B AAT1*1 GLO1*1
Mongolian .699 .614 .227
Chinese .998 .637 .976 .500 .200
Native Taiwanese .683 .193
Korean 1.000 .989 .676 .986 .602 .116
Ainu 1.000 .971 .681 1.000 .455
Japanese .997 .957 .600 .999 .623 .088
Bhutanese .946 1.000
Jat .529
Afghan 1.000 .897 .975 .455
Arab .991 .873
Melanesian .997 .934 .989 .733 .043
Native Australian 1.000 1.000 .968 1.000 .809 .000
Polynesian 1.000 .611 .982 .547 .233
Inuit 1.000 .944 .822 1.000 .609 .360
Native U.S. American 1.000 Native Mexican .989
Native S. American .984 .971 .687 1.000 .388 .213 Northern Russian
Lapp .984 .946 .907 .611 .304
European .984 .950 .908 1.000 .536 .439
African .937 .972 .755 .873 .259
Median .9975 .971 .699 .994 .602 .213
CHE1*u allele u of cholinesterase [serum] 1, pseudocholinesterase 1; CHE2* allele – of cholinesterase 2, pseudocholinesterase 2; ESD*1 [ FGH*1] allele 1 of esterase D [ S-formylglutathione hydrolase]; G6PD*B al- lele B of glucose-6-phosphate dehydrogenase; GPT1*1, AAT1*1 allele 1 of glutamic-pyruvate transaminase, alanine aminotransferase; GLO1*1alelle 1 of glyoxalase I;
Table 1. (Continued—6)
Enzymes
jProteins
kPopulation
GC, BF, PGM1*1 PGD*A
DBP*1 HPA*1 HBB*A
GBG*S
Mongolian .872 .765 .270
Chinese .732 .933 .756 .275 .997 .885
Native Taiwanese .934 .828 .256 .885
Korean .775 .893 .696 .279 .723
Ainu .870 .928 .777 .113
Japanese .766 .910 .756 .266 1.000 .824
Bhutanese .770 .770 .130 .981
Jat
Afghan .733 .954 .769 .271 .696
Arab .742 .926 .345 .989 .517
Melanesian .934 .864 .576 .684 1.000 .894
Native Australian .909 .950 .900 .207 1.000
Polynesian .669 .877 .753 .552 1.000 .711
Inuit .787 .998 .689 .332 1.000 .989
Native U.S. American .819 .455 .973
Native Mexican .784 1.000 .819 .548
Native S. American .829 1.000 .821 .580 1.000 .915
Northern Russian .655 .957 .390
Lapp .550 .919 .823 .314 1.000 .888
European .782 .980 .725 .381 1.000 .791
African .849 .929 .766 .574 .9994
Median .7785 .9285 .766 .323 1.000 .885
PGM1*1 allele 1 of phosphoglucomutase 1; PGD*A allele A of phosphogluconate dehydrogenase.
k
Roychoudhury and Nei (1988). GC,DBP*1 allele 1 of group-specific component, vitamin D binding protein;
HPA*1allele 1 of haptoglobin, alpha; HBB*Aallele A of hemoglobin, beta; BF,GBG*Sallele S of properdin factor
B, glycine-rich beta-glycoprotein;
Table 1. (Continued—7)
Proteins
kBlood groups
lPopulation
BF,
GBG*F TF*C Se B O Di*b
Mongolian .983 .231 .567
Chinese .114 .945 .479 .171 .636 .957
Native Taiwanese .115 .124 .692 1.000
Korean .273 .988 .491 .213 .558 .953
Ainu .990 .339 .199 .558 .976
Japanese .176 .989 .510 .177 .548 .951
Bhutanese .990 .190 .565 .976
Jat
Afghan .268 .994 .186 .582
Arab .321 .999 .127 .700 .985
Melanesian .106 .973 .691 .100 .674 1.000
Native Australian .885 .988 .000 .75 1.000
Polynesian .283 1.000 .437 .130 .610 1.000
Inuit .010 1.000 .942 .079 .648 .979
Native U.S. American .015 .982 .779 .007 .708 .974
Native Mexican .976 .004 .946 .944
Native S. American .063 1.000 .907 .000 1.000 .824
Northern Russian .230 .630
Lapp .112 .994 .736 .069 .499 1.000
European .196 .993 .530 .080 .646 1.000
African .976 .493 .091 .714 1.000
Median .115 .9895 .530 .1255 .641 .979
BF, GBG*Fallele F of properdin factor B, glycine-rich beta-glycoprotein; TF*Callele C of transferrin.
l
Roychoudhury and Nei (1988). Se allele Se of ABH secretion; B allele B of ABO system; O allele O of ABO system; Di*ballele Di*b of Diego system;
Table 1. (Continued—8)
Blood groups
lPopulation
k Jk*a Le Lu*b MS Ms
Mongolian .996 .409 .055 .496
Chinese .999 .349 .492 .996 .159 .531
Native Taiwanese 1.000 .414 .000 .500
Korean .999 .466 1.000 1.000 .029 .493
Ainu 1.000 .684 1.000 .020 .393
Japanese 1.000 .472 .812 1.000 .064 .466
Bhutanese 1.000 1.000 .141 .545
Jat .520 1.000
Afghan .982 .558 .975 .266 .370
Arab .967 .994 .294 .374
Melanesian 1.000 .398 .133 1.000 .007 .097
Native Australian 1.000 .566 1.000 .000 .263
Polynesian 1.000 1.000 .013 .662
Inuit 1.000 .736 1.000 1.000 .183 .659
Native U.S. American 1.000 .400 1.000 .331 .463
Native Mexican 1.000 1.000 .376 .406
Native S. American 1.000 .407 .440 .999 .20 .541
Northern Russian 1.000 .081 .424
Lapp .994 .577 .684 .978 .253 .203
European .963 .511 .780 .962 .241 .329
African .997 .859 .308 .975 .118 .353
Median 1.000 .4915 .566 1.000 .1295 .4435
k allele k of Kell system; Jk*a allele Jk*a of Kidd system; Le allele Le of Lewis system; Lu*b allele Lu*b of
Lutheran system; MS alleles MS of MNS system; Ms alleles Ms of MNS system;
Table 1. (Continued—9)
Blood groups
lPopulation
Ns P*1 cde CDe cDE
Mongolian .438 .193
Chinese .440 .186 .036 .646 .230
Native Taiwanese .437 .000 .882 .098
Korean .472 .175 .026 .641 .214
Ainu .355 .098 .024 .539 .268
Japanese .444 .198 .033 .646 .262
Bhutanese .280 .236 .039 .666 .289
Jat .442
Afghan .275 .462 .283 .501 .160
Arab .263 .515 .319 .405 .133
Melanesian .770 .196 .000 .874 .077
Native Australian .737 .148 .000 .65 .21
Polynesian .325 .270 .000 .574 .327
Inuit .158 .191 .000 .488 .468
Native U.S. American .131 .457 .044 .596 .337
Native Mexican .147 .367 .000 .602 .323
Native S. American .130 .514 .000 .527 .367
Northern Russian .487 .233 .068 .470 .462
Lapp .363 .346 .195 .596 .179
European .365 .531 .387 .418 .153
African .372 .717 .168 .041 .043
Median .364 .253 .033 .596 .230
Nsalleles Ns of MNS system; P*1allele P*1 of P system; cdealleles cde of Rhesus system; CDealleles CDe of Rhesus system; cDE alleles cDE of Rhesus system;
Table 1. (Continued—10)
Miscellaneous
mPopulation Color- Cerumen Lactase
blindness activity PTC
(W) (CB) (LAA) (T)
Mongolian .062 7.2 12.1 .672
Chinese .081 5.8 3.9 .774
Native Taiwanese .465
Korean .076 5.1 .634
Ainu .295 0.5 .754
Japanese .085 4.4 15.2 .647
Bhutanese Jat
Afghan .608 17.4
Arab 71.7 .396
Melanesian .473 4.6 15.4 .636
Native Australian .821 1.9 33.1 .298
Polynesian 7.5 .597
Inuit 2.5 12.0 .381
Native U.S. American .227 1.1 .794
Native Mexican .243 3.6 .654
Native S. American 2.3 .839
Northern Russian
Lapp 58.4 .468
European .642 8.2 90.0 .434
African 3.9 21.7 .847
Median .269 4.15 17.4 .6415
m
Roychoudhury and Nei (1988). Cerumen (W) allele W for the wet type of ear wax; Colorblindness (CB) per-
centage of colorblind males; Lactase activity (LAA)percentage of lactose absorbers; PTC (T)allele T for a taster of
phenylthiocarbamide.
below) to ascertain the interrelationships among these variables in more detail. In this case, corre- lations between characters were evaluated by Pearson’s product-moment correlation coeffi- cient. The number of principal components (PCs) used was determined so that the cumulative pro- portion of the variances of the principal compo- nents exceeded 80%. The principal components obtained in such a way were then transformed by Kaiser’s normal varimax rotation method (Asano, 1971; Okuno et al., 1971) into different factors to reveal any other associations hidden behind the variables. Although it is not necessarily expected for the among-group distribution of a mean value or gene frequency to be normal, the statistical significance of a factor loading can be tested using the bootstrap method (Efron, 1979a, b, 1982; Diaconis and Efron, 1983; Mizoguchi, 1993b) because this method does not depend on the form of the distribution. For estimating the bootstrap standard deviation for factor loading, 1,000 bootstrap replications including the ob- served sample were used. The bootstrap standard deviation was estimated by directly counting the cumulative frequency of the standard deviation in the bootstrap distribution.
In the above PCA of the second-step analysis, the number of biochemical/physiological charac- ters to be analyzed was determined according to the level of statistical significance for Kendall’s tau in the first-step analysis so that the sample size was appropriate for the PCA under the sta- tistical restriction on sample size given the num- ber of variables. Further, if two or more alleles at the same locus or two or more genotypes for the same biochemical/physiological characters were correlated with a morphological character, only one of them was used for this PCA.
In the final step, a character complex com- posed of a morphological character and the strongly related biochemical/physiological char- acters was also examined by PCA and Kaiser’s normal varimax rotation method to determine whether it was associated with any natural or cul- tural environmental factors. In this PCA, only those biochemical/physiological characters which
were found to be significantly or most highly as- sociated with a relevant morphological character in the second-step analysis were analyzed. In ad- dition to these, however, the following two physi- ological characters were also analyzed because their adaptive significance is well known: color- blindness, which is considered to be associated with agriculture (Hoshi, 1977), and lactase activ- ity, which still remains high in adults in Europe and a few other places where there is a history of rearing cattle (Jones, 1992). In order to evaluate correlations with 0–1 variables, the four-fold point correlation coefficient, which corresponds to the product-moment correlation coefficient formally calculated based on 0–1 data (Yasuda, 1969), was used.
The above statistical calculations were execut- ed with the mainframe, HITACHI MP5800 Sys- tem, at the Computer Centre, University of Tokyo. The programs used were RKCNCT for calculating rank correlation coefficients, and BTPCA for principal component analysis and Kaiser’s normal varimax rotation. These pro- grams were written in FORTRAN by the present author.
Results
Screening by rank correlation coefficient
First of all, biochemical/physiological charac- ters having strong correlations with morphologi- cal characters were roughly analyzed using Kendall’s rank correlation coefficient. As a result, 31 (83.8%) of 37 alleles for biochemical/physio- logical characters were found to have significant correlations with a subset of the ten morphologi- cal characters at the 5% level (Table 2).
Character complexes composed of morphologi- cal and biochemical/physiological characters
In the second step, principal component analy-
sis was applied to each ecological correlation
matrix on a set comprised of a morphological
character and those biochemical/physiological
characters which were found to be significantly
correlated with the relevant morphological char-
Table 2. Ecological correlations of morphological characters with polymorphic genes for enzymes, proteins, blood groups, etc.
aMorphological character–Allele for a biochemical/physiological character No. of Kendall’s pairs tau Stature – Cholinesterase 2, pseudocholinesterase 2 (CHE2* ) 11 0.50*
– Glucose-6-phosphate dehydrogenase (G6PD*B ) 14 0.45*
– Kell system (k) 20 0.33*
Cephalic index –Acid phosphatase 1 (ACP1*a) 18 0.46**
–Acid phosphatase 1 (ACP1*b) 18 0.48**
– Soluble adenylate kinase 1 (AK1*1) 18 0.44*
– Phosphoglucomutase 1 (PGM1*1) 18 0.42*
– ABO system (O) 20 0.35*
– Lewis system (Le) 13 0.45*
– Colorblindness (CB) 14 0.40*
Nasal index – Acid phosphatase 1 (ACP1*a) 14 0.49*
– Acid phosphatase 1 (ACP1*b) 14 0.49*
– Soluble adenylate kinase 1 (AK1*1) 15 0.60**
– Cholinesterase 2, pseudocholinesterase 2 (CHE2* ) 10 0.57*
– Glutamic-pyruvate transaminase, alanine aminotransferase
(GPT1*1,AAT1*1) 13 0.50*
– Glyoxalase I (GLO1*1) 11 0.64**
– Phosphoglucomutase 1 (PGM1*1) 15 0.44*
– Transferrin (TF*C) 15 0.52**
– Kell system (k) 16 0.52**
– Lewis system (Le) 12 0.53*
– MNS system (MS) 16 0.60**
– Rhesus system (cde) 16 0.42*
– Rhesus system (CDe) 16 0.39*
MD of UI1 – Glutamic-pyruvate transaminase, alanine aminotransferase
(GPT1*1,AAT1*1) 14 0.47*
– Haptoglobin, alpha (HPA*1) 18 0.44*
– ABH secretion (Se) 13 0.54**
– ABO system (B) 18 0.51**
– ABO system (O) 18 0.34*
MD of UM1 – Glutamic-pyruvate transaminase, alanine aminotransferase
(GPT1*1,AAT1*1) 14 0.42*
– Haptoglobin, alpha (HPA*1) 18 0.46**
– Properdin factor B, glycine-rich beta-glycoprotein (BF,GBG*S) 13 0.43*
– ABH secretion (Se) 13 0.46*
– ABO system (B) 18 0.47**
– ABO system (O) 18 0.45**
MD of UM2 – Haptoglobin, alpha (HPA*1) 17 0.53**
– Properdin factor B, glycine-rich beta-glycoprotein (BF, GBG*S) 13 0.45*
– ABH secretion (Se) 13 0.46*
– ABO system (B) 17 0.66***
– ABO system (O) 17 0.61***
– Lewis system (Le) 13 0.42*
BL of UM1 – Glutamic-pyruvate transaminase, alanine aminotransferase
(GPT1*1, AAT1*1) 14 0.58**
– Hemoglobin, beta (HBB*A) 12 0.48*
– MNS system (MS) 17 0.44*
– Rhesus system (cde) 17 0.41*
BL of UM2 – Glutamic-pyruvate transaminase, alanine aminotransferase
(GPT1*1, AAT1*1) 14 0.49*
– MNS system (MS) 16 0.40*
– MNS system (Ns) 16 0.37*
Shoveling – Properdin factor B, glycine–rich beta–glycoprotein (BF,GBG*S) 12 0.58**
– Properdin factor B, glycine-rich beta-glycoprotein (BF, GBG*F) 12 0.56*
– Diego system (Di*b) 15 0.46*
acter in the first-step examination. The direct results of the PCAs and their rotated solutions for stature, cephalic index, nasal index, the mesiodis- tal (MD) crown diameter of the maxillary central incisor (UI1), the MD diameters of the maxillary first molar (UM1) and the maxillary second molar (UM2), the buccolingual (BL) diameters of UM1 and UM2, shoveling of UI1, and Cara- belli trait of UM1 are shown in Tables 3 to 18.
Among these, significant associations can be found in Tables 6, 8, 9, 11, 12 and 16. They are as follows: an inverse association between the cephalic index and allele 1 of phosphoglucomu- tase 1 (Table 6); an inverse association between the nasal index and allele C of transferrin (Table 8); an inverse association between the MD diam- eter of UI1 and allele B of the ABO system (Table 9); positive associations between the MD diameters of UM1 and UM2 and allele 1 of hap- toglobin-alpha, allele S of properdin factor B glycine-rich beta-glycoprotein, and allele Se of the ABH secretion, as well as an inverse associa- tion with allele B of the ABO system (Tables 11 and 12); and a positive association between shov- eling and alleles cDE of the Rhesus system (Table 16).
Associations with natural or cultural environ- mental factors
For the final step, natural or cultural environ- mental factors that may have influenced a charac- ter complex composed of morphological and bio-
chemical/physiological characters was probed.
The direct results of the PCAs and their rotated solutions for such character complexes and cli- matic variables are shown in Tables 19 to 54, and those for the character complexes and the ways of life are shown in Tables 55 to 90.
The significant associations that were detected are as follows.
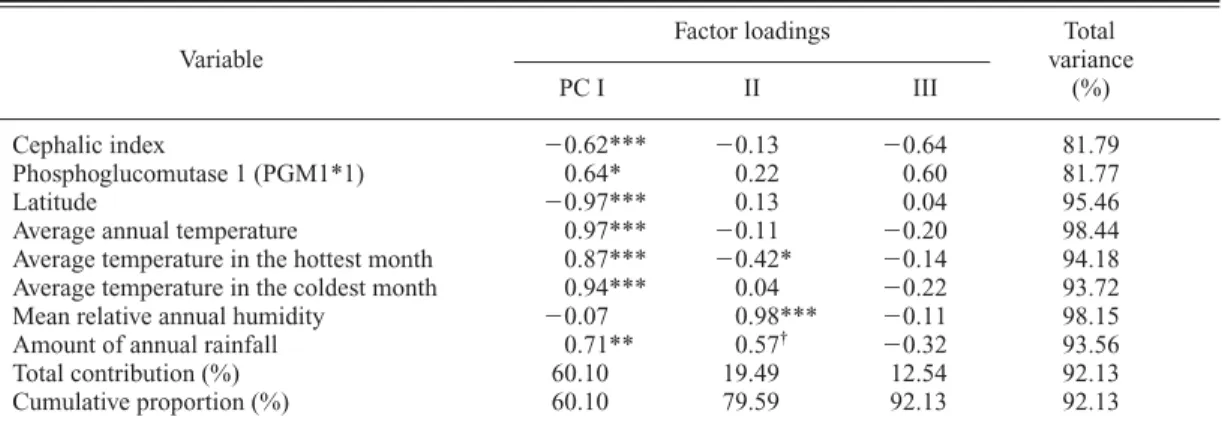
First, the cephalic index and phosphoglucomu- tase 1 constitute a character complex, and this complex is significantly associated with annual temperature and rainfall (Table 21). More exactly speaking, the first principal component (PC I) which is significantly correlated with the cephal- ic index is inversely correlated with allele 1 of phosphoglucomutase 1, average annual tempera- ture, average temperature in the hottest month, average temperature in the coldest month, and the amount of annual rainfall. As for associations with cultural factors, however, no evidence sup- ported that this character complex is significantly associated with any of the ways of life (Tables 57 and 58).
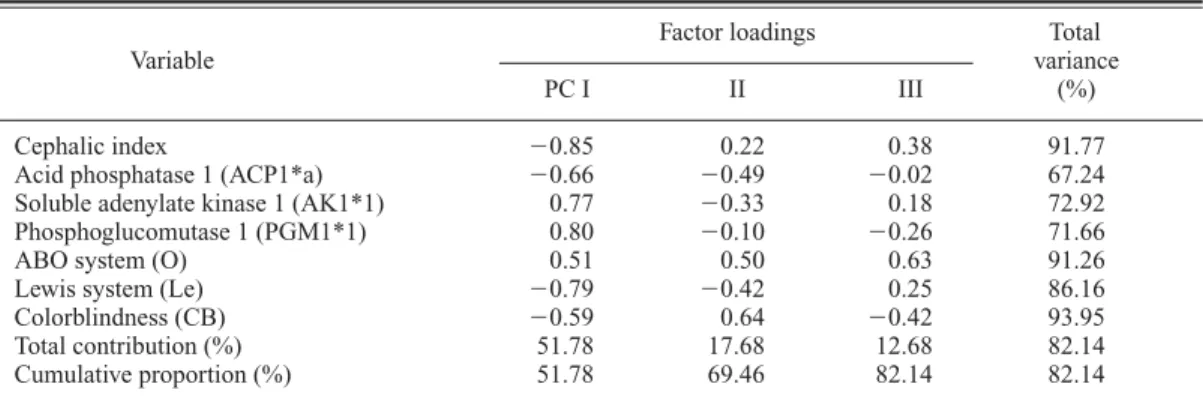
Colorblindness was significantly correlated with the cephalic index in the first-step analysis (Table 2). But, through the second (Tables 5 and 6) and final (Tables 23, 24, 59 and 60) steps, no significant tendency was found to support the as- sociation of these two characters as a character complex.
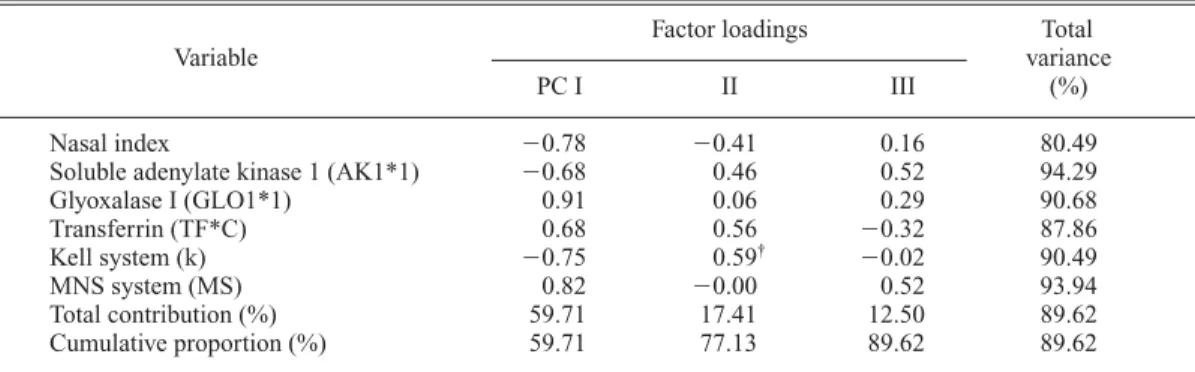
The nasal index, along with average annual temperature, average temperature in the hottest
Table 2. (Continued)
Morphological character–Allele for a biochemical/physiological character No. of Kendall’s pairs tau
– Kell system (k) 16 0.40*
– Lutheran system (Lu*b) 15 0.44*
– MNS system (Ms) 16 0.46*
– Rhesus system (cde) 15 0.38*
– Rhesus system (cDE) 15 0.59**
– Lactase activity (LAA) 10 0.70**
Carabelli trait – Kidd system (Jk*a) 12 0.62**
– P system (P*1) 18 0.38*
– PTC (T) 15 0.45*
a
Only significant rank correlation coefficients are listed.
* p0.05; ** p0.01; *** p0.001, by a two-tailed test.
Table 3. Principal component analysis of the ecological correlations on stature and allele frequencies for bio- chemical characters.
aFactor loadings Total Variable variance
PC I II (%)
Stature 0.76 0.60 93.25
Cholinesterase 2, pseudocholinesterase 2 (CHE2* ) 0.89 0.24 85.76 Glucose-6-phosphate dehydrogenase (G6PD*B ) 0.89 0.11 79.70
Kell system (k) 0.14 0.97 96.18
Total contribution (%) 54.58 34.14 88.72
Cumulative proportion (%) 54.58 88.72 88.72
a
The number of populations used is 10. The number of the principal components shown here was so determined that the cumulative proportion of the variances of principal components exceeded 80%.
†
p 0.10; * p 0.05; ** p 0.01; *** p 0.001, by a two-tailed bootstrap test.
Table 4. Solution obtained through the normal varimax rotation of the first two principal components (Table 3) from the ecological correlations on stature and allele frequencies for biochemical characters.
aFactor loadings Variable
Fac I II
Stature 0.72 0.65
Cholinesterase 2, pseudocholinesterase 2 (CHE2* ) 0.91 0.18 Glucose-6-phosphate dehydrogenase (G6PD*B ) 0.89 0.05
Kell system (k) 0.21 0.96
a
The cumulative proportion of the two principal components is 88.72%.
†
p 0.10; * p 0.05; ** p 0.01; *** p 0.001, by a two-tailed bootstrap test.
Table 5. Principal component analysis of the ecological correlations on cephalic index and allele frequencies for biochemical characters.
aFactor loadings Total Variable variance
PC I II III (%)
Cephalic index 0.85 0.22 0.38 91.77
Acid phosphatase 1 (ACP1*a) 0.66 0.49 0.02 67.24 Soluble adenylate kinase 1 (AK1*1) 0.77 0.33 0.18 72.92 Phosphoglucomutase 1 (PGM1*1) 0.80 0.10 0.26 71.66
ABO system (O) 0.51 0.50 0.63 91.26
Lewis system (Le) 0.79 0.42 0.25 86.16
Colorblindness (CB) 0.59 0.64 0.42 93.95
Total contribution (%) 51.78 17.68 12.68 82.14 Cumulative proportion (%) 51.78 69.46 82.14 82.14
a
The number of populations used is 10. The number of the principal components shown here was so determined that the cumulative proportion of the variances of principal components exceeded 80%.
†
p0.10; * p0.05; ** p0.01; *** p0.001, by a two-tailed bootstrap test.
Table 6. Solution obtained through the normal varimax rotation of the first three principal components (Table 5) from the ecological correlations on cephalic index and allele frequencies for biochemical characters.
aFactor loadings Variable
Fac I II III
Cephalic index 0.42 0.04 0.86*
Acid phosphatase 1 (ACP1*a) 0.01 0.61 0.55
Soluble adenylate kinase 1 (AK1*1) 0.71 0.20 0.42 Phosphoglucomutase 1 (PGM1*1) 0.36 0.10 0.76*
ABO system (O) 0.20 0.93 0.04
Lewis system (Le) 0.01 0.45 0.81
†Colorblindness (CB) 0.96* 0.07 0.10
a
The cumulative proportion of the three principal components is 82.14%.
†
p 0.10; * p 0.05; **p 0.01; *** p 0.001, by a two-tailed bootstrap test.
Table 7. Principal component analysis of the ecological correlations on nasal index and allele frequencies for biochemical characters.
aFactor loadings Total
Variable variance
PC I II III (%)
Nasal index 0.78 0.41 0.16 80.49
Soluble adenylate kinase 1 (AK1*1) 0.68 0.46 0.52 94.29
Glyoxalase I (GLO1*1) 0.91 0.06 0.29 90.68
Transferrin (TF*C) 0.68 0.56 0.32 87.86
Kell system (k) 0.75 0.59
†0.02 90.49
MNS system (MS) 0.82 0.00 0.52 93.94
Total contribution (%) 59.71 17.41 12.50 89.62 Cumulative proportion (%) 59.71 77.13 89.62 89.62
a
The number of populations used is 10. The number of the principal components shown here was so determined that the cumulative proportion of the variances of principal components exceeded 80%.
†
p 0.10; * p 0.05; ** p 0.01; *** p 0.001, by a two-tailed bootstrap test.
Table 8. Solution obtained through the normal varimax rotation of the first three principal components (Table 7) from the ecological correlations on nasal index and allele frequencies for biochemical characters.
aFactor loadings Variable
Fac I II III
Nasal index 0.80* 0.19 0.36
Soluble adenylate kinase 1 (AK1*1) 0.28 0.93
†0.08
Glyoxalase I (GLO1*1) 0.43 0.28 0.80
†Transferrin (TF*C) 0.92*** 0.11 0.16
Kell system (k) 0.00 0.78 0.54
MNS system (MS) 0.24 0.16 0.93
†a
The cumulative proportion of the three principal components is 89.62%.
†
p 0.10; * p 0.05; **p 0.01; *** p 0.001, by a two-tailed bootstrap test.
Table 11. Principal component analysis of the ecological correlations on the MD diameters of UM1 and UM2 and allele frequencies for biochemical characters.
aFactor loadings Total
Variable variance
PC I II III (%)
MD of UM1 0.94*** 0.06 0.18 91.53
MD of UM2 0.94*** 0.12 0.16 92.87
Glutamic-pyruvate transaminase,
alanine aminotransferase (GPT1*1,AAT1*1) 0.24 0.61 0.74
†97.49 Haptoglobin, alpha (HPA*1) 0.77* 0.57 0.18 94.72 Properdin factor B,
glycine-rich beta-glycoprotein (BF,GBG*S) 0.76*** 0.18 0.39 76.37
ABH secretion (Se) 0.87*** 0.33 0.31 95.89
ABO system (B) 0.88** 0.21 0.12 82.56
Lewis system (Le) 0.52 0.71 0.33 87.78
Total contribution (%) 59.83 17.46 12.60 89.90 Cumulative proportion (%) 59.83 77.30 89.90 89.90
a
The number of populations used is 8. The number of the principal components shown here was so determined that the cumulative proportion of the variances of principal components exceeded 80%.
†
p 0.10;* p 0.05; ** p 0.01; *** p 0.001, by a two-tailed bootstrap test.
Table 9. Principal component analysis of the ecological correlations on the MD diameter of UI1 and allele fre- quencies for biochemical characters.
aFactor loadings Total
Variable variance
PC I II III (%)
MD of UI1 0.93*** 0.22 0.08 92.52
Glutamic-pyruvate transaminase,
alanine aminotransferase (GPT1*1,AAT1*1) 0.57 0.64 0.49 97.52 Haptoglobin, alpha (HPA*1) 0.53 0.37 0.75
†98.22
ABH secretion (Se) 0.77 0.55 0.15 92.31
ABO system (B) 0.89** 0.38 0.08 93.80
Total contribution (%) 56.97 21.07 16.84 94.88 Cumulative proportion (%) 56.97 78.03 94.88 94.88
a
The number of populations used is 12. The number of the principal components shown here was so determined that the cumulative proportion of the variances of principal components exceeded 80%.
†
p0.10; * p0.05; ** p0.01; *** p0.001, by a two-tailed bootstrap test.
Table 10. Solution obtained through the normal varimax rotation of the first three principal components (Table 9) from the ecological correlations on the MD diameter of UI1 and allele frequencies for biochemical characters.
aFactor loadings Variable
Fac I II III
MD of UI1 0.58 0.66
†0.39
Glutamic-pyruvate transaminase,
alanine aminotransferase (GPT1*1,AAT1*1) 0.07 0.98* 0.05
Haptoglobin, alpha (HPA*1) 0.11 0.11 0.98
†ABH secretion (Se) 0.96
†0.10 0.03
ABO system (B) 0.92* 0.14 0.27
a
The cumulative proportion of the three principal components is 94.88%.
†
p 0.10; * p 0.05; ** p 0.01; *** p 0.001, by a two-tailed bootstrap test.
Table 13. Principal component analysis of the ecological correlations on the BL diameters of UM1 and UM2 and allele frequencies for biochemical characters.
aFactor loadings Total
Variable variance
PC I II III (%)
BL of UM1 0.96 0.07 0.15 94.13
BL of UM2 0.94 0.02 0.16 90.62
Glutamic-pyruvate transaminase,
alanine aminotransferase (GPT1*1,AAT1*1) 0.65 0.47 0.54 93.60 Hemoglobin, beta (HBB*A) 0.26 0.73 0.63 99.50
MNS system (MS) 0.90 0.15 0.02 83.52
Rhesus system (cde) 0.64 0.64 0.35 93.34
Total contribution (%) 58.37 19.77 14.31 92.45 Cumulative proportion (%) 58.37 78.14 92.45 92.45
a
The number of populations used is 10. The number of the principal components shown here was so determined that the cumulative proportion of the variances of principal components exceeded 80%.
†
p0.10; * p0.05; **p0.01; *** p0.001, by a two-tailed bootstrap test.
Table 14. Solution obtained through the normal varimax rotation of the first three principal components (Table 13) from the ecological correlations on the BL diameters of UM1 and UM2 and allele frequencies for bio- chemical characters.
aFactor loadings Variable
Fac I II III
BL of UM1 0.74 0.34 0.54
BL of UM2 0.65 0.06 0.69
Glutamic-pyruvate transaminase,
alanine aminotransferase (GPT1*1,AAT1*1) 0.03 0.09 0.96*
Hemoglobin, beta (HBB*A) 0.01 0.99
†0.08
MNS system (MS) 0.75 0.06 0.52
Rhesus system (cde) 0.96 0.09 0.10
a
The cumulative proportion of the three principal components is 92.45%.
†
p0.10; * p0.05; ** p0.01; *** p0.001, by a two-tailed bootstrap test.
Table 12. Solution obtained through the normal varimax rotation of the first three principal components (Table 11) from the ecological correlations on the MD diameters of UM1 and UM2 and allele frequencies for bio- chemical characters.
aFactor loadings Variable
Fac I II III
MD of UM1 0.85* 0.44 0.01
MD of UM2 0.76* 0.44 0.39
Glutamic-pyruvate transaminase,
alanine aminotransferase (GPT1*1,AAT1*1) 0.08 0.06 0.98*
Haptoglobin, alpha (HPA*1) 0.39 0.89 0.01
Properdin factor B,
glycine-rich beta-glycoprotein (BF,GBG*S) 0.87 0.08 0.06
ABH secretion (Se) 0.97* 0.05 0.10
ABO system (B) 0.76
†0.32 0.39
Lewis system (Le) 0.07 0.93 0.02
a
The cumulative proportion of the three principal components is 89.90%.
†
p 0.10; * p 0.05; **p 0.01; *** p 0.001, by a two-tailed bootstrap test.
Table 15. Principal component analysis of the ecological correlations on shoveling of UI1 and allele frequencies for biochemical characters.
aFactor loadings Total Variable variance
PC I II (%)
Shoveling 0.96 0.14 95.04
Properdin factor B,
glycine-rich beta-glycoprotein (BF,GBG*S) 0.80 0.01 64.28
Rhesus system (cDE) 0.74 0.65 97.09
Lactase activity (LAA) 0.90 0.39** 95.79
Total contribution (%) 73.25 14.80 88.05
Cumulative proportion (%) 73.25 88.05 88.05
a
The number of populations used is 7. The number of the principal components shown here was so determined that the cumulative proportion of the variances of principal components exceeded 80%.
†
p0.10; * p0.05; ** p0.01; *** p0.001, by a two-tailed bootstrap test.
Table 16. Solution obtained through the normal varimax rotation of the first two principal components (Table 15) from the ecological correlations on shoveling of UI1 and allele frequencies for biochemical characters.
aFactor loadings Variable
Fac I II
Shoveling 0.88 0.41**
Properdin factor B,
glycine-rich beta-glycoprotein (BF,GBG*S) 0.66 0.45
Rhesus system (cDE) 0.27 0.95*
Lactase activity (LAA) 0.96 0.16
a
The cumulative proportion of the two principal components is 88.05%.
†
p0.10; * p0.05; ** p0.01; *** p0.001, by a two-tailed bootstrap test.
Table 17. Principal component analysis of the ecological correlations on the Carabelli trait of UM1 and allele fre- quencies for biochemical characters.
aFactor loadings Total Variable variance
PC I II (%)
Carabelli trait 0.96 0.20 95.64
Kidd system (Jk*a) 0.86 0.39 89.74
P system (P*1) 0.34 0.86
†86.30
PTC (T) 0.62 0.72 89.15
Total contribution (%) 53.84 36.37 90.21
Cumulative proportion (%) 53.84 90.21 90.21
a
The number of populations used is 10. The number of the principal components shown here was so determined that the cumulative proportion of the variances of principal components exceeded 80%.
†
p 0.10; * p 0.05; ** p 0.01; *** p 0.001, by a two-tailed bootstrap test.
month, average temperature in the coldest month and the amount of annual rainfall, was found to be inversely associated with allele 1 of glyox- alase I and latitude (Tables 25 and 26). Regard- ing the associations with the ways of life, howev- er, they were not significant at the 5% level (Tables 61 and 62).
Transferrin and the nasal index seemed to con- stitute a character complex in the second-step analysis (Table 8). But, in the final-step analysis (Tables 27, 28, 63 and 64), such a complex was not confirmed.
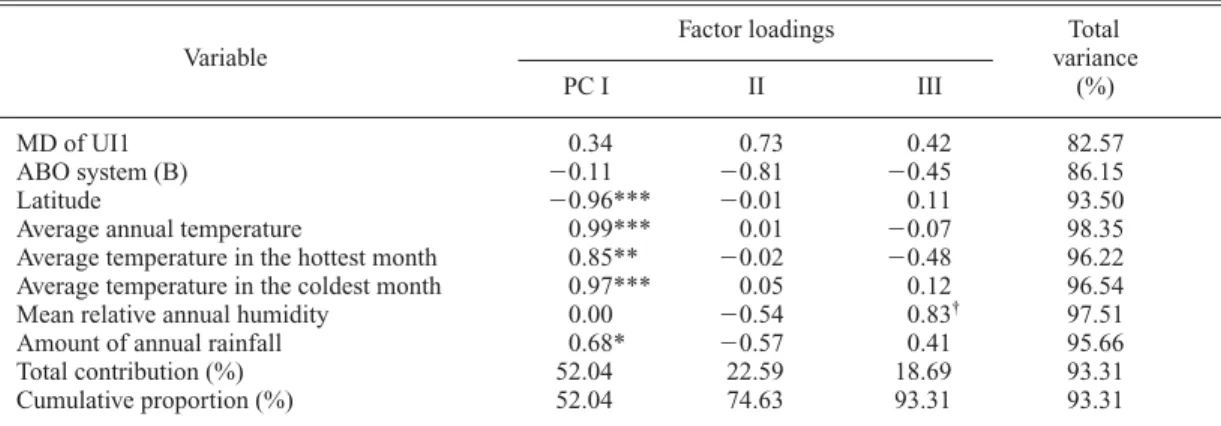
Although an inverse association was found be- tween the MD diameter of UI1 and allele B of the ABO system in the second-step analysis (Table 9), further tests of the reality for this char- acter complex were not statistically significant in the final-step analyses (PC II in Table 29 and PC II in Table 65).
The MD diameters of UM1 and UM2 were found to constitute a single character complex to- gether with many biochemical/physiological characters, i.e., allele 1 of haptoglobin-alpha, al- lele S of properdin factor B glycine-rich beta- glycoprotein, allele Se of the ABH secretion, and allele B of the ABO system (Tables 11 and 12) in the second-step analysis. Also in the final-step analyses, it was confirmed that each of three alle- les, i.e., allele 1 of haptoglobin-alpha (the second rotated factor [Fac II] in Table 34), allele S of properdin factor B glycine-rich beta-glycoprotein (PC II in Table 35) and allele B of the ABO sys- tem (PC II in Table 39 and Fac II in Table 40),
constituted a character complex together with the MD diameters of UM1 and UM2. Among them, however, only one character complex consisting of haptoglobin-alpha allele 1 and the maxillary molar MD diameters was associated with a cli- matic factor, i.e., average temperature in the coldest month (Fac II in Table 34). None of the above character complexes was associated with any of the ways of life (Tables 69 to 76).
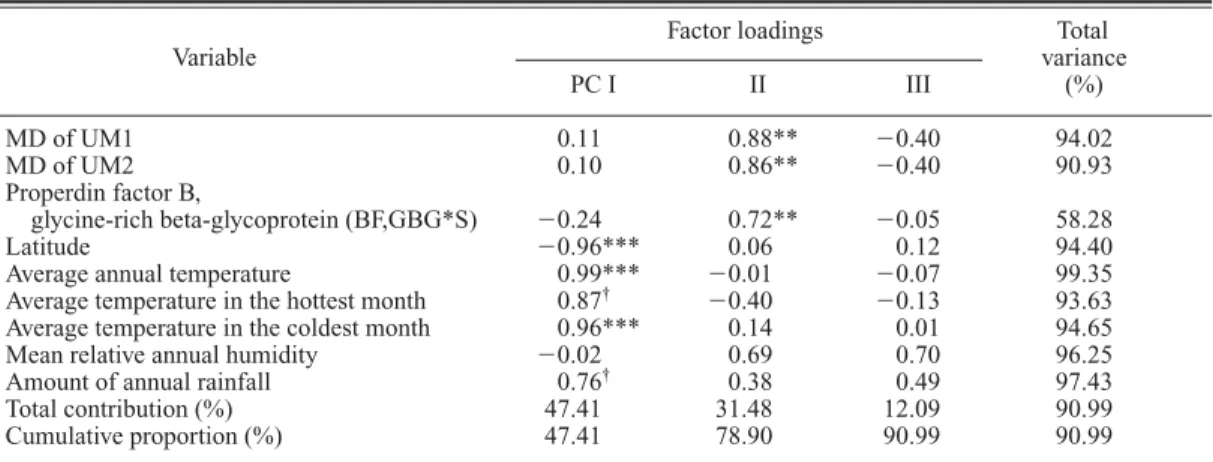
The BL diameters of UM1 and UM2 did not show any significant associations with biochemi- cal/physiological characters in the second-step analyses (Tables 13 and 14). But, in the final-step analysis, one character complex was found.
Namely, the BL diameter of UM2 and alleles MS of the MNS system were significantly associated with each other and with the average annual tem- perature, average temperature in the hottest month, average temperature in the coldest month, and the amount of annual rainfall (PC I in Table 43). On the other hand, there was no character complex consisting of maxillary molar BL diam- eters and biochemical/physiological characters that is further associated with any of the ways of life (Tables 77 to 82).
UI1 shoveling was found to be significantly as- sociated with alleles cDE of the Rhesus system in the second-step analysis (Fac II in Table 16).
But, in the final-step analysis, this character com- plex was not found to be significantly associated with any natural or cultural environmental vari- ables (Tables 47, 48, 83 and 84).
Lactase activity had a significant inverse corre-
Table 18. Solution obtained through the normal varimax rotation of the first two principal components (Table 17) from the ecological correlations on the Carabelli trait of UM1 and allele frequencies for biochemical charac- ters.
aFactor loadings Variable
Fac I II
Carabelli trait 0.91 0.37
Kidd system (Jk*a) 0.50 0.81
†P system (P*1) 0.20 0.91
†PTC (T) 0.91 0.25
a
The cumulative proportion of the two principal components is 90.21%.
†
p0.10; * p0.05; **p0.01; *** p0.001, by a two-tailed bootstrap test.
Table 20. Solution obtained through the normal varimax rotation of the first two principal components (Table 19) from the ecological correlations on stature, the frequency of CHE2* , and climatic variables.
aFactor loadings Variable
Fac I II
Stature 0.28 0.47
Cholinesterase 2, pseudocholinesterase 2 (CHE2*) 0.56 0.68
Latitude 0.91*** 0.36
Average annual temperature 0.93*** 0.30
Average temperature in the hottest month 0.80** 0.48 Average temperature in the coldest month 0.93*** 0.27
Mean relative annual humidity 0.07 0.91
Amount of annual rainfall 0.95*** 0.15
a
The cumulative proportion of the two principal components is 81.78%.
†
p 0.10; * p 0.05; ** p 0.01; *** p 0.001, by a two-tailed bootstrap test.
Table 21. Principal component analysis of the ecological correlations on cephalic index, the frequency of PGM1*1, and climatic variables.
aFactor loadings Total
Variable variance
PC I II III (%)
Cephalic index 0.62*** 0.13 0.64 81.79
Phosphoglucomutase 1 (PGM1*1) 0.64* 0.22 0.60 81.77
Latitude 0.97*** 0.13 0.04 95.46
Average annual temperature 0.97*** 0.11 0.20 98.44 Average temperature in the hottest month 0.87*** 0.42* 0.14 94.18 Average temperature in the coldest month 0.94*** 0.04 0.22 93.72 Mean relative annual humidity 0.07 0.98*** 0.11 98.15 Amount of annual rainfall 0.71** 0.57
†0.32 93.56 Total contribution (%) 60.10 19.49 12.54 92.13 Cumulative proportion (%) 60.10 79.59 92.13 92.13
a
The number of populations used is 18. The number of the principal components shown here was so determined that the cumulative proportion of the variances of principal components exceeded 80%.
†
p0.10; * p0.05; ** p0.01; *** p0.001, by a two-tailed bootstrap test.
Table 19. Principal component analysis of the ecological correlations on stature, the frequency of CHE2* , and climatic variables.
aFactor loadings Total Variable variance
PC I II (%)
Stature 0.46 0.30 30.20
Cholinesterase 2, pseudocholinesterase 2 (CHE2* ) 0.80** 0.36 77.41
Latitude 0.97*** 0.07 95.08
Average annual temperature 0.97*** 0.13 95.54 Average temperature in the hottest month 0.93*** 0.08 86.77 Average temperature in the coldest month 0.95*** 0.16 93.86
Mean relative annual humidity 0.33 0.85 82.78
Amount of annual rainfall 0.79 0.55 92.58
Total contribution (%) 65.50 16.28 81.78
Cumulative proportion (%) 65.50 81.78 81.78
a
The number of populations used is 11. The number of the principal components shown here was so determined that the cumulative proportion of the variances of principal components exceeded 80%.
†
p 0.10; * p 0.05; ** p 0.01; *** p 0.001, by a two-tailed bootstrap test.
Table 24. Solution obtained through the normal varimax rotation of the first three principal components (Table 23) from the ecological correlations on cephalic index, colorblindness, and climatic variables.
aFactor loadings Variable
Fac I II III
Cephalic index 0.38* 0.12 0.79
Colorblindness (CB) 0.07 0.20 0.89
†Latitude 0.95*** 0.05 0.14
Average annual temperature 0.97*** 0.06 0.14 Average temperature in the hottest month 0.93*** 0.28 0.01 Average temperature in the coldest month 0.93*** 0.18 0.18 Mean relative annual humidity 0.06 0.98* 0.09
Amount of annual rainfall 0.73** 0.61 0.03
a
The cumulative proportion of the three principal components is 90.71%.
†
p 0.10; * p 0.05; ** p 0.01; *** p 0.001, by a two-tailed bootstrap test.
Table 22. Solution obtained through the normal varimax rotation of the first three principal components (Table 21) from the ecological correlations on cephalic index, the frequency of PGM1*1, and climatic variables.
aFactor loadings Variable
Fac I II III
Cephalic index 0.25** 0.01 0.87
Phosphoglucomutase 1 (PGM1*1) 0.26 0.12 0.86
Latitude 0.89*** 0.04 0.39
Average annual temperature 0.96*** 0.01 0.25 Average temperature in the hottest month 0.90*** 0.30* 0.20 Average temperature in the coldest month 0.92*** 0.16 0.25 Mean relative annual humidity 0.19 0.97*** 0.05
Amount of annual rainfall 0.67* 0.68* 0.16
a
The cumulative proportion of the three principal components is 92.13%.
†
p 0.10;* p 0.05; ** p 0.01; *** p 0.001, by a two-tailed bootstrap test.
Table 23. Principal component analysis of the ecological correlations on cephalic index, colorblindness, and cli- matic variables.
aFactor loadings Total
Variable variance
PC I II III (%)
Cephalic index 0.55* 0.39 0.57 78.36
Colorblindness (CB) 0.10 0.72 0.56 84.22
Latitude 0.95*** 0.03 0.11 92.23
Average annual temperature 0.98*** 0.01 0.11 96.53 Average temperature in the hottest month 0.86*** 0.20 0.40 93.95 Average temperature in the coldest month 0.96*** 0.05 0.01 92.72 Mean relative annual humidity 0.06 0.81* 0.56 97.60 Amount of annual rainfall 0.78** 0.51
†0.17 90.07 Total contribution (%) 55.73 20.49 14.48 90.71 Cumulative proportion (%) 55.73 76.23 90.71 90.71
a
The number of populations used is 14. The number of the principal components shown here was so determined that the cumulative proportion of the variances of principal components exceeded 80%.
†
p 0.10; * p 0.05; **p 0.01; *** p 0.001, by a two-tailed bootstrap test.
Table 25. Principal component analysis of the ecological correlations on nasal index, the frequency of GLO1*1, and climatic variables.
aFactor loadings Total Variable variance
PC I II (%)
Nasal index 0.79*** 0.09 62.94
Glyoxalase I (GLO1*1) 0.69* 0.55* 78.56
Latitude 0.96*** 0.06 93.25
Average annual temperature 0.98*** 0.13 98.32 Average temperature in the hottest month 0.91** 0.24 88.33 Average temperature in the coldest month 0.94*** 0.28*** 95.77 Mean relative annual humidity 0.19 0.95*** 93.70
Amount of annual rainfall 0.76* 0.54
†86.79
Total contribution (%) 66.36 20.84 87.21
Cumulative proportion (%) 66.36 87.21 87.21
a
The number of populations used is 11. The number of the principal components shown here was so determined that the cumulative proportion of the variances of principal components exceeded 80%.
†
p0.10; * p0.05; ** p0.01; *** p0.001, by a two-tailed bootstrap test.
Table 26. Solution obtained through the normal varimax rotation of the first two principal components (Table 25) from the ecological correlations on nasal index, the frequency of GLO1*1, and climatic variables.
aFactor loadings Variable
Fac I II
Nasal index 0.72* 0.34
Glyoxalase I (GLO1*1) 0.48* 0.74**
Latitude 0.93*** 0.26
Average annual temperature 0.97*** 0.19
Average temperature in the hottest month 0.78** 0.52**
Average temperature in the coldest month 0.98*** 0.04
Mean relative annual humidity 0.13 0.96***
Amount of annual rainfall 0.89** 0.27
a
The cumulative proportion of the two principal components is 87.21%.
†
p 0.10; * p 0.05; ** p 0.01; *** p 0.001, by a two-tailed bootstrap test.
Table 27. Principal component analysis of the ecological correlations on nasal index, the frequency of TF*C, and climatic variables.
aFactor loadings Total
Variable variance
PC I II III (%)
Nasal index 0.71*** 0.10 0.63 91.83
Transferrin (TF*C) 0.43 0.58 0.63 91.93
Latitude 0.97*** 0.01 0.11 94.43
Average annual temperature 0.97*** 0.03 0.21 98.40 Average temperature in the hottest month 0.85** 0.29 0.35 92.65 Average temperature in the coldest month 0.95*** 0.16 0.09 93.08 Mean relative annual humidity 0.08 0.90** 0.39 96.75 Amount of annual rainfall 0.64
†0.73* 0.01 94.03 Total contribution (%) 57.53 22.38 14.23 94.14 Cumulative proportion (%) 57.53 79.91 94.14 94.14
a
The number of populations used is 15. The number of the principal components shown here was so determined that the cumulative proportion of the variances of principal components exceeded 80%.
†
p 0.10; * p 0.05; ** p 0.01; *** p 0.001, by a two-tailed bootstrap test.
Table 29. Principal component analysis of the ecological correlations on the MD diameter of UI1, the frequency of ABO*B, and climatic variables.
aFactor loadings Total
Variable variance
PC I II III (%)
MD of UI1 0.34 0.73 0.42 82.57
ABO system (B) 0.11 0.81 0.45 86.15
Latitude 0.96*** 0.01 0.11 93.50
Average annual temperature 0.99*** 0.01 0.07 98.35 Average temperature in the hottest month 0.85** 0.02 0.48 96.22 Average temperature in the coldest month 0.97*** 0.05 0.12 96.54 Mean relative annual humidity 0.00 0.54 0.83
†97.51 Amount of annual rainfall 0.68* 0.57 0.41 95.66 Total contribution (%) 52.04 22.59 18.69 93.31 Cumulative proportion (%) 52.04 74.63 93.31 93.31
a
The number of populations used is 18. The number of the principal components shown here was so determined that the cumulative proportion of the variances of principal components exceeded 80%.
†
p0.10; * p0.05; ** p0.01; *** p0.001, by a two-tailed bootstrap test.
Table 30. Solution obtained through the normal varimax rotation of the first three principal components (Table 29) from the ecological correlations on the MD diameter of UI1, the frequency of ABO*B, and climatic vari- ables.
aFactor loadings Variable
Fac I II III
MD of UI1 0.20
†0.89 0.01
ABO system (B) 0.03 0.93 0.07
Latitude 0.96*** 0.11 0.05
Average annual temperature 0.98*** 0.14 0.08 Average temperature in the hottest month 0.94*** 0.14 0.25 Average temperature in the coldest month 0.92*** 0.26 0.22 Mean relative annual humidity 0.15 0.01 0.98
†Amount of annual rainfall 0.60* 0.14 0.76
†a
The cumulative proportion of the three principal components is 93.31%.
†
p0.10; * p0.05; ** p0.01; *** p0.001, by a two-tailed bootstrap test.
Table 28. Solution obtained through the normal varimax rotation of the first three principal components (Table 27) from the ecological correlations on nasal index, the frequency of TF*C, and climatic variables.
aFactor loadings Variable
Fac I II III
Nasal index 0.40* 0.22 0.84
Transferrin (TF*C) 0.11 0.25 0.92
Latitude 0.93*** 0.04 0.29
Average annual temperature 0.97*** 0.03 0.19 Average temperature in the hottest month 0.90*** 0.32
†0.15 Average temperature in the coldest month 0.92** 0.20 0.23 Mean relative annual humidity 0.16 0.97* 0.05
Amount of annual rainfall 0.64
†0.73 0.04
a
The cumulative proportion of the three principal components is 94.14%.
†
p 0.10; * p 0.05; ** p 0.01; *** p 0.001, by a two-tailed bootstrap test.
Table 33. Principal component analysis of the ecological correlations on the MD diameters of UM1 and UM2, the frequency of HPA*1, and climatic variables.
aFactor loadings Total
Variable variance
PC I II III (%)
MD of UM1 0.44 0.83
†0.23 93.56
MD of UM2 0.43 0.80
†0.30 91.95
Haptoglobin, alpha (HPA*1) 0.62 0.58 0.04 72.99
Latitude 0.93*** 0.24 0.11 93.89
Average annual temperature 0.95*** 0.28 0.06 98.44 Average temperature in the hottest month 0.73* 0.60
†0.25 96.52 Average temperature in the coldest month 0.97*** 0.12 0.03 95.23 Mean relative annual humidity 0.10 0.37 0.91* 97.06 Amount of annual rainfall 0.71** 0.10 0.67** 95.82 Total contribution (%) 50.37 25.86 16.60 92.83 Cumulative proportion (%) 50.37 76.23 92.83 92.83
a
The number of populations used is 17. The number of the principal components shown here was so determined that the cumulative proportion of the variances of principal components exceeded 80%.
†
p0.10;* p0.05; ** p0.01; *** p0.001, by a two-tailed bootstrap test.
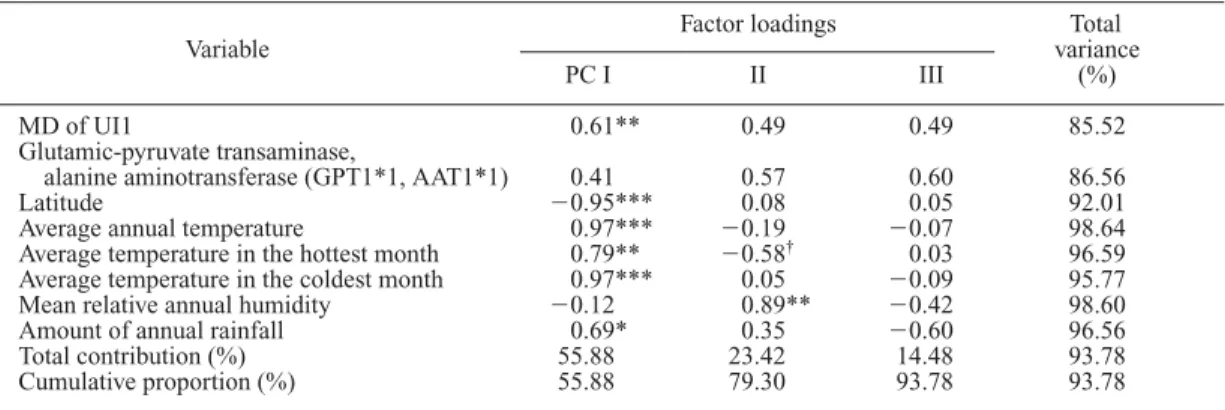
Table 31. Principal component analysis of the ecological correlations on the MD diameter of UI1, the frequency of GPT1*1,AAT1*1, and climatic variables.
aFactor loadings Total
Variable variance
PC I II III (%)
MD of UI1 0.61** 0.49 0.49 85.52
Glutamic-pyruvate transaminase,
alanine aminotransferase (GPT1*1, AAT1*1) 0.41 0.57 0.60 86.56
Latitude 0.95*** 0.08 0.05 92.01
Average annual temperature 0.97*** 0.19 0.07 98.64 Average temperature in the hottest month 0.79** 0.58
†0.03 96.59 Average temperature in the coldest month 0.97*** 0.05 0.09 95.77 Mean relative annual humidity 0.12 0.89** 0.42 98.60 Amount of annual rainfall 0.69* 0.35 0.60 96.56 Total contribution (%) 55.88 23.42 14.48 93.78 Cumulative proportion (%) 55.88 79.30 93.78 93.78
a
The number of populations used is 14. The number of the principal components shown here was so determined that the cumulative proportion of the variances of principal components exceeded 80%.
†
p 0.10; * p 0.05; ** p 0.01; *** p 0.001, by a two-tailed bootstrap test.
Table 32. Solution obtained through the normal varimax rotation of the first three principal components (Table 31) from the ecological correlations on the MD diameter of UI1, the frequency of GPT1*1,AAT1*1, and cli- matic variables.
aFactor loadings Variable
Fac I II III
MD of UI1 0.31* 0.09 0.87
†Glutamic-pyruvate transaminase,
alanine aminotransferase (GPT1*1,AAT1*1) 0.08 0.08 0.92
†Latitude 0.92*** 0.03 0.26
Average annual temperature 0.97*** 0.10 0.20 Average temperature in the hottest month 0.86** 0.47 0.02 Average temperature in the coldest month 0.92*** 0.09 0.31 Mean relative annual humidity 0.19 0.96
†0.16
Amount of annual rainfall 0.74
†0.65 0.02
a
The cumulative proportion of the three principal components is 93.78%.
†
p0.10; * p0.05; ** p0.01; *** p0.001, by a two-tailed bootstrap test.
Table 34. Solution obtained through the normal varimax rotation of the first three principal components (Table 33) from the ecological correlations on the MD diameters of UM1 and UM2, the frequency of HPA*1, and cli- matic variables.
aFactor loadings Variable
Fac I II III
MD of UM1 0.04 0.97* 0.04
MD of UM2 0.04 0.96
†0.03
Haptoglobin, alpha (HPA*1) 0.29 0.77* 0.21
Latitude 0.95** 0.21 0.04
Average annual temperature 0.97** 0.17 0.09
Average temperature in the hottest month 0.95*** 0.15 0.22*
Average temperature in the coldest month 0.91** 0.29* 0.21 Mean relative annual humidity 0.16 0.11 0.97*
Amount of annual rainfall 0.61* 0.02 0.76
†a
The cumulative proportion of the three principal components is 92.83%.
†
p 0.10; * p 0.05; ** p 0.01; *** p 0.001, by a two-tailed bootstrap test.
Table 35. Principal component analysis of the ecological correlations on the MD diameters of UM1 and UM2, the frequency of BF,GBG*S, and climatic variables.
aFactor loadings Total
Variable variance
PC I II III (%)
MD of UM1 0.11 0.88** 0.40 94.02
MD of UM2 0.10 0.86** 0.40 90.93
Properdin factor B,
glycine-rich beta-glycoprotein (BF,GBG*S) 0.24 0.72** 0.05 58.28
Latitude 0.96*** 0.06 0.12 94.40
Average annual temperature 0.99*** 0.01 0.07 99.35 Average temperature in the hottest month 0.87
†0.40 0.13 93.63 Average temperature in the coldest month 0.96*** 0.14 0.01 94.65 Mean relative annual humidity 0.02 0.69 0.70 96.25 Amount of annual rainfall 0.76
†0.38 0.49 97.43 Total contribution (%) 47.41 31.48 12.09 90.99 Cumulative proportion (%) 47.41 78.90 90.99 90.99
a
The number of populations used is 13. The number of the principal components shown here was so determined that the cumulative proportion of the variances of principal components exceeded 80%.
†
p0.10; * p0.05; ** p0.01; *** p0.001, by a two-tailed bootstrap test.
Table 36. Solution obtained through the normal varimax rotation of the first three principal components (Table 35) from the ecological correlations on the MD diameters of UM1 and UM2, the frequency of BF,GBG*S, and climatic variables.
aFactor loadings Variable
Fac I II III
MD of UM1 0.10 0.96* 0.09
MD of UM2 0.09 0.95* 0.08
Properdin factor B,
glycine-rich beta-glycoprotein (BF,GBG*S) 0.27 0.65 0.29
Latitude 0.97** 0.01 0.04
Average annual temperature 1.00** 0.03 0.02
Average temperature in the hottest month 0.90** 0.28* 0.23 Average temperature in the coldest month 0.95** 0.12 0.16 Mean relative annual humidity 0.11 0.26 0.94
†Amount of annual rainfall 0.70
†0.09 0.69
†a
The cumulative proportion of the three principal components is 90.99%.
†