松倉 啓太1) 平嶋 裕輔2)
エリートサッカーゴールキーパーにおける 異なるシュートパタンに対する事前動作の特性
1)同志社大学スポーツ健康科学部
〒610-0394 京都府京田辺市多々羅都谷1-3
2)筑波大学体育系
〒305-8574茨城県つくば市天王台1-1-1
連絡先 松倉啓太
1. Faculty of Health and Sports Science, Doshisha University 1-3 Tatara Miyakodani, Kyotanabe, Kyoto 610-0394 2. Faculty of Health and Sports Science, University of Tsu-
kuba1-1-1 Tennodai, Tsukuba, Ibaraki 305-8574 Corresponding author kmatsuku@mail.doshisha.ac.jp Abstract:
The aim of this study was to shed light on preparatory sequences performed by elite goalkeepers for defense against shots in response to variations in the position from where a shot at goal is taken, and in the number of touches ahead of the shot. The samples were extracted from videos of shots in all 64 matches of the 2018 FIFA World Cup in Russia. First, to analyze the characteristics of shots in elite games, data on shots from different areas and after various numbers of touches were studied. Then, to analyze the preparatory sequences taken by goalkeep- ers to defend against those shots, the shots were classified into 6 groups based on ‘the presence or absence of a specific prejump’, ‘a change in the distance between the feet during the preparation period’, and ‘whether the goal- keeper was still in a moving position or had completed the move’. The results of this analysis of the characteristics of the elite game made it possible to divide the positions from where shots were taken in 2 types, based on the probability of the shot being on target and the probability that a goal would be scored. In addition, it was shown that when one-touch shots were on target, it was difficult for goalkeepers to defend against them. Next, as an over- all trend, the most frequent preparatory sequence performed by goalkeepers was to prepare for a shot with a slight jump in order to widen the distance between the feet after they had finished moving into position. In addition, a breakdown of the preparatory sequences for various numbers of touches ahead of the shot revealed that – for one- touch shots – a proportion of goalkeepers moved into position until immediately before the shot was taken. Over- all, from these analyses, it was concluded that elite goalkeepers must engage in different preparatory sequences depending on the circumstances of the shot.
Key words: pre jump, split step, positioning, FIFA World Cup 2018, game performance analysis
キーワード:プレジャンプ,スプリットステップ,ポジション移動,FIFA ワールドカップ 2018,
ゲーム パフォーマンス分析
MATSUKURA
1Keita and HIRASHIMA
2Yusuke : Characteristics of preparatory sequences performed by elite soccer goalkeepers for defense against different shot patterns. Japan J. Phys. Educ. Hlth. Sport Sci.
Ⅰ 緒 言
サッカーのゴールキーパー(以下「GK」と略 す)には大きな仕事の
1
つとして,“相手のシュ ートからゴールを守る”(以下「シュートストップ」と略す)ことがある.このように「放たれたボー ルに対して移動し,ボールに到達する」という運 動課題は,野球やラケット種目といった他種目に
おいても共通してみられるものである.いずれの 種目においても実際にボールが放たれる時点で は,「相手がボールを蹴る・打つタイミング」を 認識することは比較的容易なケースが多いが,「ボ ールがどこへ飛来してくるのか」は,実際にボー ルが放たれるまで判別が困難であると考えられて いる.このような状況を
Uzu et al.
(2009)は「Knowwhen, not where」と表現しているが,種目ごとに
状況は異なる.原著論文
1050
松倉・平嶋 そこで,GKのシュートストップ時の「Knowwhen, not where」の状態における特徴について3
点あげる.1つ目は相手選手が複数いることや,ボールの移動に伴って,“どの選手” によって,“ど の位置” からシュートが放たれるのかがシュー トごとに異なるという点である.2017年度版の
JFA(日本サッカー協会)ゴールキーパープロジ
ェクト発行の指導教本(JAFゴールキーパープロ ジェクト,2017:以下「JFA指導教本」と略す)において直接的なシュートに対するポジショニン グとして,「ゴールの中央とボールを結んだ線上 を意識して左右均等の位置に立つ(正確には,ボ ールと両ポストを結んだ等角線上に立つ)頭を越 されない位置でボールに正対する」,「頭上を越さ れない距離だけ前に出て,角度を狭める」,「ボー ルに正対する」と記されていることから(Figure 1 参照),シュートごとに異なるボールの移動に応 じて,自身のポジションを移動させることが必要 となる.2つ目はサッカーの試合はボールが外に 出た場合や,反則が起きた場合を除き,プレーが 途切れることは無いため,シュートを打たれるま でのインターバルが生じない点である.そのため
GK
はプレーが続いている中で,シュートを打た れるまでにボール位置の変化に応じた移動を行う 必要がある.そして,選手間のパスによるボール の移動は,GK
の移動よりも速くなることがあり,より素早い移動を求められることがある.3つ目 は,シュートを打つ選手が味方のパスに対して
1
タッチ目のタイミングで打つのか,2タッチ目以 降のタイミングで打つのかがシュートごとに異な るという点である.そのため,あらゆるシュート のタイミングを予測してシュートに備える必要が ある.例えばラケット種目のラリー局面において は,2つ目の特徴同様に,プレーが続いている中 で移動をしなくてはならない点は共通であるが,相手がボールを打つタイミングは,常にラケット とボールがコンタクトする瞬間と決定される.し たがってこれら
3
つの特徴を同時に抱えているこ とが,GKのシュートストップが,「Know when,not where」の状況下において,多種目と異なる点
であるといえる.さらに
GK
はシュートに備える中で,ボールに 対して素早く移動できるよう,相手がシュートを 打つタイミングに合わせて適した構えをとる.GK
Shooter
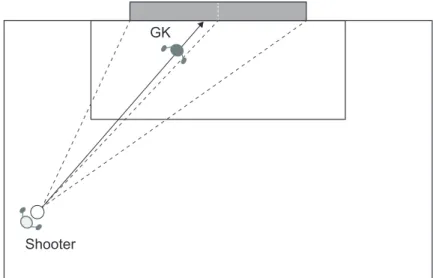
Figure 1. Diagram of position of the goalkeeper when stopping a shot The dotted lines in the diagram connect the location of a left-side ball (represented by a circle) with the goal posts and with the centre of the goal. By standing on the midline (the arrowed line in the diagram) of the angle, created by the lines that link the location of ball with the goal posts, the goalkeeper has an equal distance to go to stop a shot on either side.
Figure 1 Diagram of position of the goalkeeper when stopping a shot. The dotted lines in the diagram connect the location of a left-side ball (represented by a circle) with the goal posts and with the centre of the goal. By standing on the midline (the arrowed line in the diagram) of the angle, created by the lines that link the location of ball with the goal posts, the goalkeeper has an equal distance to go to stop a shot on either side.
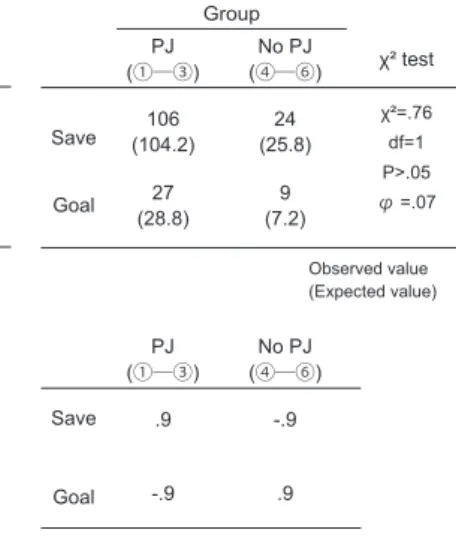
Ibrahim et al.(2019a)はシュートに対する構えに
ついて,シュートストップ時を模した実験におい て,脚幅や膝の角度を変えながらボールまでの到 達過程の違いを検討した.その結果,脚幅が下肢長の約
75%からダイビングを実施したケースが
最もボールまでの到達が早かったことを報告し ており,ここからシュートが放たれる際の脚幅 が,その後の移動に影響を与えることが考えられ る.また,多くの種目の選手が構えに先立つ準備 動作として,ボールが放たれる直前に,鉛直方向 に軽くジャンプを行い,ジャンプの接地後に,主 動作となる「ボール方向への移動」を実施する.
このようなジャンプについて,テニスでは,脚幅 を拡げながら実施することからスプリットステ ップ(以下「SS」と略す)と表現され,サッカ ーではプレジャンプ(以下「PJ」と略す)」とい った用語で表現される.これまで,実験条件下に おいては,SSならびに
PJ
の実施による目標地点 への移動時間の短縮(Nieminen et.al., 2014; 玉井・松本,1981;Uzu et al., 2009)や,地面反力を発 揮するまでの反応時間の短縮(Nieminen et.al.,
2014)が報告されている.その起因として Uzu et
al.(2009)は,下腿の筋肉による予備緊張をあげ
ている.さらに実験条件下では無く,実際のゲー ムパフォーマンスの分析結果から準備動作の効果 についても検討されている.沼津ほか(2017)は,大学
1
部リーグに所属するチームのGK
のプレー を分析し,PJのような準備動作が無い場合にシ ュートストップ失敗,すなわちゴールを許す割合 が高いことを報告している.これらの報告は,PJ やSS
のような準備動作の実施がGK
のシュート ストップ時において効果的であることを示唆して いる.一方,Uzu et al.(2009)は同時に,SS実施時 に懸念されることとして,「SS実施時においてジ ャンプの接地は,移動方向を示す電気刺激が提示 されてから約
0.2
秒後が最も効果的であるが,タ イミングがずれてしまうと効果的ではない」と報 告している.平嶋ほか(2014,2018)によると,サッカーのワールドカップにおいて,失点時にお けるシュートが打たれてからゴールに到達するま
での平均時間は,2014年大会が
0.56
秒(標準偏 差0.26
秒),2010年大会が0.6
秒(同0.3
秒)で あったことから,多くの割合のゴールがシュート を打たれてから1
秒以内にゴールまで到達してい たことが分かる.したがってシュートストップ時 においては,準備動作の実施においてタイミング の遅れが生じた場合,失点に直結してしまう恐れ も考えられる.そのため「JFA指導教本」におい ては,「GKはシュートを打たれる際に予備動作 を小さくすること.大きくなりすぎると動き出し が遅れてしまう」との記載がある.なお,ここで 示した「予備動作」は,GKが動き出しのきっか けとして上下に体重移動することを示し,本文に おいて表現する「準備動作」と同じ意味であると 捉える.また同様の理由で,GKの専門書におい て小島(2010)は,準備動作の実施に否定的な意 見を述べている.これまでのことから,シュートストップ時の事 前動作は,動き出しが遅れることがないよう,適 したタイミングで実施されれば非常に効果的であ る一方,タイミングがずれるとリスクが伴うこと が示された.さらにシュートが放たれる状況次第 では,GK自身に準備動作を実施する意思があり ながらも,実施するタイミングを逸してしまうケ ースも想定される.したがってこのような準備動 作の実施を適切なトレーニングによって習得なら びに改善することができれば,GKのシュートス トップ成功確率向上に繋がると考えられる.
このような状況認知や状況判断を含む動作の改 善を狙いとした適切なトレーニングを実施するた めには,ヤーン(1998)が,戦術トレーニングの 第1段階としてあげているように,「典型的な状 況の反復」が求められる.そのために当該プレー の起こりうる場面を再現し,その出現頻度を高め るようなトレーニングを計画することが望ましい と考えられる.しかし,これまで述べてきたよう に,GKの動作やシュートパタンについて,個別 に行われた研究はあるものの,事前動作として移 動や準備動作を含めたシュートが打たれるまでの 局面において,どのようなエリアで,どのような シュートに対して,どのように事前動作を行って
1052
松倉・平嶋 いたのかは明らかにされていない.したがって,実際の試合でどのようなケースにおいて,どのよ うな事前動作の出現頻度が高かったのかを明らか にすることは,トレーニングを計画する上で場面 の再現や,難易度の設定において非常に有益な示 唆になりうると考えられる.
そこで本研究は,2018FIFAワールドカップロ シア大会におけるシュートシーンの特徴ならび に,シュート位置,シュートに至るタッチ数に応 じた
GK
の事前動作を分析し,シュートを打たれ る前の局面における,トップレベルのGK
による シュート場面別対処法を明らかにすることを目的 とする.Ⅱ 方 法
1. 用語の定義
本研究で使用する主要な用語について以下のよ うに定義した.
1.1 準備動作
沼津ほか(2017)は,準備動作として「GKが セービング動作を行う前にみられる,鉛直上方へ の小さなジャンプ動作」と記している.そこで本 研究では
PJ
やSS
のようにシュートが放たれる 際に動き出しのきっかけとして実施する,「小さ な跳躍ならびにステップ動作の総称」を準備動作 と定義する.1.2 ポジショニング
JFA
指導教本において,直接的なシュートに対 するポジショニングとして,「ゴールの中央とボ ールを結んだ線上を意識して左右均等の位置に立 つ(正確には,ボールと両ポストを結んだ等角線 上に立つ)頭を越されない位置でボールに正対す る」,「頭上を越されない距離だけ前に出て,角度 を狭める」,「ボールに正対する」と記されている.本研究においては,衛星中継により放送された映 像より
GK
の動作を分析したため,シュート時に おけるGK
の位置が,「正確に左右均等の位置で あった」のかを確認することは難しい.そこで,中継映像よりシュート時にゴールの中央とボール を結んだ線上付近に
GK
が位置していたと確認さ れた場合は,シュートに対応可能であると評価し,「正しいポジションに位置していた」と定義した.
一方,明らかにゴールの中央とボールを結んだ線 上付近に
GK
が位置していなかったことが確認さ れた,もしくは事前のプレーでGK
が体を倒して 処理していたため,起き上がることが出来ずにシ ュートに対処できなかった場合を,「正しいポジ ションに位置していなかった」と定義した.1.3 事前動作
「正しいポジションに位置するための移動」な らびに「準備動作の実施」,そして「構えをとる」
というシュートへ対処するまでの局面の連続を事 前動作とした.ただし,既に正しいポジションに 位置していた場合においては移動が行われず,さ らに「準備動作」が行われないケースや「構えを とる」ことなくシュートに対処するケースもある.
2. 分析対象
標本は,2008年から
J
リーグオフィシャルデ ータサプライヤーとしてサッカーのゲームデータ の収集を専門とするデータスタジアムによって収 集された,2018FIFAワールドカップロシア大会 全64
試合における全てのシュート1,617
本から 抽出した.本研究では,セットプレーを除く,ゲームが進 行中のプレー,すなわちインプレー時におけるシ ュートの特徴と
GK
のシュートに対するプレーを 分析するため,全シュートのうち,ペナルティキ ックならびに直接フリーキックによって放たれた シュート,コーナーキックから直接ゴール方向に 向かったシュートのシーンを標本から除いた.さ らにGK
以外の選手によってブロックされたシュ ートは,ブロックが無かった場合に,枠内外のい ずれに飛来したか,枠内であればGK
によって防 ぐことが出来ていたかを判別することが出来ない ため,本研究では標本から除外した.2.1 シュートデータ分析
シュートデータの分析においては,後述のよう にシュート結果,すなわちシュートがゴールに入 ったか否かを検証する.そのため,GKが攻撃側 の崩しに対応できずにシュートを放たれた際に正 しいポジションに位置していなかった,もしくは 事前のプレーで
GK
が体を倒し処理していたため 起き上がることが出来ずに対処できなかった状況 下では,シュートを放つ側の難易度ならびに,防 ぐ側の難易度も,その他の状況と著しく異なって いたことが想定される.したがって,そのような 状況下であった25
シーンを除き,計944
シーン をシュートの特徴に関する分析対象とした.2.2 GK の事前動作分析
GK
の事前動作に関する分析を行うため,2.1 シュートデータ分析の対象944
シーンのうち,シ ュートが枠内に飛来した392
シーンを抽出した.そこから映像において
GK
の動作が確認できなか った7
シーンを除き,計385
シーンをGK
の事前 動作における分析対象とした.3. 測定項目 3.1 シュートデータ
各シュートにおいて,「シュート結果」,「シュ ートが放たれた位置」,「シュートに至るまでのタ
ッチ数」について下記のように分類した.なお,
これら分類に際しては,データスタジアムの算出 データを使用した.まず,シュート結果は,ゴー ル枠内もしくはゴール枠外に飛来したかを分類し た.なお,ゴールポストならびにゴールバーに当 たり,ゴールを外れたシュートも枠外とした.さ らに枠内へ飛来したシュートを
GK
によるシュー トストップ成功(以下「セーブ」と略す),シュ ートストップ失敗(以下「ゴール」と略す)に分 類した.次にシュートが放たれた位置は,ゴールまでの 距離(以下「シュート距離」と略す)とゴール に対しての角度の違いから
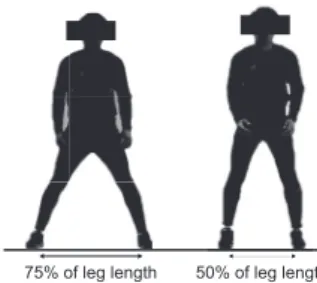
6
エリアに分類した(Figure 2).なおシュート距離はゴール中央から ペナルティエリアの縦の長さである
16.5 m
を基 準に,内側をNear,外側を Far
と分類した.シュ ート角度はWelsh(2014)を基に,ピッチ中央部
から両端へ向けて,それぞれA―C
の3
パタンに 分類した.さらに各エリアから放たれたシュート 結果のうち,「ゴール」となった数が統計処理時 の期待値よりも高かったエリアを「危険エリア」,期待値よりも低かったエリアを「危険エリア外」
と分類した.
最後に,シュートに至るまでのタッチ数は,シ ュートを放った選手が,シュートまでに要したボ ールタッチ数から,1タッチでのシュート(以下
Figure 2. Classification of positions from where a shot is taken The positions from where a shot can be taken have been
classified into three groups based on angle (A-C) and two groups based on distance [with shots from within a radius of 16.5m (the distance from the edge of the penalty area to the goal) being classified as ‘near’ (see dotted line of the diagram) and shots outside that radius being classified as ‘far’ ]
C area
B area
A area 16.5m Near
B area
C area Far
Figure 2 Classification of positions from where a shot is taken. The positions from where a shot can be taken have been classified into 3 groups based on angle (A-C) and 2 groups based on distance [with shots from within a radius of 16.5m (the distance from the edge of the penalty area to the goal) being classified as ‘near’ (see dotted line of the diagram) and shots outside that radius being classified as ‘far’ ]
1054
松倉・平嶋「1タッチシュート」と略す),2タッチ以上での シュート(以下「2タッチ以上シュート」と略す)
に分類した.
3.2 GK の事前動作
これまでシュートシーンにおける
GK
の事前動 作を詳細に分類した研究はみられない.したがっ て本研究では,JFA公認のGK
指導ライセンスを 有する筆者が事前動作を “準備動作の有無”,“準 備動作時における足幅の変化”,“移動中か完了し ていたのか” という観点を基に6
ケースに分類し た.①―③の事前動作は準備動作がみられるもの,④―⑥の事前動作では準備動作はみられないもの とした.6つの事前動作に関する詳細は次の通り である.準備動作が見られたグループについて,
①ならびに②は,準備動作の実施前までに移動を 完了した上で,①は
SS
のように,ジャンプ動作 離地前の足幅よりも,着地後の足幅が拡がってい たケース(以下「①足幅を拡げる準備動作」と略 す),②はジャンプ動作離地前の足幅と着地後の 足幅がほぼ変わらないケースとなる(以下「②足 幅が変わらない準備動作」と略す).③はシュー トが放たれる直前までGK
は移動が完了してない ものの,移動を継続しながら,離地時の位置と,着地時の位置が異なるように準備動作を実施した ケースとなる(以下「③移動しながら準備動作」
と略す).一方,準備動作が見られなかったケー スの分類に関する詳細は次の通りである.まず④ は明確な準備動作がみられなかったケース(以下
「④準備動作なし」と略す),⑤は
GK
がシュート を打つ選手に向かってアプローチすることで,放 たれたシュートに反応するのではなく,シュート を体に当ててブロックを試みたケースとなる(以 下「⑤シュート選手へアプローチ」と略す).⑥は,③と同様にシュートが放たれる直前まで
GK
は移 動が完了せず,かつ準備動作も行うこともなく,移動の継続中にシュートが放たれたケース(以下
「⑥移動継続中にシュート」と略す)となる.なお,
測定は鈴木・西嶋(2002)と同様に,衛星中継に より放送された試合を録画し,再生ならびに一時 停止させながら実施した.
3.3 測定上の限界
本研究のように諸外国で行われる世界トップレ ベルの試合を分析対象とする場合,直接会場にて 映像を撮影することは難しく,テレビ放映による 映像から分析を行わざるを得ない.しかしテレビ 放映の映像においては,どうしてもシュートを放 つ選手に焦点を当てられることが多く,GKの動 作について詳細に撮影ならびに放映されるケース は限られてしまう.そのためテレビで放送された シーンにおいて,GKの動きが大きく映る再生シ ーンがあった場合は動作の区別が容易となるが,
映像の角度や
GK
が映る大きさによっては,動作 の区別が難しくなる.そこで本研究においても枠 外に外れたシュートについては,GKの動作を映 像から確認出来るケースが少ないことを考慮し,動作の分析対象は枠内に飛来したシュートのみと した.
4. 統計解析方法 4.1 客観性
GK
の事前動作について,データの収集に測定 者の観察によって得られた,実際のゲームパフォ ーマンスを分析した結果を用いる際には,測定者 間の信頼性を示す客観性の検討が行われている(平嶋ほか,2018;沼津ほか,2017;鈴木・西嶋,
2002).そこで本研究においても,客観性を確認
するために2名の測定者によって6
項目に分類さ れた結果のカッパ(κ)係数を算出した.その際,標本と同じく
2018FIFA
ワールドカップロシア大 会の7
試合57
シーンを対象とした.測定者はサ ッカーGK
の競技経験ならびに指導経験があり,GK
指導ライセンスを有し,サッカーの科学研究 に従事している2
名で,測定は映像の一時停止お よび再生を繰り返す作業であるため,それぞれ個 別に実施した.4.2 測定項目間の比較
測定項目間の比較については項目ごとに異なる 検定を実施した.なお,統計処理における有意水
準は
5%とし,全てのデータ処理には IBM SPSS
Statistics ver.25
を用いた.まず,シュートの特徴に関する比較,ならびにタッチ数の異なるシュー トに対する事前動作の出現数やセーブ・ゴールに 関する比較は,カイ二乗検定(独立性の検定)を 用いて,有意差がみられたものについては,調整 済み残差により,どの項目間に有意差があるのか を算出した.
また,各事前動作の出現数に関する比較は,カ イ二乗検定(適合度の検定)を用いて,有意差が みられたものについては,中田(2007)の示すよ うに,多重比較検定において有意水準
0.05
を対 比較の総数で除し,名義尺度(α‘)を各対比較に 均等配分し,有意水準の調整を行った.本研究で は,比較対象の事前動作は6
群であることから,対比較数は6
C
2=15
であり,各対比較の名義水 準はα‘=0.05/15
=0.003,自由度(df)=1となる.
Ⅲ 結 果
1. 観測されたデータの客観性
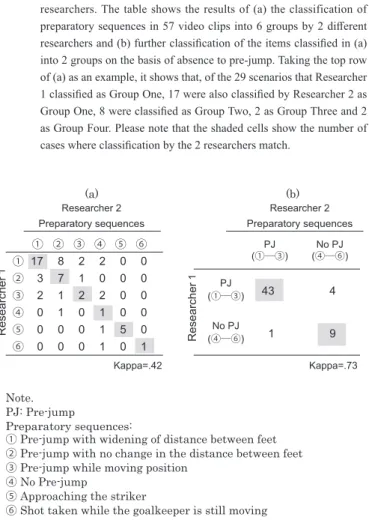
Table 1(a)は,
客観性を確認するために,2名の測定者によって
57
シーンの事前動作を6
項目 に分類した結果を示したものである.この時のκ
係数は0.42
であった.また,Table 1(b)は (a)における分類結果を,準備動作の有無を基準に2 つに分類した場合(準備動作有り:評価が①―③ の場合,準備動作無し:評価が④―⑥の場合)の
κ
係数は0.73
であった.2. トップレベルのゲームにおけるシュートシー ンの特徴
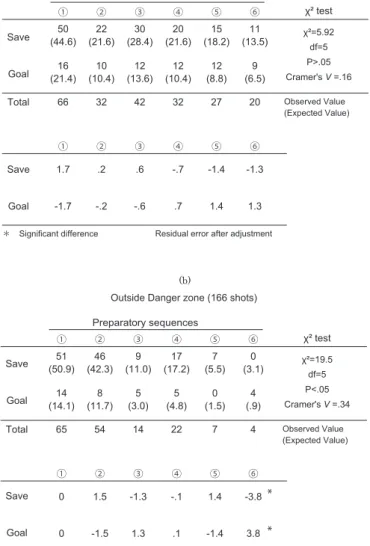
Table 2-1
は各エリアから放たれたシュートにお①
②
③
④
⑤
⑥
① 17 3 2 0 0 0
② 8 7 1 1 0 0
③ 2 1 2 0 0 0
④ 2 0 2 1 1 1
⑤ 0 0 0 0 5 0
⑥ 0 0 0 0 0 1
(①―③)PJ 43
1
4 9 (①―③)PJ No PJ
(④―⑥)
No PJ (④―⑥)
Κappa=.73 Kappa=.42
Researcher 1
Researcher 2
Researcher 1
Researcher 2
Table 1. The results of classification of preparatory sequences by two different researchers. The table shows the results of (a) the classification of preparatory sequences in 57 video clips into six groups by two different researchers and (b) further classification of the items classified in (a) into two groups on the basis of absence to pre-jump. Taking the top row of (a) as an example, it shows that, of the 29 scenarios that Researcher 1 classified as Group One, 17 were also classified by Researcher 2 as Group One, 8 were classified as Group Two, 2 as Group Three and 2 as Group Four. Please note that the shaded cells show the number of cases where classification by the two researchers match.
(a) (b)
Note.
PJ: Pre-jump
Preparatory sequences:
① Pre-jump with widening of distance between feet
② Pre-jump with no change in the distance between feet
③ Pre-jump while moving position
④ No Pre-jump
⑤ Approaching the striker
⑥ Shot taken while the goalkeeper is still moving
Preparatory sequences Preparatory sequences Table 1 The results of classifi cation of preparatory sequences by 2 diff erent
researchers. The table shows the results of (a) the classification of preparatory sequences in 57 video clips into 6 groups by 2 diff erent researchers and (b) further classifi cation of the items classifi ed in (a) into 2 groups on the basis of absence to pre-jump. Taking the top row of (a) as an example, it shows that, of the 29 scenarios that Researcher 1 classifi ed as Group One, 17 were also classifi ed by Researcher 2 as Group One, 8 were classifi ed as Group Two, 2 as Group Three and 2 as Group Four. Please note that the shaded cells show the number of cases where classifi cation by the 2 researchers match.
1056
松倉・平嶋A Near C Near A Far B Far C Far χ² test
Observed value (Expected Value) B Near
(120.4)152 67 (44.4) 36
(25.7) 68 (108.0) 61
(82.6) 8 (10.8) TargetOn
TargetOff
(169.6)138 40 (62.6) 26
(36.3) 192 (152.0) 138
(116.4) 18 (15.2)
280 107 62 260 199 26
Total
A Near B Near C Near A Far B Far C Far
4.5 4.7 2.7 -5.9 -3.5 -1.1
TargetOn
TargetOff -4.5 -4.7 -2.7 5.9 3.5 1.1
Residual error after adjustment
*
*
*
*
*
*
*
*
*
*
A Near B Near C Near A Far B Far C Far χ² test (110.5)106 42
(48.7) 30 (26.2) 52
(49.4) 49 (44.3) 6
(5.8) Save
Goal 46
(41.5) 25 (18.3) 6
(9.8) 16 (18.6) 12
(16.7) 2 (2.2)
152 67 36 68 61 8
Total
A Near B Near C Near A Far B Far C Far
-1.0 -2.0 1.5 .8 1.5 .1
1.0 2.0 -1.5 -.8 -1.5 -.1
*
* Save
Goal
df=5 χ²=77.0
P<.05 Cramer's V =.29
df=5 χ²=8.41
P>.05 Cramer's V =.15 Shots area
Shots area
Table2-1. Results of shots from each of the defined areas.
Excluding shots blocked by the approach of a player other than the goalkeeper, the results of 944 shots taken from each of the six defined areas were classified as either ‘on target’ or ‘off target’ . The top table shows the observed (and expected) values.
The bottom table shows residual error after adjustment.
Residual error after adjustment
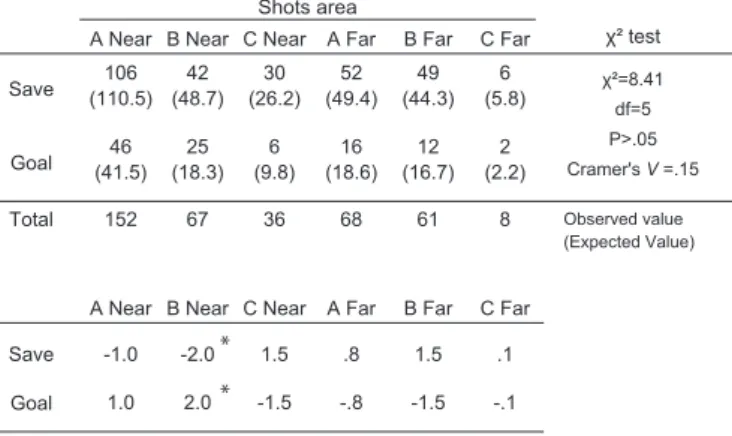
Table2-2. The results of on-target shots from the defined areas. The results of on-target 392 shots from each of the six defined areas were classified as either saved by the goalkeeper or resulting in a goal. The top table shows observed (and expected) values and the lower table shows the residual error after adjustment.
Observed value (Expected Value)
* Significant difference
* Significant difference
Table 2-1 Results of shots from each of the defi ned areas. Excluding shots blocked by the approach of a player other than the goalkeeper, the results of 944 shots taken from each of the 6 defi ned areas were classifi ed as either ‘on target’ or ‘off target’ . The top table shows the observed (and expected) values. The bottom table shows residual error after adjustment.
A Near C Near A Far B Far C Far χ² test
Observed value (Expected Value) B Near
(120.4)152 67 (44.4) 36
(25.7) 68 (108.0) 61
(82.6) 8 (10.8) TargetOn
TargetOff
(169.6)138 40 (62.6) 26
(36.3) 192 (152.0) 138
(116.4) 18 (15.2)
280 107 62 260 199 26
Total
A Near B Near C Near A Far B Far C Far
4.5 4.7 2.7 -5.9 -3.5 -1.1
TargetOn
TargetOff -4.5 -4.7 -2.7 5.9 3.5 1.1
Residual error after adjustment
*
*
*
*
*
*
*
*
*
*
A Near B Near C Near A Far B Far C Far χ² test (110.5)106 42
(48.7) 30 (26.2) 52
(49.4) 49 (44.3) 6
(5.8) Save
Goal 46
(41.5) 25 (18.3) 6
(9.8) 16 (18.6) 12
(16.7) 2 (2.2)
152 67 36 68 61 8
Total
A Near B Near C Near A Far B Far C Far
-1.0 -2.0 1.5 .8 1.5 .1
1.0 2.0 -1.5 -.8 -1.5 -.1
*
* Save
Goal
df=5 χ²=77.0
P<.05 Cramer's V =.29
df=5 χ²=8.41
P>.05 Cramer's V =.15 Shots area
Shots area
Table2-1. Results of shots from each of the defined areas.
Excluding shots blocked by the approach of a player other than the goalkeeper, the results of 944 shots taken from each of the six defined areas were classified as either ‘on target’ or ‘off target’ . The top table shows the observed (and expected) values.
The bottom table shows residual error after adjustment.
Residual error after adjustment
Table2-2. The results of on-target shots from the defined areas. The results of on-target 392 shots from each of the six defined areas were classified as either saved by the goalkeeper or resulting in a goal. The top table shows observed (and expected) values and the lower table shows the residual error after adjustment.
Observed value (Expected Value)
* Significant difference
* Significant difference
Table 2-2 The results of on-target shots from the defined areas. The results of on-target 392 shots from each of the 6 defined areas were classified as either saved by the goalkeeper or resulting in a goal. The top table shows observed (and expected) values and the lower table shows the residual error after adjustment.
けるゴールの枠外もしくは,枠内に飛来した数 を示したものである.A Near ,B Nearおよび
C Near
エリアでは,枠内となった割合が有意に高 く,枠外となった割合が有意に低かった.次にTable 2-2
は枠内に飛来したシュートについて,セーブ・ゴールとなった数を示したものである.A
Near ,B Near
においては,ゴールの数が期待値を上回っていた.そこで,本文においては,以後 この枠内に飛来したシュートのうち,ゴールの数 が期待値を上回っていた
A Near
およびB Near
エ リアを「危険エリア」とし,それ以外のエリアを「危険エリア外」とした.
Table 3-1
ならびに3-2
は危険エリア397
本(a)と,危険エリア外
547
本(b)のシュートに至る1 touch 2 touch χ² test more (175.4)160 59
(43.6) (142.6)158 20
(35.4) 318 79 Total
-3.9 3.9 TargetOn
TargetOff 3.9 -3.9
*
* TargetOn
TargetOff
*
*
Observed value (Expected value) (63.6)53 120
(109.4) (137.4)148 226
(236.6) 201 346
-2.0 2.0
2.0 -2.0
*
*
*
* df=1
χ²=15.2 P<.05 φ =.15
df=1 χ²=4.06
P<.05 φ =.15 Danger zone (397 shots)
Table3-1. The results of shots after different numbers of touches.
The results of shots defined by the number of touches made by the striker before shooting were classified as either ‘on target’ or
‘off target’ . Section (a) presents the results of shots from inside the danger zone and section (b) the results of shots from outside the danger zone. The top table shows observed (and expected) values, and the bottom table shows residual error after adjustment.
Outside Danger zone (547 shots)
Residual error after adjustment
(108.1)109 39 (39.9) (51.9)51 20
(19.1) 160 59 Total
.3 -.3
-.3 .3
Save
Goal
(42.0)34 103 (95.0) (11.0)19 17
(25.0) 53 120
-3.2 3.2 3.2 -3.2
*
*
*
* df=1
χ²=.08 P>.05 φ =.02
df=1 χ²=10.5
P<.05 φ =.25
Save Goal
Danger zone (219 shots) Outside Danger zone (173 shots)
Observed value (Expected value)
Residual error after adjustment
Table3-2. Results of on-target shots after different numbers of touches. The results of on-target shots defined by the number of touches by the striker ahead of the shot were classified as either saved by the goalkeeper or resulting in a goal. Section (a) presents the results of shots from inside the danger zone and section (b) the results of shots from outside the danger zone Area. The higher table shows observed (and expected) values, and the lower table shows residual error after adjustment.
values, and the bottom table shows residual error after adjustment.
1 touch 2 touch χ² test more
1 touch 2 touch more 1 touch 2 touch more
1 touch 2 touch χ² test
more 1 touch 2 touch χ² test
more
1 touch 2 touch more 1 touch 2 touch more
* Significant difference
* Significant difference
(a) (b)
(a) (b)
Table 3-1 The results of shots after different numbers of touches. The results of shots defi ned by the number of touches made by the striker before shooting were classifi ed as either ‘on target’ or ‘off target’ . Section (a) presents the results of shots from inside the danger zone and section (b) the results of shots from outside the danger zone. The top table shows observed (and expected) values, and the bottom table shows residual error after adjustment.
1 touch 2 touch χ² test more (175.4)160 59
(43.6) (142.6)158 20
(35.4) 318 79 Total
-3.9 3.9 TargetOn
TargetOff 3.9 -3.9
*
* TargetOn
TargetOff
*
*
Observed value (Expected value) (63.6)53 120
(109.4) (137.4)148 226
(236.6) 201 346
-2.0 2.0
2.0 -2.0
*
*
*
* df=1
χ²=15.2 P<.05 φ =.15
df=1 χ²=4.06
P<.05 φ =.15 Danger zone (397 shots)
Table3-1. The results of shots after different numbers of touches.
The results of shots defined by the number of touches made by the striker before shooting were classified as either ‘on target’ or
‘off target’ . Section (a) presents the results of shots from inside the danger zone and section (b) the results of shots from outside the danger zone. The top table shows observed (and expected) values, and the bottom table shows residual error after adjustment.
Outside Danger zone (547 shots)
Residual error after adjustment
(108.1)109 39 (39.9) (51.9)51 20
(19.1) 160 59 Total
.3 -.3
-.3 .3
Save
Goal
(42.0)34 103 (95.0) (11.0)19 17
(25.0) 53 120
-3.2 3.2 3.2 -3.2
*
*
*
* df=1
χ²=.08 P>.05 φ =.02
df=1 χ²=10.5
P<.05 φ =.25
Save Goal
Danger zone (219 shots) Outside Danger zone (173 shots)
Observed value (Expected value)
Residual error after adjustment
Table3-2. Results of on-target shots after different numbers of touches. The results of on-target shots defined by the number of touches by the striker ahead of the shot were classified as either saved by the goalkeeper or resulting in a goal. Section (a) presents the results of shots from inside the danger zone and section (b) the results of shots from outside the danger zone Area. The higher table shows observed (and expected) values, and the lower table shows residual error after adjustment.
values, and the bottom table shows residual error after adjustment.
1 touch 2 touch χ² test more
1 touch 2 touch more 1 touch 2 touch more
1 touch 2 touch χ² test
more 1 touch 2 touch χ² test
more
1 touch 2 touch more 1 touch 2 touch more
* Significant difference
* Significant difference
(a) (b)
(a) (b)
Table 3-2 Results of on-target shots after diff erent numbers of touches. The results of on-target shots defi ned by the number of touches by the striker ahead of the shot were classifi ed as either saved by the goalkeeper or resulting in a goal. Section (a) presents the results of shots from inside the danger zone and section (b) the results of shots from outside the danger zone area. The higher table shows observed (and expected) values, and the lower table shows residual error after adjustment. values, and the bottom table shows residual error after adjustment.
1058
松倉・平嶋 までのタッチ数の違いに伴うシュート結果の違い を示したものである.Table 3-1は,タッチ数の違 いに伴い,シュートがゴールの枠内もしくは,枠 外に飛来した数を示したものである.両エリアと も,1
タッチシュートは枠外の割合が有意に高く,枠内の割合が有意に低かった.一方,2タッチ以 上シュートは,枠外となった割合が有意に低く,
枠内の割合が有意に髙かった.次に
Table 3-2
は 枠内に飛来したシュートについて,セーブ・ゴー ル数を示したものである.危険エリアにおいては,タッチ数による有意な差はみられなかった.また,
危険エリア外では,1タッチシュートはゴールと なった割合が有意に高く,セーブの割合が低かっ た.一方,2タッチ以上のシュートは,ゴールと なった割合が有意に低く,セーブの割合が有意に 髙かった.
3. シュートシーン別のゴールキーパーにおける 事前動作の特徴
Table 4(a)は GK
の事前動作における分析対象である全
385
本のシュート,(b)は全385
本の うち危険エリアから放たれたシュート219
本,(c)は危険エリア外から放たれたシュート
166
本,そ れぞれに対する各事前動作の出現数を示したもの である. 全シュート385
本に対しては,「①足幅 を拡げる準備動作」が他の事前動作よりも有意に 出現数が多く,つづいて「②足幅が変わらない準 備動作」,「③移動しながら準備動作」,「④準備動 作なし」の出現数が有意な差が無く続いた.②は「⑤シュート選手へアプローチ」,「⑥移動継続中 にシュート」よりも有意に出現数が多く,③,④ は⑥よりも有意に出現数が多かった.次に危険エ リア内から放たれたシュート
219
本に対しては,①が③以外の事前動作よりも有意に出現数が多か った. また,②―⑥の事前動作の間に有意な差は みられなかった.最後に 危険エリア外から放たれ
Pre.S O.V. More vs.
①
②
③
④
⑤
⑥ 131
86 56 54 34 24 385
②―⑥
⑤,⑥
⑥
⑥
Pre.S O.V. More vs.
①
②
③
④
⑤
⑥ 66 32 42 32 27 20 219
②,④―⑥
Pre.S More vs.
①
②
③
④
⑤
⑥ 65 54 14 22 7 4 166
③―⑥
③―⑥
⑥
(a) (b) (c)
Total Total Total
O.V.
Note.
Pre.S: Preparatory sequences, O.V.: Observed Value, More vs:
significantly more frequent than others, Preparatory sequences:
① Pre-jump with widening of distance between feet
② Pre-jump with no change in the distance between feet
③ Pre-jump while moving position
④ No Pre-jump
⑤ Approaching the striker
⑥ Shot taken while the goalkeeper is still moving
Table4. Number of occurrences of different anticipatory actions.
The preparatory sequences of goalkeepers against on-target shots were classified into six groups. Section (a) presents the results of shots from all positions, (b) the results of shots from inside the danger zone and (c) the results of shots taken from outside the danger zone. The preparatory sequences that are significantly more frequent than others are shown in the right-hand column.
All position Danger zone Outside Danger zone Table 4 Number of occurrences of diff erent anticipatory actions. The preparatory
sequences of goalkeepers against on-target shots were classifi ed into 6 groups. Section (a) presents the results of shots from all positions, (b) the results of shots from inside the danger zone and (c) the results of shots taken from outside the danger zone. The preparatory sequences that are signifi cantly more frequent than others are shown in the right- hand column.
① ③ ④ ⑤ ⑥ χ² test
Observed value (Expected value)
② (48.2)40 28
(23.4) 38 (30.7) 23
(23.4) 12 (19.7) 19
(14.6) touch1
(17.8)26 4
(8.6) 4
(11.3) 9 (8.6) 15
(7.3) 1
(5.4)
66 32 42 32 27 20
Total
① ② ③ ④ ⑤ ⑥
-2.7 2.0 2.8 -.2 -3.6 2.3
2.7 -2.0 -2.8 .2 3.6 -2.3
Residual error after adjustment
*
*
*
*
*
*
*
*
*
*
df=5 χ²=31.2
P<.05 Cramer's V =.38
① ③ ④ ⑤ ⑥ χ² test
Observed value (Expected value)
② (20.4)15 16
(16.9) 7 (4.4) 10
(6.9) 1
(2.2) 3
(1.3) (44.6)50 38
(37.1) 7 (9.6) 12
(15.1) 6
(4.8) 1
(2.7)
65 54 14 22 7 4
Total
① ② ③ ④ ⑤ ⑥
-1.8 -.3 1.6 1.5 -1.0 1.9
1.8 .3 -1.6 -1.5 1.0 -1.9
Residual error after adjustment
df=5 χ²=10.9
P>.05 Cramer's V =.26 Preparatory sequences
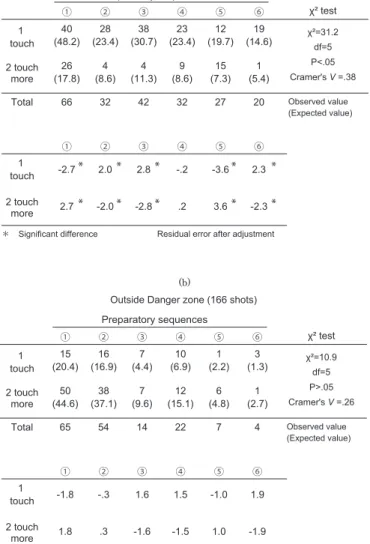
Table5 . Number of different preparatory sequences against shots after different numbers of touches. Preparatory sequences by goalkeepers in response to the number of touches ahead of the shot were classified into six groups. Section (a) presents the results for shots from inside the danger zone and section (b) the results of shots from outside the danger zone. The top table shows observed and (expected) values and the bottom table shows residual error after adjustment.
Preparatory sequences (a) Danger zone (219 shots)
(b)
Outside Danger zone (166 shots) 2 touch
more
touch1
2 touch more
touch1
2 touch more touch1
2 touch more
Note.
Preparatory sequences:
① Pre-jump with widening of distance between feet
② Pre-jump with no change in the distance between feet
③ Pre-jump while moving position
④ No Pre-jump
⑤ Approaching the striker
⑥ Shot taken while the goalkeeper is still moving
* Significant difference
* Significant difference
Table 5 Number of diff erent preparatory sequences against shots after diff erent numbers of touches. Preparatory sequences by goalkeepers in response to the number of touches ahead of the shot were classifi ed into 6 groups.
Section (a) presents the results for shots from inside the danger zone and section (b) the results of shots from outside the danger zone. The top table shows observed and (expected) values and the bottom table shows residual error after adjustment.
1060
松倉・平嶋① ③ ④ ⑤ ⑥ χ² test
Observed Value (Expected Value)
② (44.6)50 22
(21.6) 30 (28.4) 20
(21.6) 15 (18.2) 11
(13.5) Save
Goal 16
(21.4) 10 (10.4) 12
(13.6) 12 (10.4) 12
(8.8) 9
(6.5)
66 32 42 32 27 20
Total
① ② ③ ④ ⑤ ⑥
1.7 .2 .6 -.7 -1.4 -1.3
Save
Goal -1.7 -.2 -.6 .7 1.4 1.3
Residual error after adjustment
df=5 χ²=5.92
P>.05 Cramer's V =.16 Preparatory sequences
① ③ ④ ⑤ ⑥ χ² test
Observed Value (Expected Value)
② (50.9)51 46
(42.3) 9 (11.0) 17
(17.2) 7
(5.5) 0
(3.1) (14.1)14 8
(11.7) 5
(3.0) 5
(4.8) 0
(1.5) 4
(.9)
65 54 14 22 7 4
Total
① ② ③ ④ ⑤ ⑥
0 1.5 -1.3 -.1 1.4 -3.8
0 -1.5 1.3 .1 -1.4 3.8
Residual error after adjustment
df=5 χ²=19.5
P<.05 Cramer's V =.34 Save
Goal
Save Goal
*
*
Table6 . Results of shots according to the type of preparatory sequences taken against it. The results of on-target shots, associated with the six types of preparatory sequences taken by goalkeepers, were classified as either ‘save’ or ‘goal’ . Section (a) presents the results of shots from inside the danger zone and section (b) the results of shots from outside the danger zone. The top table shows observed (and expected) values and the bottom table shows residual error after adjustment.
* Significant difference
* Significant difference
(a) Danger zone (219 shots)
Preparatory sequences (b)
Outside Danger zone (166 shots)
Note.
Preparatory sequences:
① Pre-jump with widening of distance between feet
② Pre-jump with no change in the distance between feet
③ Pre-jump while moving position
④ No Pre-jump
⑤ Approaching the striker
⑥ Shot taken while the goalkeeper is still moving
Table 6 Results of shots according to the type of preparatory sequences taken against it. The results of on-target shots, associated with the 6 types of preparatory sequences taken by goalkeepers, were classifi ed as either
‘save’ or ‘goal’ . Section (a) presents the results of shots from inside the danger zone and section (b) the results of shots from outside the danger zone. The top table shows observed (and expected) values and the bottom table shows residual error after adjustment.
preparatory sequences did or did not involve specific pre-jump.
The goalkeepers’ preparatory sequences(from the six categories) to defend on-target shots were divided into two groups according to whether they did or did not involve pre-jump. The results of shots defended with actions from these two groups were then classified as either ’ save’ or ‘goal’ . Section (a) presents the results of shots from inside the danger zone and section (b) the results of shots from outside the danger zone. The top table shows observed (and expected) values and the bottom table shows residual error after adjustment.
(a)
Danger zone (219 shots)
(①―③)PJ No PJ (④―⑥) (94.6)102 46
(53.4) (45.4)38 33
(25.6) Goal
Save
χ² test
Observed value (Expected value)
df=1 χ²=4.93
P<.05 φ =.15
2.2 -2.2
-2.2 2.2
Save Goal
*
*
*
* (①―③)PJ No PJ
(④―⑥)
Residual error after adjustment
* Significant difference
(b)
Outside Danger zone (166 shots)
(104.2)106 24 (25.8)
(28.8)27 9
(7.2) Goal
Save
Observed value (Expected value)
df=1 χ²=.76
P>.05 φ =.07
.9 -.9
-.9 .9
Save Goal
(①―③)PJ No PJ
(④―⑥) χ² test
(①―③)PJ No PJ (④―⑥)
Residual error after adjustment
* Significant difference
Note.
PJ: Pre-jump
Preparatory sequences:
① Pre-jump with widening of distance between feet
② Pre-jump with no change in the distance between feet
③ Pre-jump while moving position
④ No Pre-jump
⑤ Approaching the striker
⑥ Shot taken while the goalkeeper is still moving
Group Group
Table 7 Result of shots according to whether the relevant preparatory sequences did or did not involve specific pre-jump. The goalkeepers’ preparatory sequences(from the 6 categories) to defend on-target shots were divided into 2 groups according to whether they did or did not involve pre-jump. The results of shots defended with actions from these 2 groups were then classifi ed as either ’ save’ or ‘goal’ . Section (a) presents the results of shots from inside the danger zone and section (b) the results of shots from outside the danger zone. The top table shows observed (and expected) values and the bottom table shows residual error after adjustment.
たシュート
166
本に対しては,①と②の出現数に 有意な差はみられず,それぞれ③―⑥の事前動作 よりも有意に出現数が多かった.さらに,④は⑥ よりも有意に出現数が多かった.このように全体 を通しては, ①が多くみられ,つづいて②が多く みられたように,移動を完了した上で,事前動作 を実施しシュートに対応するケースが多くみられ た.しかし危険エリアにおいては,移動を継続し ながら事前動作を実施する③のケースの出現が多 くみられた.さらに
Table 5
は危険エリア(a),危険エリア外(b)から放たれた,シュートに至るタッチ数 の異なるシュートに対する,各事前動作の出現数 を示したものである.危険エリアにおいては,「② 足幅が変わらない準備動作」,「③移動しながら準 備動作」,「⑥移動継続中にシュート」といった事 前動作の出現割合が,1タッチシュート時に有意 に高く,2タッチ以上シュート時に有意に低かっ た.一方,「①足幅を拡げる準備動作」,「⑤シュ ート選手へアプローチ」といった事前動作の出現 割合が,1タッチのシュート時に有意に低く,2 タッチ以上のシュート時に有意に高かった.また,
1062
松倉・平嶋 危険エリア外では,タッチ数の違いによって,特 定の事前動作の出現割合が有意に大きくなること はなかった.このように危険エリアにおいては,シュートに至るタッチ数に応じて,GKが異なる 事前動作を用いて対応していたことが示された.
4. 事前動作別シュート結果
Table 6
は,危険エリア(a),危険エリア外(b)から放たれたシュートに対する,事前動作ごとの セーブ・ゴール数を示したものである.危険エリ アにおいては,特定の事前動作とセーブ・ゴール 数に関係はみられなかった.また,危険エリア外 では,「⑥移動継続中にシュート」の際にゴール となった割合が有意に髙かった.なお,1タッチ シュートならびに,2タッチシュートごとに分類 して,比較した場合は有意な差はみられなかった.
table 7
は,危険エリア(a),危険エリア外(b)から放たれたシュートに対する,準備動作の有無 に応じて分類した事前動作ごとのセーブ・ゴール 数を示したものである.危険エリアにおいては,
準備動作を実施した場合(①②③の事前動作の実 施時)にセーブの割合が,また実施していない場 合(④⑤⑥の事前動作の実施時)にゴールとなっ た割合が有意に高かった.危険エリア外において は,準備動作の有無とセーブ・ゴール数には関係 がみられなかった.
Ⅳ 考 察
本研究では
2018
年に行われたFIFA
ワールド カップロシア大会の全64
試合を分析対象とし た.これは現在における最高峰のレベルのゲー ムを分析したと考えられる.JFAテクニカルスタ ディグループ(2018a)によると,「2018FIFAワ ールドカップのグループステージ48
ゲームにお いて,1得点を挙げるのに要した枠内シュートの 平均本数は,勝利チームが2.5
本,敗退チームが4.0
本」と報告している.この結果から,1本な いし2
本の枠内シュートを,GKが止めることが 出来るか否かは,大会を勝ち進んでいく上で,大 きな意味を持つと考えられる.1. データの客観性と特徴
本研究では測定対象となる変数がカテゴリー変 数であったため,2名の測定者間におけるκ係 数を算出した.これまで
GK
のゲームパフォーマ ンス分析を行った研究(沼津ほか,2017)におい て,準備動作の有無についてのκ
係数が0.86
で あったことが報告されている.本研究においても 分類した7
項目を準備動作の有無について2
つに 分けた場合のκ係数は 0.73
と実質的な一致(Landisand Koch, 1977)であったと考えられるため,準
備動作の有無についての評価は測定者間で大きな 違いは生じないといえる.一方,本研究では準備 動作の有無だけではなく,その動作の特徴につい て6
項目に分類を行った.その際のκ
係数は0.42
と,中程度の一致(Landis and Koch, 1977)であ ったと考えられる.2人の評価を見ると,「①足 幅を拡げる準備動作」と「②足幅が変わらない準 備動作」の評価について,お互いに評価が分か れるケースが多かった(36ケース中11
ケース≒31%,Table 1).これらの足幅が拡がっていたか
否かの評価が一致しなかった要因として,高速で 実施される動作をテレビ放映されたシーンから分 析することがあげられる.記述の通り,映像の角 度やGK
が映る大きさによっては,足幅が拡がっ ているのか否かの区別が難しかったと思われる.したがって
GK
の動作についてテレビ映像からの 分析によって評価することの限界は生じることが 示唆される.2. トップレベルのゲームにおけるシュートの特 徴
シュート結果に対して,シュートエリアやシュ ートに至るタッチ数がどのように影響していたの かをみる.本分析において危険エリア内において 放たれた
1
タッチシュートは,2タッチ以上シュ ートと比較して,総数が約4
倍,そのうち枠内に 飛来したシュートは約3
倍多かった(Table 3-1).一方,危険エリア外において放たれた