http://www.sciencepub.net/academia [email protected] 90
Factors Influencing the Use of Fertilizer in Arable Crop Production Among Smallholder Farmers In Owerri Agricultural Zone of Imo
State
1Amanze Blessing, 2Eze Christopher Chiedozie and 3Eze Victoria
1Department of Agricultural Economics, Extension and Rural Development Evan Enwerem University, Owerri, PMB 2000, Imo State , Nigeria . +2348035699643
2Department of Agricultural Economics, Federal University of Technology Owerri, P.M.B 1526 Owerri , Imo State, Nigeria . +2348033807761
3Imo State Ministry of Agriculture and Natural Resources, Owerri, Imo State, Nigeria. +2348033782588 [email protected], [email protected], [email protected]
Abstract: The study evaluated the factors influencing the use of fertilizer in arable crop production among smallholder farmers in Owerri Agricultural Zone of Imo State. The objectives determined factors influencing the use of fertilizer in arable crop production among smallholder farmers, and determined socio-economic characteristics of smallholder arable crop production farmers in the study area. A multistage random sampling technique was adopted in selecting six Local Government Areas (LGAs), two community from each selected LGA, two villages from each selected communities and five farmers from each selected village. Data were collected with the aid of a well-structured questionnaire from one hundred and twelve farmers. Data were analyzed using frequency distribution, and logistic regression analysis. Results of the analysis showed that output of crop, level of education, farm size and price of fertilizer were important factors influencing farmers’ use of fertilizer in arable crop production while gender, age and household size were not. The result further showed that the average age of the farmers were 54.3years, 52.7% of them were males. The farmers spent about 8.5years in school and 20.6 years was their average farming experience. They have an average farm size of 1.3ha and household size of 7persons. The number of extension contact per month was twice. [Academia Arena 2010;2(6):90-96]. (ISSN 1553-992X).
Key words: Fertilizer use, arable crops , smallholder farmers, Nigeria
1. Introduction
Agriculture in Nigeria as in most other developing countries is dominated by smallscale farm producers (Oladeebo, 2004). Smallholder farmers constitute about 80% of the farming population in Nigeria (Awoke and Okorji, 2004). These smallholder farmers although individually look insignificant but collectively form an important foundation upon which the Nigerian agriculture rests.
Smallholder farmers are farmers whose production capacity falls between 0.1 and 4.99 hectares holding (Federal Office of Statistics, 1999). According to Awoke and Okorji (2004), smallholder farmers are those farmers who produce on small scale, not involved in commercial agriculture but produce on subsistence level, and cultivate less than five hectares of land annually on the average. A smallholder farmer has among his objectives satisfying household food needs and a little surplus for the market. The smallholder farmers in Owerri agricultural zone are mostly arable crop producers. Production of arable crops in the zone by smallholder farmers is achieved through two main intercrops namely yam, maize, cassava, egusi (melon) intercrop and cassava, maize, egusi (melon) intercrop (Imo ADP, 2000).
One major problem facing agriculture in Nigeria today is that the fertility status of most Nigerian soils is generally low and the problem is how to improve the fertility and hence the productivity of the soil for increased agricultural production (Azagaku and Anzaku 2002). It is only through the use of inputs as soil amendments in the form of mineral fertilizer or organic manure that the productivity of the soil can be improved. Therefore it is necessary to determine the factors influencing the use of fertilizer in arable crop production among smallholder farmers in Owerri Agricultural Zone of Imo State. This study estimated the determinants of fertilizer use in arable crop production among smallholder farmers and determined the socio- economic characteristics of smallholder arable crop production farmers in the study area.
2. Materials and Methods
This study was carried out in Owerri Agricultural Zone of Imo State. Imo State is located in the southeast Zone of Nigeria and lies between latitude 50 10I N and 60 35I N and longitude 60 35I E and 70 28I E (Ministry of lands Survey and Urban planning Owerri, 1992). Owerri Agricultural Zone is
http://www.sciencepub.net/academia [email protected] 91 one of the three Agricultural Zones in Imo State. It is
located at the southwestern part of Imo State. It is bounded on the East by Abia State, on the west by Anambra and Rivers State, on the North by Isu and Isiala Mbano Local Government Areas of Imo State and on the South by Abia and Rivers States (Imo ADP, 2000). It comprises eleven local Government Areas, namely; Aboh Mbaise, Ahiazu Mbaise, Ezinihitte Mbaise, Ikeduru, Mbaitoli, Ngor-okpuala, Ohaji/Egbema, Oguta, Owerri Municipal, Owerri North and Owerri West. There are two main seasons in the zone –dry and rainy seasons. The annual rainfall is between 2000mm and 2500mm while the mean annual temperature is between 260C – 280C with a relative humidity of about 98% during the wet season (Imo ADP, 1990). The zone is richly endowed with fertile land suitable for the growth of arable crops like yam, cassava, maize, melon, rice, etc. It has other favourable conditions for arable crop production. Arable crops intercrop is the main cropping system practiced in the zone. The farmers in the zone are mainly smallholder farmers (Imo ADP, 2000). All these necessitated the choice of the zone as the study area.
Owerri Agricultural Zone was chosen purposively for the study because of proximity, accessibility and cost, as well as the existence of arable crop farming among the smallholder farmers in the area who use fertilizer in their arable crop production . Multi-stage random sampling technique was adopted in selecting the respondents for the study. Six out of the eleven LGAs (Local Government Areas) were randomly selected. The second stage of the selection involved the random selection of two communities from each of the chosen six LGAs making a total of twelve communities. Another stage involved a random selection of two villages from each of the twelve selected communities making a total of twenty-four (24) villages.
A random selection of five smallholder farmers was done from each village making a total of one hundred and twenty respondents for the study.
These farmers were selected from the list of households who are into smallholder arable crop production in the villages and this list was collected from the village heads and Agricultural Development Programme (ADP) Extension Agents. These Farmers are those that are into Cassava, Maize, Egusi (Melon) intercrop. This is because from the survey carried out, majority of the farmers are into (CME) intercrop in the zone with the reason that there are problems of sourcing for staking sticks, high cost of seed yam and high labour demand in yam production. However,
only 112 of the respondents returned valid and usable data for further analysis in the study.
Data were collected from both primary and secondary sources. Information on the socio- economic status of farmers, cost of inputs, input and output quantities, income from output etc. were collected.
Frequencies, percentages and means were used to achieve the socio-economic characteristics of the respondents while multivariate logistic regression analysis was used to determine the factors influencing the use of fertilizer by the farmers. The logistic regression model which derives its name from the logistic probability function (Gujarati, 1998) expresses the quantitative dependent variable, which in this study is dichotomous both qualitative and quantitative. Therefore, coefficient of multiple determination will not be used in deciding the level of significance rather X2 – Chi squared was used.
(Fox, 1984; Ohajianya et al, 2007).
The model employed in the analysis is specified as follows:
Ln Y = Ln (P/1-P)
Ln (P/1-P) = b0 + b1 X1 + b2 X2 + …… b9 X9 + e Where Y = use of fertilizer and its non-use dummy (use of fertilizer (1) and zero for non-use)
P = Probability of use of fertilizer Ln = Natural logarithm function b0 = Constant
b1 - b9 = Logistic regression coefficients X1 = Output of the farm in naira (N X2 = Gender (male (1) and female( zero)
X3 = Age of the farmer (years) X4 = Level of education (years)
X5 = Number of persons in the household
X6 = Farm size (hectares) X7 = Farming experience (years) X8 = Extn contact (No of visits per mth)
X9 = Price of fertilizer (N) e = Stochastic error term.
3. Results and Discussion
3.1 Socio-Economic Characteristics of Smallholder Arable Crop Production Farmers The socio-economic characteristics of smallholder arable crop production farmers like age, gender, education, household size, farming experience, farm size, extension contact etc were discussed in this section.
Table 1 shows the percentage age distribution of smallholder arable crop farmers in the study area.
http://www.sciencepub.net/academia [email protected] 92 Table 1: Percentage Age Distribution of Smallholder Arable Crop Production Farmers
Age (years) Frequency Percentage (%)
30 – 39 3 2.7
40 –49 32 28.6
50-59 47 42.0
60-69 23 20.5
70 - 79 7 6.2
Total 112 100
Mean Age = 54.3 Source: Field Data, 2008
The result of the analysis shows that most (73%) of the farmers fell below the age of 60years, while 26.7% of the respondents were aged 60years and above. The mean age of the respondents was 54.3years. This means that the, smallholder arable crop production farmers studied are relatively old.
This goes to buttress the fact that agriculture is seen as an occupation for the aged while the young look for white-coller jobs in the urban areas. Younger
farmers are more adventurous while according to Onuoha and Nnadi (1999), older farmers are so conservative that they treat any new thing with skepticism and indifference. The resultant effect according to Orebiyi, et al (2002) is that, there will be a decrease in agricultural productivity in the long run when the ageing farmers can no longer perform.
Table 2 Indicates the percentage distribution of the respondents according to gender.
Table 2: Percentage Distribution of Farmers by Gender
Gender Frequency Percentage (%)
Male 59 52.7
Female 53 47.3
Total 112 100
Source: Field Data, 2008
Table 2 shows that 52.7% of the respondents were men while 47.3% were women. This suggests that men are more involved in arable crop production farming than women. Since farming is a laborious activity, the finding is in line with the findings of Obasi (2007) who indicated that women are more
involved in the less laborious activities. Orebiyi, et al (2002) also observed that male farmers are expected to have a better and higher productive efficiency than their female counterparts who are more likely to have divided interest and attention because of domestic factors confronting them daily.
Table 3: Percentage Distribution of Respondents by Level of Education No of years at school Frequency Percentage (%)
No formal education 7 6.2
1-6 28 25.0
7.12 44 39.3
13 - 17 33 29.5
Total 112 100
Mean level of education = 8.5 years Source: Field Data, 2008
Table 3 shows that 6.2%, 25%, 39.3% and 29.5% of the farmer had no formal education, spent 1-6years, 7-12years and 13years and above in school respectively. Thus on the average, farmers in the study area spent 8.5years in school, indicating that majority of the respondents attempted at least secondary school education. The need for education
in agriculture cannot be overstressed since the level of education of a farmer not only increases his productivity but also enhances his ability to understand and evaluate new production techniques.
Table 4 shows the percentage distribution of the respondents by household size
http://www.sciencepub.net/academia [email protected] 93 Table 4: Percentage Distribution of Respondents by Household Size
Household size Frequency Percentage (%)
1-5 33 29.5
6-10 72 64.3
11 -15 7 6.2
Total 112 100
Mean Household Size = 7 Source: Field Data, 2008
Table 4 shows that 29.5%, 64.3% and 6.2%
of the respondents have household size of 1-5 persons, 6 -10persons and 11 persons and above respectively. The mean household size stood at approximately 7 persons per household during the
study. Having large household size as in this case is sometimes advantageous because labour may be easy to get (Obinne, 1989).
Table 4.5 shows the percentage distribution of the respondent’s farming experience.
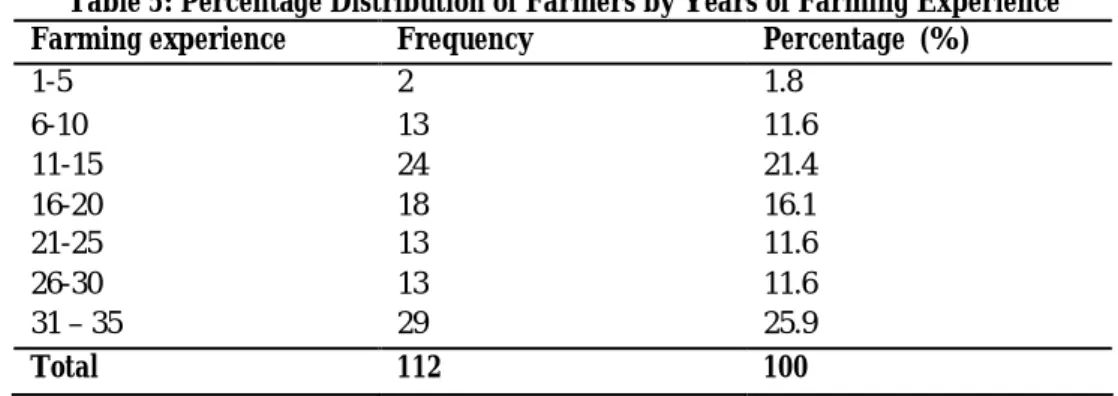
Table 5: Percentage Distribution of Farmers by Years of Farming Experience Farming experience Frequency Percentage (%)
1-5 2 1.8
6-10 13 11.6
11-15 24 21.4
16-20 18 16.1
21-25 13 11.6
26-30 13 11.6
31 – 35 29 25.9
Total 112 100
Mean years of farming experience = 20.6 Source: Field Data, 2008.
Table 5 shows that 1.8%, 11.6%, 21.4% and 16.1% of the respondents had years of farming experience of 1-5years, 6-10years, 11-15years and 16-20years respectively. Also the table shows that 11.6%, 11.6% and 25.9% of the respondents had years of farming experience range of 21-25years, 26- 30years and 31years and above respectively. The mean years of farming experience was 20.6years.
This suggests that the farmers have the necessary experience in arable crop production. The higher the farming experience the more the farmer would have gained more knowledge and technical ideas on how to tackle farm production problems and the higher would be his output and income (Nwaru et al, 2004).
Table 6 shows the percentage distribution of the respondents according to farm size.
Table 6: Percentage Distribution of farmers by farm size
Farm size (Ha) Frequency Percentage (%)
0.1 –0.9 40 35.71
1 – 1.9 47 41.96
2-2.9 21 18.75
3 –3.9 2 1.79
4- 4.9 2 1.79
Total 112 100
Mean farm size = 1.39 Source: Field Data, 2008
Table 6 shows that 35.71%, 41.96%, 18.75%, 1.79% and 1.79% of the respondents have
farm sizes ranging from 0.1-0.9ha, 1-1.9ha, 2-2.9ha, 3-3.9ha, and 4-4.9ha respectively. The mean farm
http://www.sciencepub.net/academia [email protected] 94 size was 1.39hectares. This compares favourably
with the findings of 1.30ha and 1.37ha in Okigwe and Orlu zones of Imo State respectively by Obasi (2007). The implication of this farm size is that as population increases farm size reduces due to partitioning in the inheritance process or due to land reform process. And this invariably will lead to more intensive land use systems. This is so because
population growth forces farmers to shorten fallow periods, increase investment on land, manage soil fertility through the addition of manure etc. (Obasi, 2007).
Table 7 indicates the percentage distribution of the respondents by number of extension contacts visit per month.
Table 7: Percentage Distribution of Respondent by No of Extension Contacts Per Month Extension contact
(No. of visits per month)
Frequency Percentage (%)
0 30 26.8
1 7 6.2
2 75 67
Total 112 100
Mean No of extension contact = 2times per month Source: Field Data, 2008
Table 7 shows that 26.8%, and 67% of the respondents indicated that extension agents visited them not and twice respectively in a month. On the average, extension agents visited the farmers 2times in a month. The 2 times visit in a month certified the conditions for a farmer to adopt innovations. Since according to Onuoha and Nnadi (1999), an extension officer should visit the farmer regularly or fortnightly to know his problems on the innovations transferred
and on other farm activities so as to help him find solutions to them.
3.2 Factors Influencing the Use of Fertilizer Among the Smallholder Farmers in the Study Area.
The results of the estimation of the factors influencing the use of fertilizer are presented in Table 8.
Table 8: Estimates of the Influences of Selected Variables on the Probability of Use of Fertilizer in Arable Crop Production in Owerri Agricultural Zone of Imo State.
Explanatory Variables and Important Statistics Logit Regression Coefficient T-Ratios
Output (x1) 0.0814 3.7685**
Gender (x2) - 0.0829 -1.1627
Age (x3) - 0.0592 -1.4334
Education level (x4) 0.0794 3.8544**
Household size (x5) -0.0603 -1.1732
Farm size (x6) 0.0981 3.1242**
Farming experience (x7) 0.0884 3.8603**
Extension contact (x8) 0.0592 2.8325**
Price of fertilizer (x9) -0.0824 -2.5912**
Constant -22.0691 -6.3576**
Chi-square 72.4936
Sample size 112
** Significant at 1% level Source: Field data, 2008.
To determine the factors influencing the use of fertilizer among the smallholder farmers in the Owerri Agricultural Zone of Imo State, tests were first conducted to check the presence of any multicolinearity between the independent / explanatory variables. Tests revealed no such presence of multicolinearity. Consequently, all the explanatory variables were entered and the equation
fitting the logit regression model was estimated. The variables relating to output of crop (x1), level of education (X4), farm size (x6), farming experience (x7), extension contact (x8) and price of fertilizer (x9) were found to be significant at 1%, implying that these variables are the important factors influencing farmers’ use of fertilizer in arable crop production in the study area.
http://www.sciencepub.net/academia [email protected] 95 The coefficient for gender (X2), age (X3) and
household size (X5) were found not to be significant at the 5% level of significance, indicating that these variables are not important factors influencing farmers’ use of fertilizer in arable crops production in the study area. The coefficient of output of arable crops was positive and significant, implying that increases in the output of arable crops produced with fertilizer would lead to increases in the use of fertilizer in arable crops production. This finding is similar to those of Ohajianya et al, (2007) in their study on comparative analysis of organic and inorganic fertilizer use in cassava production in Imo State. The coefficient of level of education was positive and significant, suggesting that farmers with higher education use fertilizer more than farmers with low education. This could be attributed to the fact that higher education enables the farmer to know the benefits of the use of improved inputs such as fertilizer in crop production. This result is similar to those of Cooke (1982) and Asomonye (1991). The coefficient of farm size was positive and significant, indicating that farmers with larger farm size use more fertilizer than farmers with small farm size. The coefficient of farming experience was positive and significant, indicating that the more experienced farmers use more fertilizers in crops production.
Coefficient of extension contact was positive and significant, implying that farmers who are in contact with extension agents use more fertilizer than farmers that do not have extension contacts. The coefficient of fertilizer price was negative and significant, implying that farmers use more fertilizer when the price is low than when its price is high. It also means that the farmers respond positively to the dynamics of the market forces.
The findings on farm size and extension contact disagreed with the finding of Ohajianya et al (2007) but are similar with those of Likita (2005) and Dittoh (1991), while the results on farming experience and price of fertilizer are similar with those of Ohajianya et al, (2007), and Udoh and Akintola (2001).
4. Conclusion and Recommendations
The result of the study indicated that output of crop, level of education, farm size, farming experience, extension contact and price of fertilizer were important factors influencing farmers use of fertilizer in arable crop production in the study area.
Extension work and training of staff should be given a pride of place by the different arable crop production implementing agencies. The level of arable crops output will increase tremendously if the extension workers are active in their routine farm visits, interpretation and demonstration of research
findings. With adequate training, they are better armed with facts and more current on details of new findings that will help improve their farm output.
Correspondence to:
Amanze Blessing
Department of Agricultural Economics, Extension and Rural Development Evan Enwerem University,
Owerri, pmb 2000, Imo State , Nigeria . [email protected],+2348035699643 References
[1] Asomonye, D.E. Access and use of Selected Farm Inputs; Fertilizer, Improved Cassava cuttings and Poultry Breed by Farmers in Imo State.1991; B. Agric Tech Project, Federal University of Technology Owerri.
[2] Awoke M. U. and C. Okorji The Determination and Analysis of Constraints in Resource Use Efficiency in Multiple Cropping Systems by Small-holder Farmers in Ebonyi State, Nigeria. Africa Development.2004;
Vol. xxix, No. 3 August 2004, Pp. 58-69.
[3] Azagaku, E. D. and H. Anzaku Effect of NPK Fertilizer Levels on the Growth and Development of early Maturing Maize Cultivar (TZESR –W) . In M. Iloeje, G. Osuji, Udoh H. and G Asumugha (eds).
Agriculture: A Basis for Poverty Eradication and Conflict Resolution. Proceedings of the 36th Annual Conference of the Agricultural Society of Nigeria Held at the Federal University of Technology Owerri, Nigeria, 20- 24 October 2002, PP.106-111.
[4] Cooke, G.W. Fertilizing for Maximum Yield”.
1982; 3rd Edition, Granada Publishing Ltd, London, PP. 417-418.
[5] Dittoh, S. (1991). Efficiency in Agricultural Production in Small and Medium Scale Irrigation in Nigeria. In Dos S, and Olson C ed. Issues in African Rural Development.
1991; Vol.11, Winrock International, PP. 152- 174.
[6] Federal Office of Statistics (FOS), Poverty and Agricultural Sector In Nigeria, Poverty incidence of Farmers by Region. FOS. . 1999 Lagos Pp. 22-23.
[7] Imo State Agricultural Development Programme (ADP), Work Programme. Imo ADP. 1990. Owerri , Imo State.
[8] Imo State Agricultural Development Programme (ADP), An Assessment Study of the Performance of the National Agricultural Technology Support Project in Imo State with focus on Farmers Adoption of Technologies
http://www.sciencepub.net/academia [email protected] 96 and their Socio-economic Improvements.
2000; Cochita Nig Ltd Owerri. February.
[9] Likita, T. Technical Efficiency in Arable Crop Production In Kebbi State Nigeria” Journal of Agriculture and Food Science.2005; Vol. 3, No. 2 , Pp. 165-174.
[10] Ministry of Lands Survey and Urban Planning Owerri, Area of Imo State by Local Government Area. 1992; Owerri Imo State [11] Nwaru J.C., C.E. Onyenweaku, E.C. Nwagbo
and A. C. Nwosu .Determinant of Rural Farm Loan Repayment: Implication for Rural Credit Markets Development in Imo State, Nigeria.
Journal of Agriculture and Food Sciences.
2004; Vol. 2, No. 1, pp. 57 – 67.
[12] Obasi, P.C. Farm Size Productivity Relationship Among Arable Crops Farmers’ In Imo State, Nigeria”. International Journal of Agriculture and Rural Development.2007 ; Vol.9, PP.91-99.
[13] Obinne C.P.“Communication and Adoption of Improved Cassava Production Technologies Among Small Scale Farmers in Bendel State.
1989; Ph.D. Thesis, Department of Agricultural Extension, University of Nigeria Nsukka.
[14] Ohajianya D. O., V. A. Enwerem, J. A.
Echetama and F. C. Anaeto. Comparative Analysis of Organic and Inorganic Fertilizer Use in Cassava Production in Imo State.
International Journal of Agriculture and Rural Development.2007; Vol. 9, Pp. 30-34.
[15] Oladeebo, J. O. Resource-Use Efficiency of Small and Large Scale Farmer in South Western Nigeria: Implication For Food Security”. International Journal of Food And Agricultural Research. 2004; Vol. 1, No. 12, Pp 227-235.
[16] Onuoha E.R and F.N Nnadi , Fundamentals of Agricultural Extension and Rural Sociology.
1999; Sibon Books LTD. Ibadan, Nigeria.
[17] Orebiyi, J.S, N.G. Ben-Chedo and S.N.
Odurukwe . Financing of Swine Production in Owerri Agricultural Zone of Imo State, Nigeria. In Iloeje, M.,G. Osuji,Udoh Herbert and G. Asumugha (eds). Agriculture: A Basis for Poverty Eradication and Conflict Resolution. Proceedings of the 36th Annual Conference of the Agricultural Society of Nigeria Held at the Federal University of Technology Owerri, Nigeria, 20-24 October 2002, PP.385-387.
[18] Udoh E.J and J.O Akintola Land Management and Resource use Efficiency Among Farmers in South Eastern Nigeria.
Award Winning Paper Presented to the African Real Estate Society and the Rics Foundation, 2001 ; Elshaddai Global Ventures Ltd, PP.20-32.
.
4/25/2010, reversed 5/10/2010