J Pack. Sci. TechnoL Vol. 2 No. 1 (1993)
A Fast Gas Chromatographic Method for the Separation of Nitrogen, Oxygen, Carbon dioxide and Argon and
Its Application to In-package Modified Atmosphere
Takashi HIRATA*. Takeo NISHIYAMA**, Hiromi SATO*, Yutaka ISHIKAWA*, Takeo SHIINA*** and Takasuke ISHITANI****
A gas chromatographic method was developed for the rapid separation of headspace gases in film-package of fresh produce. A balanced set of three columns simultaneously separated four gases including N
2, O
2, CO
2and Ar. The gas composition was accurately c a l c u l a t e d b y m e a s u r i n g t h e r a t i o o f e a c h p e a k a r e a o n t h e c h r o m a t o g r a m s a n d considering the relative response of a thermal conductivity detector to each gas. This method was found to be useful for the accurate determination of O
2and CO
2in the modified atmosphere, because Ar proved to be kept in film packages of the produce at a c onc ent rat ion ab ove ca . 0 .9 % i n v a ri ou s c a se s whi le Ar ov e rl ap s O
2on th e g a s c h r o ma t o g ra ms i n c onv en t io na l ga s ch r o ma t o g r ap hi c sys t e ms .
Keywords : Argon, Oxygen, Carbon dioxide, Fresh produce, Headspace gas, MA pack- a g i n g , G a s c h r o m a t o g r a p h y , G a s c o m p o s i t i o n
I N T R O D U C T I O N
Modified atmosphere packaging (MAP) has been studied as a technique to prolong the shelf-life of fresh vegetables and fruits1)2} . The technique basically expects self-equilibration of the in-package gas composition, which may provide a suitable atmosphere for controlling excess respiration of the fresh produce during
d i s t r i b u t i o n . S i n c e a v a r i e t y o f t e c h n i c a l information including permeability of films, r e s p i r a t i o n r a t e s i n a g i v e n O
2/ C O
2a t m o s - phere, respiration quotients, free volume of the package, etc. are required for the proper design of MAP, computer aided simulation is o n e o f t h e m o s t p r o m i s i n g t e c h n i q u e s t o o b t a i n s u i ta b l e M A P c o n d i t i o n s 3 ) ~ 8 ) .
F o r a n y M A P d e s i g n , t h e e x a c t d e t e r m i -
* N a t i o n a l F o o d R e s e a r c h I n s t i t u t e , 1 - 2 , k a n n o n d a i - 2 , T s u k u b a , 3 0 5 J a p a n * * O k a y a m a B r a n c h o f K o b e C e n t e r f o r Q u a l i t y C o n t r o l a n d C o n s u m e r S e r v i c e , M i n i s t r y o f A g r i c u l t u r e , F o r e s t r y a n d F i s h e r i e s , 2 4 , T e n j i n c h o - 9 , O k a y a m a , 7 0 0 J a p a n * * * H o k k a i d o N a t i o n a l A g r i c u l t u r a l E x p e r i m e n t a l S t a t i o n , K y u s e n - 4 , S h i n s e i , M e m u r o , K a s a i - g u n , H o k k a i d o , 0 8 2 J a p a n * * * * N a t i o n a l A g r i c u l t u r e R e s e a r c h C e n t e r , 1 - 1 , K a - n n o n d a i - 3 , T s u k u b a , 3 0 5 J a p a n
- 1 5 -
Gas chromatographic evaluation of MA within film packages
nation of the in-package concentrations of N
2, O
2, CO
2and Ar is necessary, because either anaerobic conditions or the presence of excess CO
2results in the development of off-odors, and also the higher concentration of O
2allows for a rapid senescence. Because of the de- mands for the rapid and simultaneous determi- nation of the in-package gas composition in MAP, gas chromatographical methods have been used. Brenner9) described a combination of silica gel and molecular sieve 5A as parallel columns. Karel et al10). used columns packed with silica gel and a molecular sieve that were connected in series. Recently, Yamashita et al11) used a combination of activated charcoal and a molecular sieve as a parallel column system and calculated the gas composition from the ratio of the peak areas. Aerograph A90 - P36) or Alltech CTR I3)12) have been also used for analyzing the gas composition, while even in some recent papers13)15), the gas analysis procedures are not given in detail.
In these columns, Ar is not separated from
O
2and overlaps O
2on gas chromatograms.
However the presence of Ar in MAP should be considered for establishing the MAP system because in many cases the critical levels of 0a for providing proper MA conditions are less than 5%.
The objectives of this paper are to develop a gas chromatographic method for simul- taneously measuring concentrations (%) of O2, N2t CO2 and Ar in MAP, and to evaluate the gas exchange in MAP of fresh produce on the market or during storage using the method developed.
MATERIALS AND METHODS
1. Vegetables and packaging
Locally grown broccoli was purchased at a wholesale market, packaged in plastic films and stored at 15°C and 90%rh. The character- istics of the films used and the packaging conditions are listed in Tables 1.
Fresh vegetables packaged using flexible
/ . P a c k . S c i . T e c h n o l V o l . 2 N o . 1 ( 1 9 9 3 )
plastic materials were purchased at a local supermarket. The packaging materials were as follows : A stretch film of polyvinyl chloride for shiitake fungus (Lentinus edodes Sing.), shimeji fungus (Pluribus ostreatus Quel.) and cucumber, low density polyethylene for mung bean sprout (Vigna radiata Wilcz.), a mix of shredded vegetables including mung bean sprout, cabbage, carrot and black fungus {Auricularia auricula-judae Quel.), and poly- propylene for carrot,
2 . G a s c h r o m a t o g r a p h y
A gas chromatograph (GC - 7A, Shimadzu, Japan) equipped with a thermal conductivity detector (TCD) was used to analyze N
2, O
2, CO
2and Ar in a gas mixture. Carbon dioxide was separated from the mixture by a stainless steel column (3mm × 0.5m) packed with activated charcoal (mesh : 60~80). Oxygen, N
2and Ar were separated by a packed column (3mm × 6m) of Gaskuropack 54, (a styrene /divinyl benzene copolymer, mesh : 60~80), w h i l e C O
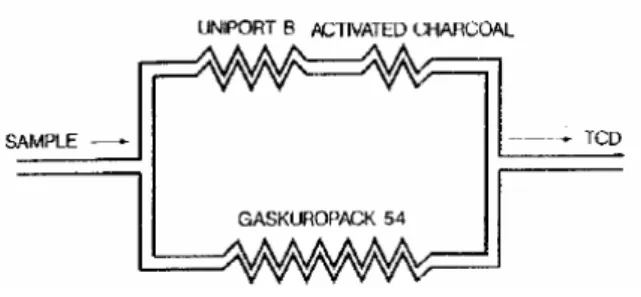
2w a s a b so rbe d in th e p ac k in g material. Both columns were linked in parallel so that simultaneous analysis of the four gases were carried out using a single injection of the gas sample. For controlling the split ratio of the gas flow at a diverging point of the linked column, a packed column (3mm
×4m) of Uniport B (mesh 60~80) was added in series to the activated charcoal column.
The total column system is shown in Fig. 1.
Three meter column of Uniport B was also connected to TCD as a reference column.
While Uniport B and activated charcoal were controlled at 70°C in the column oven, Gas-
Fig. 1 A schematic diagram of the column system simultaneously separating four gases.
kuropack 54 was separately cooled down to -80°C by soaking the column in dry ice- methanol. Temperatures of the TCD and injec- tion port were adjusted to 90°C. The flow rate of the carrier gas (He) was 60ml/min.
Peak a rea s in a gas chro matog ra m we re measured using a Shimadzu C-RIA integrator.
The packing materials for columns were all purchased from GL Science (Tokyo).
3 . G a s a n a l y s i s
About 0.3ml of the headspace gas was periodically sampled from the package and was injected in the gas chromatograph. A small silicone rubber piece (ca.l0mm × 10mm) was glued on the surface of the package so that the gas sampling was easily carried out by direct sticking of a syringe needle into t h e p a c k a g e .
4 . C a l c u l a t i o n o f g a s c o m p o s i t i o n The gas chromatographic profile of a gas mixture including N
2, O
2, CO
2and Ar is sche- matically given in Fig. 2. Peak A to B and Peak C to F indicate the gas portions separat- ed by the columns packed with activated charcoal and Gaskuropack 54, respectively .
- 1 7 -
J . P a c k . S c i . T e c h n o ! . V o l . 2 N o . 1 ( 1 9 9 3 )
RESULTS AND DISCUSSION
1 . G a s c h r o m a t o g r a m s
A clear separation of CO
2from a gas mix- ture including N
2, O
2, CO
2and Ar were performed by a single column (3mm × 0.5m) packed with activated charcoal, while O
2, N
2and Ar were separated from each other on Gaskuropack 54 (3mm×6m) at~80°C (Fig.
3). These single columns made it possible to separate the gases within a short retention time. However, for determining four gases, two measurements were required and thus careful calibration of an absolute amount of the injected gases was very important for having accurate results. Therefore, in order to simultaneously analyze the four gases, the two columns were linked in multiple connec -
tion. But the analysis using the simply linked colu mn syste m p roved to be i mp ractic al because the gas groups (O
2+ N
2+ Ar/CO
2, N
2/ O
2/ A r ) s h o w e d s i g n i f i c a n t l y d i f f e r e n t retention times. It is natural to consider that a difference in the column lengths may cause a pressure imbalance between the insides of the two columns resulting in the different r e t e n t i o n t i me s .
Therefore, Uniport B was connected to main- tain a balance between the retention times.
The gas mixture was analyzed on the system and a typical gas chromatograph of the gas mixture is shown in Fig. 4b. Five different peaks were successfully observed. Each peak was assigned from its retention time as A (a mixture of N
2, O
2and Ar), B (CO
2), C (N
2), D (O
2) or E (Ar). The optimum length of
Fig.3 A gas chromatographical profile of a laboratory atmosphere on a Gaskuropack 54 column.
The atmosphere was analyzed on a single Gaskuropack column (3mm×6m) at -80°C.
Fig.4 Effect of column length oi uniport B on the resolution and retention time of inorganic gas peaks.
Column lengths of Uniport B: (a) 1m, (b) 4m, and (c) 5m. Symbols are the same as those in Fig.2
- 1 9 -
Gas chromatographic evaluation of MA within film packages
R E T E N T I O N T I M E - Fig.2 A schematic chromatogram expressing the complete profile of the inorganic gases including O2. N2, CO2 and Ar.
A : O2+ N2+ A r . B : C O2, C : N2, D : C O2, E : A r , F : C O2
Peak A and B correspond to a mixture of three gases (N
2, O
2and Ar) and CO
2respective- ly, because activated charcoal can not absorb N
2, O
2and Ar at all. Each Peak from C to F corresponds to N
2, O
2, Ar and CO
2, respec- tively. Peak F is provided as a dummy for convenience of calculation because Gaskuro- pack 54 strongly absorbs CO
2and thus no peak can be obtained from CO
2.
If it is assumed that the thermal detector shows the same response to every gas, the gas composition (%) can be expressed as follo ws ;
where C, D, E and F are the areas of Peaks C, D, E and F, respectively.
B e c a u s e b o t h P e a k B / A a n d p e a k F / ( C +D+E) express the ratio of CO
2to a mixture of N
2, O
2and Ar, the area under Peak F is calculated from equation (5),
F =
B
A
( C + D + E )・・・・・・・・・ (5)
where A and B are areas of Peaks A and B, respectively. By substituting equation (5) into equations (1) to (4), the gas compositions given by the volume percentage (%) were obtained. It is not necessary to consider that the split ratio of the gas flow at the diverg- ing point varies because the gas composition is always calculated from the ratio of each peak area (C~F) to the total peak area (C
+ D + E + F ) .
5 . R e l a t i v e r e s p o n s e o f T C D
The relative response of TCD to an inor- ganic gas was independently calibrated by determining the peak area as follows :
An accurate amount (0.5ml) of authentic gases (O
299.99% ;N
2, CO
2, Ar 99.999%) was injected in the column system and total peak areas were calculated by the integrator. The averaged value of five measurements was obtained. After (C +D+E)/A (D +E~0) was calculated from the analysis of the authentic N
2, the peak area of CO
2corresponding to Peak F was calculated by equation (5), and then B+F was considered as the total area o f C O
2.
- 1 8 -
Gas chromatographic evaluation of MA within film packages
Uniport B for separating the gases on the column system was 4m (Fig. 4b). When the column was shorter than 4m, the retention time for N
2, O
2and Ar increased significantly (Fig. 4a). On the other hand, if the column was longer than 4m, CO
2and the gas mixture tended to overlap N
2, O
2and Ar (Fig. 4c).
The advantage of this method is that it may allow one to inject an approximate amount of a gas mixture for determining the gas composition, and a calibration curve using authentic gases is not required.
2 . G a s c o m p o s i t i o n
Several authors15) calculated the gas compo- sition from areas or heights of the peaks using calibration curves of the standard gases.
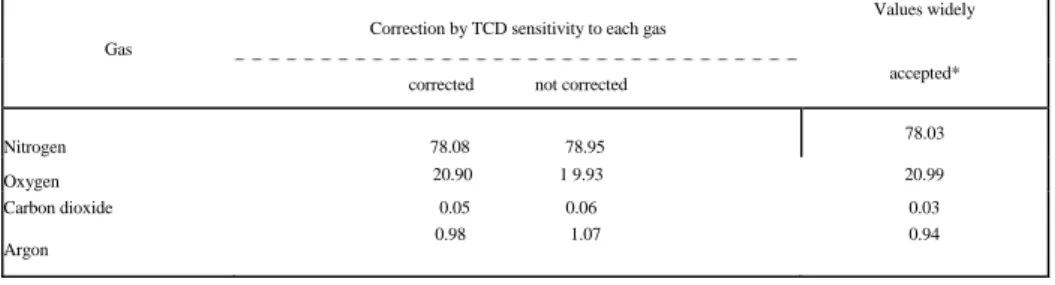
This procedure requires careful injection of an accurate amount of gas sample, and none of them mentions the presence of Ar in the a i r . W h i l e t h e p a r t i a l p r e s s u r e o f e a c h inorganic gas in a MAP system fluctuates drastically, especially during the early stage of storage, the integrated gaseous pressure inside the package is stable and is equal to the air pressure outside the package because
plastic films commonly used for this system are flexible. Therefore, the gas composition inside the package is easily obtained by measuring the ratio of each peak area (C, D, E and F) to the total peak area (C+D+E +F). Table 2 shows the gas composition of the outside atmospheric air calculated from t h e r a t i o o f p e a k a r e a o f t h e g a s c h r o - matogram. The calculation procedure already mentioned did not give a reasonable result for the composition when compared with widely recognized values16). Therefore, the relative responses of TCD to the gases on helium were determined. Table 3 shows the clear differences for the relative responses with small standard deviations among the four gases. A similar result has been reported by Messner et al,17) covering a range of 30°C to 160°C of TCD. When the observed peak areas were divided by the relative response values, and then the gas composition of the air was calculated using equations (1) to (5), the results proved to be highly acceptable
(Table 2), indicating that the discrepancy between the accepted values and the experi mental values obtained this time was mainly
Table 2 The atmospheric gas composition (%) analyzed by gas chromatography.
Correction by TCD sensitivity to each gas
Values widely Gas
corrected not corrected accepted*
Nitrogen 78.08 78.95 78.03
Oxygen 20.90 1 9.93 20.99
Carbon dioxide 0.05 0.06 0.03
Argon 0.98 1.07 0.94
* H u m p h r e y , 1 9 2 6 1 6 )
J. Pack. Sci. TechnoL Vol. 2 No. 1 (1993)
Table 3 Relative responses of TCD to inorganic gases on helium.
Relative response' Gas
Average Standard deviation Ni trogen 100
Oxygen 94.3 0.57
Carbon dioxide 115.9 1.85
Argon 107.0 0.56
*Average of five measurements
due to the gas-dependent response of the TCD.
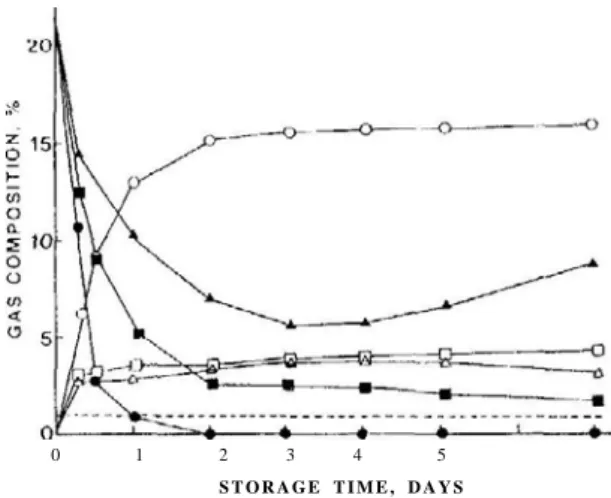
3 . G a s c o m p o s i t i o n w i t h i n M A P Changes in the gas composition in MAP of broccoli are given in Fig, 5. The packaging conditions A and C in Table 1 apply to extreme cases, because these conditions were determined to intensify the changes in either
0 1 2 3 4 5 S T O R A G E T I M E , D A Y S
Fig. 5 Changes in O2, CO2 and Ar in film packages during the storage of broccoli at 15°C.
The packaging conditions are given in Table1.
Condition A (PMP) Condition B (LDPE) Condition C COPP)
O
2or Ar concentration during storage.
When compared with other conditions, the O
2oncentration under Condition A was kept at a higher level even after 7 days. Under Condition B, O
2gradually decreased to become equilibrated at ca. 2% after 48 hour storage at 15°C. In both conditions, color, which is important as the quality determinants of the vegetable, decreased as a function of storage time. Under Condition C, the O
2concentration reached after 48 hour storage, and thereafter the respiration proceeded anaerobically, result- ing in the generation of undesirable off-odors.
But in any condition, Ar was kept in the range of 0.9 to 1.0%. If Ar had overlapped O
2on the chromatograms, the observed con- centrations of O
2, even under Condition C, would have showed almost 1 % O
2during s t o r a g e .
Some researchers have suggested that 2~
5% O
2and 6~10% CO
2are recommended for the storage of broccoli under CA/MA18)19).
Undesirable off- odors were formed from broccoli when the produce was stored under the CA with very low O
2(0.25% or less) at 5°C20). The off-odors were also developed under 1% or less O
2in MAP21). However, in some cases, the off-odors were also developed under relatively high concentrations of O
2(<
0.5-4 %)21) 2 2}.
It seems that these discrepancies in dividing the concentration between aerobic and anaero- b i c r e s p i r a t i o n s a r e d u e i n p a r t t o n o separation of Ar from O
2.
Table 4 shows the gas composition in MAP of several vegetables purchased from a local supermarket. The O
2concentrations were in
- 2 1 -
Gas chromatographic evaluation of MA within film packages
Table 4 Modified atmospheres observed in film packages for fresh produce purchased from a local supermarket.
* Folyvinyl chloride
** Low density polyethylene
""A mix of mung bean sprouts, cabbage, carrot and black fungus.
the range of 5~16%, while the Ar concent- rations were in the range of 0.9 to 1.0%
again. The proper concentrations of O
2and CO
2in MAP were 1~2% and 10~14% for s h i i t a k e f u n g u s a t 1 ℃2 3 ) and 3-6% for tomatoes at 10°C24), respectively. The O
2con- centrations for keeping the quality of cucum- bers were 3-5% at 8°C19). Many other vege tables showed similar values of O
2levels for p rop er packaging . Gene rall y, th e ra te o f respiration sensitively changes below about 8% of O
2and above about 1% of CO
2, while a lo w O
2en ri ch e d wi th C O
2beyo nd th e concentration of tolerance, induced anaerobic r e s p i r a t i o n a n d / o r C O
2i n j u r y 2 ) .
Therefore, the respiration of the vegetables shown in Table 4 was very lightly suppress- ed but anaerobic respiration was not yet proceeded at all. It can be said that if the O
2concentration had been lower, a longer shelf-life for the vegetables would have been obtained. However, if the packaging design of MAP is not based on an accurate evalua-
tion of O
2concentration, a slight change in the storage condition may cause anaerobic respiration because suitable O
2concentrations for the vegetables are 1~6% as previously m e n t i o n e d .
Determination of O
2concentration in MAP has used the packed column with a molecular sieve9) ~ 11)22). However, the residual concentra- tion of O
2may have been overestimated because Ar always overlaps O
2on the gas chromatogram in their systems. Therefore, the individual analysis of O
2and Ar using the system presented herein are important. Alter- natively, because it is noticed that in many cases Ar concentration is kept in the level of 0.9~1.0% as shown in Table 4 and Fig.
4, one percent O
2should be subtracted from the v alues obtained by the conventional c o l u mn s y s t e ms .
In conclusion, the gas chromatographic pro
cedure developed in this paper can be applied
to separate the atmospheric inorganic gases
from each other by a single injection and
/ . P a c k . S c l . T e c h n o l V o l . 2 N o . 1 ( 1 9 9 3 )
determine them accurately. It can be expected that this technique is applicable to design for other packaging systems such as gas replacement packaging and O
2absorber- packaging as a tool for the optimization of these packaging systems.
REFERENCES
1) A. A. Kader, D. Zagory and E. L. Kerbel, Crit.
Rev. Food Sci. Nutr., 28, 10 (1989)
2) D. Zagory and A. A. Kader, Food TechnoL, 9, 70 (1988)
3) D. S. Lee, P. E. Haggar, J. Lee and K. L. Yam, J. Food Sci., 56, 1580 (1991)
4) A. C. Cameron, W. Boylan-Pett and J. Lee, J. Food Sci., 54, 1413 (1989)
5) C. C. Yang and M. S. Chinnan, Trans, the ASAE., 31 (3), 920 (1988)
6) Y. S. Henig and S. G. Gilbert, J. Food Sci., 40, 1 0 3 3
( 1 9 7 5 )
7) K. Hayakawa, Y. S. Henig and S. G. Gilbert, J. Food Sci., 40, 186 (1975)
8) V. Jurin and M. Karel, Food TechnoL, 17 (6), 782 (1963)
9) N. Brenner and E, Ciplinski, Ann. N. Y. Acad.
Sci., 72, Art. 13. 705 (1959)
10) M. Karel, P. Issenberg, L. Ronsivalli and V.
Jurin, Food TechnoL, 3, 91 (1963)
11) 1. Yamasliita, Y. Yamaguchi, T. Fyshimi and S. Aoki, J. Jpn. Soci. Cold Prsserv. Food., 15
(2), 61 (1989)
12) C. C. Yang and M. S. Chinnan, Trans, the
ASAE.T 30 (2), 548 (1987)
13) F. Carlin, C. Nguyen-the, G. Hilbert and Y.
Chambroy, J. Food Sci., 55 (4), 1033 (1990) 14) C. F. Forney, R. E. Rij and S. R. Ross, Hort-
Science., 24 (1), 111 (1989)
15) A. Ballantyne, R. Stark and J. D. Selman, Int.
J. Food Sci. and Technol., 23, 267 (1988) 16) W. J. Humphreys, 1926. "International Critical
Tables of Numerical Data, Physics, Chemistry and Technology." (Ed) E. W. Washburn, McGraw - Hill, New York, p.393 (1926) 17) A. E. Messner, D. M. Rosio and P. A. Arga-
bright, Anal. Chem., 31 (2), 230 (1959) 18) J. Makhlouf, F. Castaigne, J. Arul, C. Willem-
ot and A. Gosselin, HortScience., 24 (4), 637 (1989
)
19) D. R. Dilley, J. Food Biochem., 2, 235 (1978) 20) W. J. Lipton and C, M. Hani::;, J. Amr. Soc.
Hort. Sci., 99 (3), 200 (1974)
21) A. Ballantyne, R. Stark and J. D. Selman, Int.
J. Food Sci. and Technol., 23, 353 (1988) 22) C. F. Forney and R. E. Rij. HortScience., 26
(10), 1301 (1991)
23) I. Yamashita, T. Takahashi, T. Shimoda, M.
Kikuchi and M. Shibata, Nippon Shokuhin Kogyo Gakkaishi., 34 (12), 834 (1987) 24) J. D. Geeson, K. M. Browne, K. Maddison, J.
Shepherd and F. Guaraldi, J. Food Technol., 20, 339 (1985)
(Received 13 October 1992) (Accepted 4 December 1992)
- 2 3