Journal of Light & Visual Environment Vol.40, 2016
Paper
Color Calibration for the Pressure Ulcer Image Acquired Under
Differ-ent Illumination: A Key Step for Simple, Rapid and Quantitative Color
Evaluation of the Human Skin Diseases Using a Digital Camera
Ken-ichiro SUEHARA*, Ken-ichi ISODA**, Hitoshi MIZUTANI** and Atsushi HASHIMOTO*
* Department of Life Sciences, Graduate School of Bioresources, Mie University, Japan ** Department of Dermatology, Graduate School of Medicine, Mie University, Japan
Received December 17, 2014, Accepted January 28, 2016
ABSTRACT
To eliminate the color appearance variation of the images acquired under the various lighting conditions, we have developed a simple four colored chart (Skin chart) for the color calibration of the human skin images based on the features of the human skin color. The color calibration with the Skin chart worked better than that with a standard color chart. A conventionally obtained photo-image of the pressure ulcer (PU) in medical facilities can be translated into a standard photo-image taken in the standard lighting. The present method is more convenient compared with the previously reported systems using the commer-cially available color charts. Accordingly, the method successfully identified the involved areas from the healthy skin areas by the color image. The newly developed method is a useful tool for the color image acquisition using conventional digital cameras for the electronic medical recording systems and for the medical consulting network by the information communication technologies (ICTs). The developed color calibration method enables simple, easy, rapid, and less expensive record for the shapes of PUs and the quantitative color distribution of the widely involved areas. Thus, this system is expected as an evaluation tool for the topical therapies for PUs in future.
KEYWORDS: color information, digital camera, digital image, color calibration, pressure ulcers
1. Introduction
Recently, many less expensive digital cameras with high resolution have been introduced, and are used for various photo-records. Therefore, the color digital photos have been used as the digital records, and are shared by the medical team members working at the different places in the hospital. These digital medical records are also used for the medical consulting net-work for ICT members. However, the color appearance of the images taken under the different illumination is extensively influenced by the illuminating conditions. Therefore, it is difficult to record reproducibly in medi-cal facilities with conventional lighting systems, and the obtained photo-images are not suitable for quantitative evaluation of the skin lesions by the healthcare team-members. Many previous studies have been reported for measurement of the skin color and the shape of the object using digital images1)‒7). Iizaki et al. measured
the granulation tissue color for the clinical PUs based on the relationship between the color parameter * scale (red-green) and the granulation red index (GRI) defined by log ‒log . The GRI was useful for evalua-tion of the wound color, and the availability of the color parameter containing the digital camera image was
provided8)9). A reproducible calibration system for the
color appearance of the recorded images taken under the different illumination systems will be a useful tool for the quantitative color evaluation of the wound areas.
Several commercial color charts for color correction of the digital images are available now. For example, CASMATCH® has been commonly used for the color
correction of the medical recording images. However, the procedure is only adjusted the gray balance (con-trast) using three * * * setting of the achromatic color section, white (93, 0, 0), gray (58, 0, 0) and black (22, 0, 0), on the color chart sheet. CASMATCH has a nine color sections on the sheet, however, the color correction is carried out using only the three achromatic colors with-out using other six chromatic color sections10)11). As the
result, the appearance of image is corrected by improv-ing the contrast. On the other word, the method usimprov-ing the CASMATCH does not correct the image based on the information of the RGB chart color parameter. It is not clear why the CASMATCH method is carried out only using gray scale charts which the each intensity of the RGB is same values10)11). The CASMATCH method
could be applicable to correct a image obtained by a non-linear response camera. The color correction with
the CASMATCH might be universal method for the case of the RGB values of the image is widely changing and the color balance of the subjects could be stable, for example; healthy human skin. However, the color balance of the delicate change might not be corrected by the CASMATCH method. In our proposed method, the color balance of the image is directly corrected by RGB color chart values with 3 3 matrix operation. A customization for the specific subjects is applicable because more small area of the color balance chang-ing will be corrected in our method. Different from the CASMATCH color correction method, we named our system as a color calibration method.
Previously, we have developed a long term and quantitative remote monitoring and recording system of the surface color changes based on the metabolism of the agricultural products in the agricultural fields where the illuminating conditions varies extensively12).
The key technology of the method is based on a color calibration of the digital images of the subjects taken in the field by conventional digital cameras without specific lighting13)14). In the present method, color
cali-bration is carried out using the color parameter ( values) of the image element, the values of the color-calibrated images were calculated directly. The values of the image element are indicated for a color evaluation of PUs. In general, the conventional colorimeters require exact attaching on the object surface to eliminate the influence of the illuminating conditions, and their effective areas limited within small areas by the illumination of the built-in light sources. The information of the suitable color parameter in the digital images can be utilized for the reproducible mea-surement of the color of the objects, and is expected for measuring the changes of the color and shape of the wide spread skin lesions. In the previous study, we established a standard color (STD) chart system with four squares (1 1 cm) colored red, green, blue and white plain sections for the color calibration. Because the STD chart is as simple as 4 frames of three colors and white sections, which enabled self-printing under control of a specific color management system constructed by ICC (International Color Consortium). However, the STD chart was created focusing the color calibration of the image of the agricultural product including tomato fruits12). The wide color distribution of the each section
on the STD chart is required because the surface color of the agricultural product changes significantly accord-ing to their maturation or metabolisms. In our previous report, the color of the tomato fruit was dynamically changed from green to red. Thus, the color setting of the chart printing for the printer is determined as fol-lows: R (255, 0, 0), G (0, 255, 0), and B (0, 0, 255), respec-tively. However, the skin color variation is limited. The individual difference of the balance of the healthy
skin color will be slightly observed. The skin including wound area will be accompanied with reddish color. However, it will not be redder than the ripeness tomato fruit. Therefore, the pure RGB color setting of the color chart is not ideal for the color calibration method that detects fine changes in the skin image.
Severity of the PUs has been experientially judged by the healthcare members, including medical doctor, nurses and pharmacists based on the visually judged size and colors of the PUs. In general, the length of the major axis and the minor axis of the PUs areas are measured to record the size of the PUs or DESIGN-R has been used as a semi-quantitative evaluation of the shape of the PUs15)16). In contrast to the rapid progress
in the electronic medical recording system17), the digital
measurement tools have been used by old fashioned way: measuring the shape of the ulcers and length of the major and the minor axis by photograph or hand tracing on the display18)19). Both methods have a merit
following the past record method, and are still usable for the electronic medical recording system.
In the present study, we aimed to develop a simple and rapid color calibration method for the digital im-ages of the PUs taken by the conventional and less expensive digital cameras under the daily illuminating conditions in medical facilities. The color appearance of the image acquired in a hospital room or in a home care patient s room is significantly influenced by the illuminating conditions. However, the digital images will be used for evaluation of the skin lesions in future. Many patients with PUs are bedridden, and the image of the PUs is recoded at their bedside. Of course, taking photograph of the skin lesions of a bedridden patient in a darkroom equipped with the standard lighting system is impossible. Therefore, development of the color cali-bration method of the PU images is a key step for the construction of the future electronic medical recording systems. The color-calibrated image and the obtained quantitative color information of the wound area are also applicable to use for the medical consulting network by information communication technologies (ICTs) as well as the evaluation of the therapeutic outcome of the PUs because the metabolism in the body is reflected to the color changes of the wound area. To extract the problem for the future works, we tried to separate the involved areas of the actual PUs from the surrounding normal skin areas by the color images based on the color information of the one actual PU image.
2. Methods
2.1 Color distribution of human skin on color space
The present study adhered to the tenets of the Dec-laration of Helsinki, and was approved by the Institu-tional Review Board of the Mie University Graduate School of Medicine (#2755).
The chromatic features of human skin was inves-tigated on 21 Japanese healthy volunteers (mean age 24 6 SD., male: 14, female: 7) after obtaining informed consent. The images of the skin in their inside of fore-arms were taken using single-lens reflex camera with 10.1 million CMOS sensor (EOS Kiss Digital X, Canon, Tokyo) equipped with compact-macro lens (EF 50 mm f/2.5, Canon, Tokyo). The ISO sensitivity was set to 200. The focus distance and the aperture diaphragm ( value) of the lens were set to 50 mm and 8, and the shut-ter speed was set to quarshut-ter or a half second.
The image acquisition was carried out in the stan-dard color image acquisition system13). The setup of the
color image acquisition system is displayed in Figure 1(a). The system is composed of a digital camera, two fluorescent lights at a 5500 K color temperature (TRUE-LITE®, DURO-TEST Co., Ltd. Philadelphia, PA) and two
diffuse reflectors. The use of the TRUE-LITE fluores-cent light is based on the CIE (Commission Internatio-nale de l Eclairage) regulations, D5520), and its special
color rendering index with 5500 K, which expresses the color appearance by a light source was 91, and is almost the same as natural light. The light from the light sourc-es is scattered on the diffuse reflectors placed over the light sources in order to prevent any specular reflec-tion on the sample surface. The acquired images were recorded as the RAW file format, and the RAW data files were developed manually by using a commercial image editing software (PhotoShop® CS3, Adobe Corp.,
San Jose, CA) and were converted to the TIFF format files. In the case of the image acquisition in the standard color image acquisition system, the color temperature was set to 4700 K. The other parameters for the RAW data developing were set to zero because the influence on color of a developed image can be avoided.
In the case of the image acquisition under the natural lighting, the light exposure for the camera image ele-ment is adjusted automatically under condition of the
value is fixed with 8 (aperture priority AE mode). The white balance and color temperature were obtained using a white chart section which was taken together with the subject using Photoshop CS3 tool. The other procedures are the same as the case of the image ac-quisition using standard color image acac-quisition system. The skin area and the area of the standard color chart sections in the TIFF images were separated us-ing Photoshop CS3. The average values of the each area were calculated.
2.2 Color calibration procedure of the human skin image
To create the STD and the Skin chart, full color laser printer (Pictrography 3500, Fuji Photo Film Co., Ltd., Tokyo, Japan) was used. ICC color profile for the color management was made using spectroradiometer (i1-pro, X-rite Inc., Grand Rapids, MI) and the attached software, i1 Match. The color charts were printed out using the printer and the Photoshop CS3 under color controlled by the ICC color profile. The color chart is as simple as containing four squares (1 1 cm) colored red, green, blue and white plain sections for the color calibration. This skin chart is reproducibly available by printing commercially available digital printers under the control of the present color management system.
The color chart (STD and Skin chart) images were recorded under the standard lighting in the standard color image acquisition system. The sample images with the color charts were also recorded under the mixing lighting; mixture of the sunlight through a white curtain and fluorescent tube lighting that mimics the lighting of the hospital room. The color chart regions and the forearm skin images were extracted and pro-cessed from the recorded images using Photoshop CS3. We obtained the , and values in the RGB color space for each pixel of the extracted images and calcu-lated the average values. The values of the color charts taken in a hospital rooms were calibrated based on the color charts data acquired in the standard color image acquisition system. The detail of the color calibration procedure is as follows12)‒14). The 3 3 matrices and
′ in Eq. (1) denote the , , and values of the color chart for the standard image and the sample image, respectively. The color transformation matrix for the color calibration is calculated as follows.
′ ⋅ ′ ′ ′ ′ ′ ′ ′ ′ ′ ′ R G B R G B R G B R G B R G B R G B a a a a a a a a a r r r r r r g g g g g g b b b b b b 11 12 13 21 22 23 31 32 33 , , = = = = C A C C C A (1)
Figure 1 Schematic diagram of the standard color image ac-quisition system (a) and the example acquired imag-es of forearm skin (b and c) using this standard color image acquisition system. The fluorescent light as the standard lighting used in this system produces near to cloudy sun light. (b) and (c) are the farthest color of forearm skin image on the RGB color space.
For example, g denotes the value of the green
sec-tion on the color chart. The matrix for each sample image was determined using Eq. (1). The color calibra-tion image is obtained by multiplying the matrix with the column vector of , , and values corresponding to each pixel that composes the sample image:
r r g g b b ′ ′ ⋅ ′ = A (2)
where, , and are the , , and values of a picture element of the sample image. ′, ′ and ′ are the , , and values of the picture element after the color calibration. The validity of the color calibration using both the STD and the Skin chart was compared with the images of the PUs on the skin acquired under the mixing lighting.
2.3 Recognition of the involved areas on the color-calibrated images based on the color parameters
In the digital images of the PUs of the inpatient taken in a hospital room (S memorial hospital, north latitude 34.566776, east longitude 136.535072) with the curtain of the white and a neutral fluorescent light. After then, the color calibration was carried out using both the STD and the Skin chart. After the color calibration of the images, the involved areas of the PUs and the normal skin areas on the images were separated and the , , and values of the picture elements were transformed into the Hue ( ), Saturation ( ) and Lightness ( ) values were calculated using following equations21)22).
mid R G B R G B C R G B R G B if R G B H C if G R B H C if G B R H C if B G R H C if B R G H C if R B G H C ( , , ) min( , , ) max( , , ) min( , , ) 60 120 60 120 60 240 60 240 60 360 60 − − − × − − = > > = × > > = > > = + × > > = × > > = + × > > = × (3) R G B R G B L max( , , ) min( , , )= 2+ (4) if L R G B R G B S R G B R G B if L R G B R G B S R G B R G B 0.5 max( , , ) min( , , ) max( , , ) min( , , ) 0.5 max( , , ) min( , , ) 2 max( , , ) min( , , ) ≤ − − − − = + > = (5)
In these equations, the , , , , and values are de-fined ranging from 0 to 1. The value is dede-fined rang-ing from 0 to 360 degrees on the color circle. Finally, each value was expressed by 8 bits data (from 0 to 255), respectively.
The features of the distribution pattern of the
values were evaluated, and the thresholds were deter-mined to clarify the involved areas of the PUs on the color-calibrated images based on the color parameters. To convert the to the values of the each picture elements and to create the ternarization images for the recognition of the involved area, we used the Microsoft Excel® macro VBA program and ImageJ23):
an open source image editing software installed plugin program (JAVA) by ours.
3. Experimental Results
3.1 Color distribution of human skin on color space
Two characteristic images of a healthy adult male skin (Figure 1(b)) acquired in the standard color image acquisition system equipped with the standard lighting was darker than that of a female skin (Figure 1(c)). The average values of the each 21 subjects were plot-ted in the RGB color space (Figure 2(a)). Although the both images (Figure 1(b) and (c)) are expected to locate on the distant place of the RGB color space, the visually detectable differences among the healthy adult skin is limited. In the Figure 2(a), a solid line indicates the Black (0, 0, 0) to White (255, 255, 255) line which is a diagonal of the RGB color space and it means achromatic color on the line. The variations between the subjects of the skin color were not clearly found on the RGB color space. The value of the skin was close to the diagonal line, and was distributed within the extremely small area of the RGB color space. Therefore, we transformed the color image data into the , and (Figure 2(b)), and the distribution pattern of the human skin colors was identified on the - scatter diagram more clearly.
3.2 Difference between the STD and Skin chart by color calibration
The color setting of the STD chart for the printer are (255, 0, 0), (0, 255, 0), and (0, 0, 255), respectively.
Figure 2 Distributions of human forearm skin color on the RGB color space (a) and on the H-S scatter diagram (b). A solid line in (a) indicates the Black (0, 0, 0) to White (255, 255, 255) line which is a diagonal of the RGB color space and it means achromatic color on the line. The 20 s or 40 s displayed in (b) represent the generations of the subjects.
Because the human skin color was distributed within the extremely small area of the RGB color space, the color setting of the Skin chart for the printer was set to (160, 40, 40), (60, 140, 40), and (60, 40, 140), respectively. The effects of the color calibration with two charts in RGB color parameters of the color chart images acquired under the hospital room lighting were shown in Figure 3. Both the color calibration methods effected the good precision of the statistical observa-tion. However, the value of the red section was slightly overestimated in the STD chart compared with that of the Skin chart.
3.3 Color calibration and recognition of the involved areas on the color calibrated images based on the color parameters
In the TIFF format images developed by the Pho-toshop CS3, the developing parameters caused by the color appearance changes of the image were set to zero, therefore, the color balance of each image ele-ments are maintained through the recording process
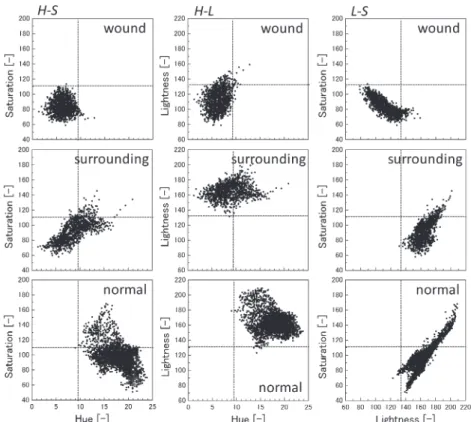
although a slightly dark image is formed (Figure 4(a)). The Skin and the STD chart colors were compared in the image acquired under the standard lighting and the color-calibrated images (Figure 4(b) and (c)). We investi-gated the distribution pattern of the values of the picture element of color-calibrated images, Figure 4(b) and (c). The wound defects, involved surrounding and normal skin areas in the images were separated and the distribution of the three areas was displayed in Figure 5. The , , and distributions were able to be expressed by a Gaussian distribution curves and the fit-ting parameters, center (average) and the width (double of the standard deviation) values, were summarized in Table 1.
The color-calibrated images using the STD chart was reddish. The peaks of the histogram were shifted to the left (close to zero) and =0 means pure red on hue circle. This result represents the results shown in the Figure 3 and 4(b). In the case of the color-calibrated images using the Skin chart, the peaks of the histo-grams of the wound defects, the involved surrounding
Figure 3 Effects of the color calibration with two charts (STD and Skin chart) in RGB color parameters of the color chart images acquired under the hospital room lighting. The color-calibrated RGB values of each section of the chart (vertical axis) were compared with the RGB values of the chart images acquired under the standard lighting (horizontal axis).
skin, and the normal skin area were approximately 6, 9, and 18, respectively. These values include red, or-ange and yellow on the hue circle. Therefore, the color calibrated images using the Skin chart provided suit-able results for skin image recording.
The thresholds of , and were determined with 4.3, 111, and 120, and with 9.2, 112, and 133 respectively to clarify the PUs area on the color-calibrated images using STD and Skin charts. In this study, simpler meth-od was applied to get the domain division image using
threshold values to clarify the difference between color calibration result using STD and Skin chart. The threshold was decided by adding or subtracting the width (double of the standard deviation) to the center (mean) values. For example, threshold and for the color-calibrated image using Skin chart were the value
Figure 5 HSL histogram of image element of the three areas, the involved areas of the PUs (wound and the surrounding) and the normal skin area of the color calibrated images using STD (a) and Skin chart (b). The solid, the dotted and the dashed line are the curve fitting results by Gaussian function for the HSL distributions of the wound, the surrounding of the wound and the normal skin area, respectively.
Table 1 Curve fitting results of H, S, and L distribution by a Gaussian distribution curve represented by Figure 5 (The center and the width values of Gaussian function).
Chart STD Skin Hue Wound 0.0380 (4.29) 6.29 (2.86) Surround 1.13 (7.69) 8.68 (5.89) Normal 11.6 (4.53) 18.3 (5.90) Saturation Wound 91.0 (39.8) 82.5 (29.1) Surround 86.5 (32.5) 90.5 (43.1) Normal 89.0 (27.0) 96.8 (35.9) Lightness Wound 100 (39.2) 110 (39.4) Surround 155 (36.0) 167 (35.2) Normal 150 (28.6) 162 (29.5)
Figure 4 Color images recorded with RAW format after translated to TIFF format (a), color-calibrated image using STD chart (b), and color-calibrated image using Skin chart (c). The STD and Skin chart images of RGB sections acquired under the standard lighting were represented in the top-right-hand of the both Figure (b) and (c).
that added 2.86 to 6.29, and the value that subtracted 29.5 from 162, respectively, in the case of the color-calibrated image using Skin chart. A scatter diagram between the and , and , and and , were pro-cessed. The - , - , and - of the picture elements for each area are distributed characteristically (Fig-ure 6). The attributes of the each pict(Fig-ure element was classified based on these thresholds for color-calibrated image using Skin chart.
Figure 7 shows the recognition results of the wound defects, the involved surrounding skin, and the normal skin areas using the determined thresholds. Although the recognition was not success in the case of the STD chart system (Figure 7(a)), the three areas could be clarified in the case of the color-calibrated image using the Skin chart system (Figure 7(b)).
4. Discussion
The distributions of the color value of the
hu-man skin were limited within a narrow area on the RGB color space. Therefore, it is very difficult to find the difference of the skin colors between the subjects in digital images as shown in Figure 2. A color system using values is generally called an additive color process and the values of the picture elements containing the brightness information in each value. As the results, the balance of the value showed closed to same intensities when the human skin close to the achromatic color was expressed by the additive color process. In general, a uniform color space such as the CIE * * * are used for suitable index to measure the color difference of the subject. On the other hand, HSL color space is commonly used for the color display of the computer graphics and machine-vision24). In the
HSL color space, the color parameter ( and ) and the brightness ( ) can be separated. The HSL color space is not a uniform color space such as the CIE * * *, however, the kind of the color is expressed by absolute values, . Although the human skin color has a pure distribution on the RGB color space, the distribution of the characteristics of the human skin colors was ob-served on the - scatter diagram more clearly. This implicated that the chromatic feature of the human skin color might be processed by the HSL color system.
The color calibration with the Skin chart worked better than that with STD chart. The advantage of the Skin chart for calibration was confirmed. The results using the Skin chart had better precision than those
Figure 6 HSL distributions of picture elements. The thresholds of H, S and L were determined with 9.2, 112, and 133, respectively to clarify the PUs area on the color-calibrated image using Skin chart.
Figure 7 Ternarization results of the PUs image calibrated us-ing the STD (a) and the Skin chart (b).
with the STD in the case of the main color parameter of the each section (for example, r of the red section of
the chart). Especially, r of the red section of the STD
chart was calibrated more larger values. The value of the red section was slightly overestimated with the STD chart compared with that of the Skin chart.
According to the explanation of the camera manu-facturer, the gamma value of the tested camera for the displaying the image is basically set to 2.2. Therefore, the gamma value about the camera output will be lower than one. The RGB output response of the cam-era might be has a non-linear properties if the created image was developed by the function of camera body. The color correction using the CASMATCH is carried out using only the three achromatic colors (gray scale). That means the CASMATCH method can be effec-tive to apply the non-linear response camera images although the color balance of the values could not be corrected. In our color calibration method, the color balance of the values could be calibrated, however, the calibration method by the matrix opera-tion is a linear transformaopera-tion. To avoid the problem, we used the RAW file format for the image record and the RAW data files were developed manually by using the PhotoShop because the improper developing is not carried out. In addition, the light exposure for the im-age sensor was controlled automatically with a camera approximately constantly to get an image with similar brightness. After then, value of the picture ele-ments was calibrated by linear transformation. More powerful color calibration tool could be developed by combination of both methods.
Finally, the three areas, wound defects, the involved surrounding skin and the normal skin areas, on the color-calibrated images were clarified successfully and the quantitative values of the color parameters of the each area were recorded automatically (Figure 7(b)). However, PUs has a variety of forms, the color and the reflectance is not stable. In this study, the thresholds of , and were manually determined. Otsu developed a useful method for thresholds selection from gray-lever histograms for extracting objects from their back-ground in the images25). In the future works, we are
planning the area recognition of the color-calibrated im-age by the Otsu s method or drawing the discrimination ellipsoids26) in scatter diagram automatically. We
intend to investigate the relationship between severity of PUs and the color parameter values and the color dis-tribution of the wound area recorded on an electronic medical record. The various domain division method for the color-calibrated images are also tested in the future to construct the the optimal medical consulting network system. Another issue left to be solved in this system is the individual difference in pigmentation by the aging for the human skin with intermediate color27).
Accumu-lation of data from various PUs images taken various lighting is required. The image analytical procedure in this study is not simple enough. It requires three steps: color calibration, change the picture elements data from to values and recognition the involved areas using the specific software programmed for this study. In addition, the accuracy of the color measurement as the total system of this method is not clear because the accuracy may depend on the reproducibility of the printer, the characteristic of the used camera, discolor-ation of the color chart, etc. The reproducibility of the printer will be considerably maintained by the color management system using ICC profile. In the resent our report, the output characteristics of the five kinds of single-lens reflex digital cameras with the different specifications were investigated. As the results, all of the values of the images of each color section on the color chart taken under the TRUE-LITE illuminat-ing conditions rose to a decimal power function and all tested cameras can be simply on one standardized curves28). The output properties of the values of
the developed image which we operated manually was also non-linear, however, there was no problem about the linear conversion using matrix operation if the im-age was acquired using the camera AE28)29). The
char-acteristic difference of the camera would be corrected although the used camera has a various characteristics. On the other hand, the discoloration of the color chart is one of the serious problems to apply this color cali-bration method. Furthermore, ultraviolet component of the lighting must be removed because the printed sheet and inks usually contain fluorescent materials and their colors depend on the ultraviolet intensity of lighting. Therefore, we are developing the color image calibration system using a virtual color chart image which simulated based on the illuminating spectral information28)29).
The development of the automated color calibration system is expected relatively soon, because the calcula-tion process is simple and universal calculacalcula-tion (only 3 3 matrix operation). More simplified system including the data translation and the recognition is required for the clinical use. TRUE-LITE as the standard lighting used in present study produces near to cloudy sun light. It may represent lighting in a hospital room, how-ever, it might not be ideal for the PUs observation. The lighting system should be optimized for suitable color calibration sections30)31).
5. Concluding remark
In the present study, we developed a color calibration method using the Skin chart. Interestingly, the devel-oped color calibration method in this study is not exclu-sively for the Skin chart system. This system is also us-able for any color chart with RGB three color sections.
For example, CASMATCH has nine color sections on the chart sheet. However, only three achromatic colors (black, gray, and white) have been used for calibration. The present color calibration system may work using CASMATCH as the color chart.
The shape of the wound area and the surround area also might be able to be recorded quantitatively using the conventional image analysis technique32). In
ad-dition, quantitative color record of the widely wound area can be obtained. The color image analysis could be has the advantage that it easily and two-dimensionally acquired the surface information and the color distribu-tion. The time course record of the color parameter of the wound area would be an important information for the evaluation of the therapeutic outcome of the PUs. Therefore, the color calibration method developed in this study is important technique for development of the future medical systems including electronic medical recording systems, the medical consulting network by ICTs, record and prediction of the topical therapies for the PUs because the quantitative color information of the widely involved areas could be obtained simultane-ously. Thus, a simple, rapid, less expensive and non-invasive (non-contact) image evaluation systems for the skin lesions including PUs are expected for the medical recording systems.
Acknowledgments
This study was partly supported by a Research Grant from the Mie Medical Valley Project promoted by Mie Prefecture, Japan (to K.S., K. I., and A.H).
References
(1) Ohsima, H., Takiwaki, H., Washizaki, K., Ishiko, A., Itoh, M. and Kanto, H.: Quantitative evaluation of patch test reaction: A comparison between visual grading and erythema index image analysis, Skin Res. Technol., 17-2, pp. 220‒225 (2011).
(2) Mashaly, H. M., Masood, N. A. and Mohamed, S. A.: Calssification of papulo-squamous skin diseases using image analysis, Skin Res. Technol., 18-1, pp. 36‒44 (2012).
(3) Sparaving, A. and Marazzato, R.: An image-processing analysis of skin textures, Skin Res. Technol., 16-2, pp. 161‒167 (2010).
(4) Lee, G., Lee, O., Park, S., Moon, J. and On, C.: Quan-titative color assessment of dermoscopy images using perceptible color regions, Skin Res. Technol., 18-4, pp. 462‒470 (2012).
(5) Faziloglu, Y., Stanly, R. J., Moss, R. H., Stoecker, W. V. and Mclean, R. P.: Color histogram analysis for melanoma discrimination in clinical images, Skin Res. Technol., 9-2, pp. 147‒155 (2003).
(6) She, Z., Duller, A. W. G., Liu, Y. and Fish, P. J.: Si-multaneous and analysis of optical skin lesion im-ages, Skin Res. Technol., 12-2, pp. 133‒144 (2006). (7) Ohshima, H., Kinoshita, S., Futagawa, M., Takiwaki,
H., Washizaki, K., Ishiko, A. and Kanto, H.: Quanti-fication of allergic and irritant patch test reactions using ImageJ, Skin Res. Technol., 20-2, pp. 177‒181 (2014).
(8) Iizaki, S., Sugama, J., Nakagami, G., Kaitani, T., Nai-to, A., Koyanagi, H., Matsuo, J., Kadono, T., Konya, C. and Sanada, H.: Concurrent validation and reli-ability of digital image analysis of granulation tis-sue color for clinical pressure ulcers, Wound Rep. Reg., 19-4, pp. 455‒463 (2011).
(9) Iizaki, S., Kaitani, T., Sugama, J., Nakagami, G., Naito, A., Koyanagi, H., Konya, C. and Sanada, H.: Prediction validity of granulation tissue color mea-sured by digital image analysis for deep pressure ulcer healing: A multicenter prospective cohort study, Wound Rep. Reg., 21-1, pp. 25‒34 (2013). (10) Matsuo, K., Hayashi, M. and Uchida, A.: Japan
Pat-ent Kokai Hei 9-5164, Jan. 10 (1997) (In Japanese). (11) Matsuo, K., Hayashi, M. and Uchida, A.: US Patent
5,858,675, Dec. 22 (1998).
(12) Hashimoto, A., Suehara, K. and Kameoka, T.: Quan-titative evaluation of surface color of tomato fruits cultivated in remote farm using digital camera images, SICE J. Cont. Meas. Syst. Integra., 5-1, pp. 18‒23 (2012).
(13) Motonaga, Y., Kameoka, T. and Hashimoto, A.: Constructing color image processing system for managing the surface color of agricultural prod-ucts, J. Japanese Soc. Agric. Machin., 59, pp. 13‒21 (1997).
(14) Hashimoto, A., Kondou, H., Motonaga, Y., Kitamu-ra, H., Nakanishi, K. and Kameoka, T.: Evaluation of tree vigor by digital camera based on fruit color and leaf shape, Proc. 1st Congress of WCCA, pp. 70‒77 (2002).
(15) Matsui, Y., Furue, M., Sanada, H., Tachibana, T., Nakayama, T., Sugama, J., Furuta, K., Tachi, M., Tokunaga, K. and Moyachi, Y.: Development of the DESIGN-R with an observational study: An abso-lute evaluation tool for monitoring pressure ulcer wound healing, Wound Rep. Reg., 19-3, pp. 309‒315 (2011).
(16) Miyachi, Y.: Recent trend in pressure ulcer treat-ment in Japan, JMAJ, 49, pp. 62‒69 (2006).
(17) Nakamura, M.: Current status of electronic medi-cal recording in Japan and issues involved, JMAJ, 49, pp. 70‒80 (2006).
(18) Terashima, K.: Development of the pressure ulcer management software TokozureBenricho , Jpn. J. P. U., 6, pp. 75‒80 (2004) (In Japanese).
Kinoshita, S. and Mawaki, A.: Study of the reliabil-ity and validreliabil-ity of a wound measurement Kit, Jpn. J. P. U., 9, pp. 43‒49 (2007) (In Japanese).
(20) CIE: A method for assessing the quality of day-light simulators for colorimetry, CIE 051.2-1999 (1999).
(21) Kameoka, T., Hashimoto, A. and Motonaga, Y.: Constructing color image processing system for managing the surface color of agricultural prod-ucts during post-ripening, Proc. Color forum Japan 1994, pp. 11‒14 (1994).
(22) Motonaga, Y., Kameoka, T. and Hashimoto, A.: Color development of tomato during post-ripening, Proc. 8th congress of AIC., pp. 929‒932 (1997). (23) Rasband, W. S.: ImageJ, U. S. National Institutes of
Health, Bethesda, Maryland, USA, http://rsb.info. nih.gov/ij/, 1997‒2012.
(24) Tsai, S. H. and Tseng, Y. H.: A novel color detec-tion method based on HSL color space for robotic soccer competition, Comput. Math. Appl., 64-5, pp. 1291‒1300 (2012).
(25) Otsu, N.: A threshold selection method from gray-level histograms, IEEE Trans. Syst. Man Cybern., SMC-9-1, pp. 62‒66 (1979).
(26) Imai, Y., Saito, R., Horiuchi, T. and Tominaga, S.: Color image correction of art paintings based on artists color features and illuminant conversion, J.
Light & Vis. Env., 37-2_3, pp. 78‒89 (2013).
(27) Takai, T., Noguchi, M., Nagao, T., Tsuji, Y., Mi-yamura, S. and Terashi, H.: Skin discoloration by topical use of Indine-cadexomer ointment, Jpn. J. P. U., 6, pp. 176‒179 (2004) (In Japanese).
(28) Hashimoto, A., Suehara, K. and Kameoka, T.: Quan-titative surface color measurement of tomato fruit using illuminating spectral information of natural lighting, Chem. Eng. Trans., 44, pp. 163‒168 (2015). (29) Hashimoto, A., Furusawa, K., Susehara, K. and
Kameoka, T.: Quantitative color appearance evalu-ation of agricultural products based on natural lighting information, Proc. of EFITA/WCCA/CIGR VII 2013 Joint Conference, C0258 (2013).
(30) Nakano, Y., Tahara, H., Suehara, K., Khoda, J. and Yano, T.: Color rendering simulator using multi-spectral camera and its application to evaluating white LED light sources, Proc. of CIE Symposium
04, pp. 132‒133 (2004).
(31) Nakano, Y., Tahara, H., Suehara, K., Khoda, J. and Yano, T.: Application of multispectral camera to color rendering simulator, Proc. Book of AIC Co-lour, 05, pp. 1625‒1628 (2005).
(32) Razmjooy, N., Mousavi, B. S. and Soleymani, F. A.: Real-time mathematical computer method for potato inspection using machine vision, Comput. Math. Appl., 63-1, pp. 268‒279 (2012).