Tumor control probability analysis for single fraction carbon ion radiotherapy of early-stage non-small cell lung cancer
Athena Paz
a, Tatsuaki Kanai
a,b,*, Naoyoshi Yamamoto
c, Makoto Sakama
d, and Naruhiro Matsufuji
daHeavy Ion Medicine, Graduate School of Medicine, Gunma University, Japan
bOsaka Heavy Ion Therapy Center, Osaka, Japan
cNational Institute of Radiological Sciences Hospital, Japan
dNational Institute of Radiological Sciences, National Institutes for Quantum and Radiological Sciences and Technology, Japan
Abstract
Purpose: To investigate the suitability of the linear-quadratic (LQ) and universal survival curve (USC) models in describing the 3-year tumor control probability (TCP) data from stage I non-small cell lung cancer (NSCLC) patients treated with carbon ion radiotherapy given at a total dose of 59.4-95.4 Gy[RBE] in 18 fractions, 72 Gy[RBE] in 9 fractions, 52.8-60 Gy[RBE] in 4 fractions and 28-50 Gy[RBE] in a single fraction.
Materials and Methods: A meta-analysis of published clinical data from 394 patients presenting with early stage NSCLC was conducted. TCP modeling based on the LQ and USC models was performed by simultaneously fitting the clinical data obtained from the different fractionation schedules while considering several spread-out Bragg peak (SOBP) sizes. Radiobiological parameters were derived from the fit. Based on the results, a novel SOBP was created for the single fraction regimen that was optimized with respect to the USC model aimed at achieving a 95% local control.
Results: The USC model gave a better fit to the 3-year local control data. The fit using various SOBP sizes yielded transition doses between 5.6-7.0 Gy. The results also revealed α/β ratios between 7.4-9.1 Gy and 7.4-9.4 Gy for the LQ and USC models, respectively.
Conclusions: The USC model provided a better estimate of the local control rate for the single fraction course. For the schemes with more number of fractions, the local control rate estimates from the LQ and USC models were comparable. A USC-based SOBP design was then created for the single fraction schedule. The updated design resulted in a flatter RBE profile compared to the conventional SOBP design. It also gave a better clinical dose prediction to optimize the tumor control rate.
Keywords: NSCLC; carbon ion radiotherapy; TCP; USC model
1. Introduction
Lung cancer is the leading cause of cancer-related death, accounting for 1.69 million mortalities worldwide as of 2015 [1]. The most common type of lung cancer is NSCLC [2]. For patients diagnosed with the early stage of this disease, surgery has been the traditional treatment of choice. However, for patients who are medically inoperable due to complications and comorbidities, radiotherapy is considered as the preferred treatment option [3,4,5,6,7,8,9,10]. In particular, carbon ion radiotherapy (CIRT) is an excellent alternative because of its unique physical and biological properties, offering superior dose
* Corresponding author. Tel.: +81-6-6947-3210; e-mail: [email protected]
localization with reduced risk of toxicities. With this in mind, a dose escalation study for the treatment of stage I NSCLC was started at the National Institute of Radiological Sciences (NIRS) in 1994. Over the years the fractionation schedule was reduced first from 18 fractions in 6 weeks to 9 fractions in 3 weeks and then even further to 4 fractions in 1 week. Finally, the favorable outcome of the dose escalation trial has led to the establishment of a single fraction course. The results of this clinical trial have recently been published and a complete clinical data is now available for analysis [11].
CIRT treatments at NIRS were performed according to the so-called clinical dose system. In this framework, the absorbed dose in the target additionally accounts for the biological effectiveness of carbon ion beams. The photon-equivalent dose of a carbon beam at a depth z in the target is thus given by
𝐷! 𝑧 =RBE 𝑑,𝑧 ×𝑑 𝑧 (1)
where d(z) is the physical dose and RBE(d, z) is the relative biological effectiveness at the depth z and dose level d. The RBE model at NIRS was based on the in vitro response of human salivary gland (HSG) tumor cells evaluated using the LQ model. Due to the limited biological data at the time of establishment and the complexity of the RBE mechanism, only the dependence of the RBE to the radiation quality, i.e. the linear energy transfer of the carbon ion beam, was taken into account in the model. Other factors such as the dose level dependence were ignored. From this approximation the photon-equivalent dose of the spread-out Bragg peak (SOBP) is expressed as
𝐷!!"# 𝑧 = 𝑑!!"# 𝑆
𝑑!"#$!"# 𝑆;𝑧 ×𝑑!"#$ 𝑧 (2)
where 𝑑!!"# 𝑆 is the physical dose of a photon beam needed to generate a survival level S on HSG cells and 𝑑!"#$!"# 𝑆;𝑧 is the corresponding physical dose required to reach the same survival probability S at a depth z in the SOBP. Both doses are obtained by fitting the survival curves of HSG cells with the LQ model. Here, the RBE varies both as a function of the dose at the SOBP center and the depth in the target.
Consequently, the biological response can be characterized as the response relative to the SOBP center and that of the SOBP center relative to the photon beam. The RBE function is then approximately written as
𝑑!!"# 𝑆
𝑑!"#$!"# 𝑆;𝑧 = 𝑑!!"# 𝑆
𝑑!"#$!"# 𝑆;center ×𝑑!"#$!"# 𝑆;center
𝑑!"#$!"# 𝑆;𝑧 (3)
The photon-equivalent dose of the SOBP then becomes
𝐷!!"# 𝑧 =RBE 𝑆;center ×𝑑!"#$!"# 𝑆;center
𝑑!"#$!"# 𝑆;𝑧 ×𝑑!"#$ 𝑧 (4)
and the clinical dose at a depth z is defined as
𝐷!"#$ 𝑧 =1.46×RBE 10%;center ×𝑑!"#$!"# 10%;center
𝑑!"#$!"# 10%;𝑧 ×𝑑!"#$ 𝑧 (5)
where the 10% survival level of HSG cells was chosen as the baseline and the scaling factor 1.46 accounts for the ratio of carbon and neutron RBE at the neutron-equivalent point determined from clinical experience with neutron therapy at NIRS [12]. Equation (5) can also be written in terms of the dose at the SOBP center as
𝐷!"#$ 𝑧 =1.46×RBE 10%;center ×𝑑!"#$ center × !!"#$!"# !"%;!"#$"%
!!"#$!"# !"%;! ×! !!"#$!
!"#$!"#$"% (6)
The SOBP is then designed to achieve a flat clinical dose distribution along the target volume, i.e. the physical dose distribution 𝑑!"#$ 𝑧 is optimized so that !!"#$!"# !"%;!"#$"%
!!"#$!"# !"%;! ×! !!"#$!
!"#$!"#$"% =1. This results in a clinical dose of the form
𝐷!"#$=RBE!"#$ 10%;center ×𝑑!"#$ center (7)
where RBE!"#$ 10%;center = 1.46×RBE 10%;center is defined as the clinical RBE. The optimum clinical dose was then determined through dose escalation studies at NIRS. Equation (7) is employed in treatments assuming that the tumor response at the center of the SOBP is independent of the dose level and the RBE distribution at the 10% survival level is used regardless of the fractionation schedule. With this scheme, once the clinical dose is prescribed and the SOBP width is selected, the physical dose distribution is automatically determined. The clinical dose system, therefore, facilitates the use of a universal physical dose profile to all patients regardless of dose level or tumor type [12, 13].
Despite the several simplifying assumptions used in the clinical dose system its suitability for schedules longer than 4 fractions has already been demonstrated in previous works [13,14]. However, its applicability for the hypofractionated regime is yet to be investigated. It is important to note that the RBE model in the clinical dose framework was developed based on empirical cell survival curves of HSG tumor cells fitted with the LQ model. But in the hypofractionated regime, one pressing issue can arise from the overestimation of the cell killing by the LQ model when very high doses per fraction are used. This can lead to an inaccurate dose prescription and can thus contribute to a poor treatment outcome. A commonly cited alternative is the USC model. This formalism combines the functionality of the LQ model at the low dose range with the linear behavior of the single hit multi-target (SHMT) model at the high dose range [15].
Considering the significant shift towards extreme hypofractionation in this clinical trial, it is therefore increasingly important to examine the validity of the radiobiological model adopted in the clinical dose system in this regime.
In this paper, the applicability of the LQ and USC models in predicting the local control rates of NSCLC clinical data are examined through a TCP analysis. Radiobiological parameters from both models are determined from the TCP data. Finally, a new SOBP design is developed for single fraction CIRT.
2. Methods 2.1 Clinical data
TCP data of primary tumors from published dose escalation studies for NSCLC CIRT treatment were used in this work [3,11,16,17]. Published clinical data from N=394 NSCLC patients treated at the NIRS hospital from October 1994 to February 2012 were identified for this study. Patients registered to the phase I/II clinical trials had inoperable, peripherally located stage I NSCLC and had not undergone radiotherapy and chemotherapy prior to treatment. The clinical trials were performed under clinical protocols with four different fractionation regimens namely, 18 fractions in 6 weeks (Dtotal= 59.4-95.4 Gy[RBE], N18=47 patients), 9 fractions in 3 weeks (Dtotal = 72 Gy[RBE], N9=50 patients), 4 fractions in 1 week (Dtotal = 52.8- 60 Gy[RBE], N4=79 patients) and a single fraction (Dtotal = 28-50 Gy[RBE], N1=218 patients) CIRT. The mean tumor size from the clinical data were 𝜔!"= 29.2 mm, 𝜔! = 29.6 mm, 𝜔! = 29.9 mm and 𝜔! = 28.0 mm, for the 18, 9, 4 and single fraction course, respectively. For the 18-fraction schedule, the clinical target volume (CTV) was determined by setting a 5-mm margin outside the gross tumor volume (GTV). In the case of the 9, 4 and single fraction schedules, the margin was set to 10 mm. Furthermore, CIRT was performed using a respiratory-gated irradiation system and dose was delivered from four oblique portals at a mutual angle of 40° or 50° in all the cases. The 3-year local control rates for the various schedules served as the basis for this analysis. Summaries of the patient and treatment characteristics are given in Supplementary Tables 1 and 2, respectively.
In all the papers identified, Kaplan-Meier statistics was used to evaluate the local control rates. For papers reporting TCP data of stages T1 and T2 separately, the combined TCP was obtained from the weighted sum of the individual TCP results given by
TCP=𝑓!!∙TCP!!+𝑓!!∙TCP!! (8)
where fT1 and fT2 are the fraction of patients for each stage, i.e. fT1 + fT2 = 1 [18].
Dose specified in the papers are prescribed dose to the isocenter in Gy[RBE]. The physical dose (Gy) at the center of a 290-MeV/n SOBP1 was computed by dividing the isocenter dose with the clinical RBE. The calculated physical dose (Gy) is then employed in fitting the TCP data. Various SOBP widths commonly used in treatments were considered. The clinical RBE of 2.6, 2.4, 2.3 and 2.2 corresponding to a 40, 60, 80 and 100-mm SOBP were used in the calculations, respectively [12,13].
2.2 TCP model
The TCP of the patient population was modeled by assuming heterogeneity in radiation response within the patient distribution such that the LQ coefficient 𝛼has a normal distribution, which is characterized by an average value 𝛼 and its standard deviation 𝜎!. The TCP then has the form,
TCP= 1
2𝜋𝜎!!exp − 𝛼!−𝛼 ! 2𝜎!!
!
exp −𝑁!𝑆 𝐷 (9)
In Equation (9), 𝑁!=𝜌 !
!𝜋 !
!
! is the initial number of clonogenic cells where 𝜌 = 1.0 × 10⁷ cells/cm3 is the cell density and 𝜔 is the mean tumor size in each fractionation scheme (See Supplementary Table 1) [14,19]. For an LQ-based TCP model, the fraction of clonogenic cells S(D) that survive after exposure to a total physical dose D (Gy), delivered in n-fractions of d-dose per fraction, was computed according to
ln𝑆!" 𝐷 =−𝑛𝛼𝑑−𝑛𝛽𝑑! (10)
where 𝛽=0.076 Gy!! and 𝜎! =0.15 were assumed to be constant and the time dependent recovery term was neglected due to the short treatment duration [14].
Alternatively, the USC model was used to predict the cell survival after CIRT treatment. In this formalism, the surviving fraction of the cell population was determined by
ln𝑆!"# 𝐷 =
−𝑛𝛼𝑑−𝑛𝛽𝑑!, 𝑑≤𝐷!
−𝑛 𝑑 𝐷!+𝑛𝐷!
𝐷!, 𝑑≥𝐷! (11)
where D0 and Dq are model parameters and DT in Gy is the transition dose beyond which the continuously bending curve of the LQ model transforms into a linear relationship with dose [15]. By exploiting the dependence of the variables in the USC model [15],
𝛽=(1−𝛼𝐷!)!
4𝐷!𝐷! (12)
𝐷! = 2𝐷!
(1−𝛼𝐷!) (13)
Equation (11) was then reformulated to
ln𝑆!"# 𝐷 = −𝑛𝛼𝑑−𝑛𝛽𝑑!, 𝑑≤𝐷!
−𝑛𝑚𝑑+𝑛𝛽𝐷!!, 𝑑≥𝐷! (14)
where 𝑚=𝛼+2𝛽𝐷! is the slope of the LQ curve at DT.
1The range in water of a 290-MeV/n carbon ion beam is 150 mm.
To analyse the clinical data, it was assumed that a single SOBP width is used in all the treatments. The TCP is then assumed to be determined by the isocenter dose. In real treatments, however, several SOBP sizes are employed. In fact, treatment for a single patient at different beam angles can utilize different SOBP widths.
Model parameters, namely 𝛼 and DT were obtained by performing a simultaneous fit to the 18, 9, 4 and single fraction TCP data with the least-squares approach. SOBP widths of 40, 60, 80 and 100 mm were also investigated in the fit. In the fitting process, the residual at each data point was scaled to its corresponding uncertainty expressed as
𝜎!"#",!=TCP!!"#" 1−TCP!!"#"
𝑁!,!∙TCP!!"#"
(15) where Np,i is the number of patients in the i-th data point. Consequently, the chi-square has the form
𝜒!= TCP!!"#"−TCP!!"#$% !
𝜎!"#",!!
!
(16) For data points whose TCP value is 1, the uncertainty was computed using the maximum TCP value in the dataset that is less than 1 [18]. The goodness-of-fit was then estimated using the Akaike (AIC) and Bayesian information criterion (BIC).
2.3 SOBP design for single fraction carbon ion therapy 2.3.1 Carbon ion transport simulation with Geant4
The Geant4 toolkit was used to simulate the passage of carbon ions through the beam line of the Gunma Heavy Ion Medical Center [20]. A 290-MeV/n carbon beam was generated at the center of the two wobbler magnets and was incident on a water target. The carbon ion projectile passed through an aluminium plate located at the ridge filter position. The thickness of the aluminium plate was then varied in each run from 0 to 60 mm in increments of 5 mm to determine the dose distribution of each component Bragg curve.
Additional corrections were also applied to the simulated dose distributions to account for beam divergence and range straggling [21].
The dose-averaged 𝛼 and 𝛽 values for the mixed radiation field were computed according to
𝛼= 𝛼!
!
𝑓!
(17)
𝛽= 𝛽!
!
𝑓! (18)
where fi is the weight in dose of the i-th particle specie determined from the fluence distributions of primary and secondary particles obtained from the simulation, and 𝛼! and 𝛽! are the corresponding LQ parameters.
Tabulated 𝛼 LET and 𝛽 LET values from in vitro studies of HSG cells irradiated with mono-energetic carbon and helium ions were used wherein the LQ parameters of helium ions were assumed to represent all fragment particles [22,23].
2.3.2 LET dependence of DT
The final set of information required to create the SOBP is the transition dose as a function of the LET for each individual Bragg curve. Note that the transition dose DT found from the TCP fit corresponds to a survival level of 𝑆!!"# for the mean LET value of the therapeutic carbon beam for each SOBP width. The transition dose for each LET value was then assumed as the dose needed to produce a survival level equal
to 𝑆!!"#. Thus, given the LQ coefficients 𝛼 LET and 𝛽 LET at each point of the SOBP, the transition dose is obtained from
𝐷! LET =
−𝛼+ 𝛼!−4𝛽ln𝑆!!"#
2𝛽
(19)
Finally, the weighting factors of the component Bragg curves were computed using an iterative least squares algorithm to generate a uniform survival level throughout the SOBP. By assuming that the survival probability of NSCLC cell lines after photon irradiation is described by Equation (11) and that after carbon ion irradiation is expressed by Equation (14), the doses needed to reach a survival fraction S for d ≥ DT are given by
𝑑!!"#$# 𝑆 =𝐷!−𝐷!ln𝑆 (20)
𝑑!"#$!"#$# 𝑆 =𝛽𝐷!!−ln𝑆 𝛼+2𝛽𝐷!
(21)
The RBE was then calculated according to RBE = 𝑑!!"#$# 𝑆
𝑑!"#$!"#$# 𝑆 = 𝐷!−𝐷!ln𝑆 ∙ 𝛼+2𝛽𝐷! 𝛽𝐷!!−ln𝑆
(22)
where D0 = 1.25 Gy and Dq = 1.8 Gy are USC parameters [15]. The clinical dose was then tentatively defined as analogous with Equation (7).
3. Results and Discussions 3.1 TCP fit of the clinical data
Figure 1 shows the 3-year TCP data from the 18, 9, 4 and single fractionation schedules employed for early stage NSCLC at NIRS. Also shown in the figure are comparisons of the fit results achieved with the LQ and USC-based TCP models considering various SOBP widths. The model parameters estimated from the fit are summarized in Table 1. Figure 1 shows that the difference in the model fits for the single fraction schedule increases as the SOBP width increases. This can be attributed to the higher LET value found at the center of the smaller SOBP than the larger SOBP sizes. The higher LET value will result in a straighter survival curve. Consequently, the survival curves generated from both models will be similar and the transition dose will be harder to identify. Moreover, only a small deviation in the fit is observed for the 4, 9 and 18 fraction schemes as the SOBP width is varied. This demonstrates the equivalency of the LQ and USC models in the conventional fractionation regime. In terms of goodness of the fit, the USC model provided a better agreement to the clinical data giving consistently lower AIC and BIC values (see Table 1). On the other hand, the LQ model gave a poor fit to the single fraction data. It failed to reproduce even the data point at 63.2% TCP. The fit obtained from the LQ model is then found to significantly deteriorate as the SOBP width increases.
Fitting the 3-year TCP data with the USC model at different SOBP sizes revealed transition doses between 5.6-7.0 Gy. Note that the estimate for the transition dose is dictated by the TCP data of the single fraction course. It is apparent in Figure 1 that the single fraction TCP data does not reach 100% but approaches an asymptotic plateau at about 84%. Due to this behaviour of the TCP data and the limited data points at this fractionation schedule, a higher uncertainty can be expected for the fit of the transition doses.
Nevertheless, the values found are close to the transition dose of 6.2 Gy obtained by Park et al. from 12 NSCLC cell lines irradiated with photons. In addition, the 𝛼 is found to decrease as the SOBP size increases for both models. This trend reflects the change in the shape of the survival curve with LET. A high 𝛼 leads to a steep slope, consistent with a survival curve typically observed with high LET beams. On
the other hand, a low 𝛼 generates a survival curve with a gentler slope that is indicative of irradiation from low LET beams. A plot of the survival curves resulting from the parameters in Table 1 is given in Supplementary Figure 1. The 𝛼/𝛽 ratios derived from the fit are also found to be between 7.4-9.1 Gy and 7.4-9.4 Gy for the LQ and USC models, respectively.
Furthermore, comparing the transition doses to the fractional dose in each regimen revealed that the doses for the 4, 9 and 18 fractionation schedules are within the validity of the LQ model. The 6.4 Gy dose per fraction of the 4-fraction treatment using a 100-mm SOBP slightly exceeds the transition dose of 5.6 Gy. However, in the single fraction case, doses per fraction in the range of 14.1-20.7 Gy (60-mm SOBP) are well beyond the transition doses. Hence, cell killing in this extremely hypofractionated case can be more appropriately modelled using the USC formalism. In fact, the TCP data itself supports this assertion.
It is evident in Figure 1 that the treatments given in more fractions provide superior local control rates as compared to the single fraction scheme. The single fraction data exhibits a shallower slope, signifying a larger variation in the tumor response across patients. In addition, the TCP data reached an asymptotic plateau at about 84% and a 100% TCP is not attained even for doses greater than 17.5 Gy. All these findings suggest that the conventional fixed LQ-based SOBP is not optimized for this extremely hypofractionated treatment schedule. Therefore, in order to improve these clinical results, it is necessary to create a new SOBP based on the USC model.
Another important factor that could have influenced the treatment outcome is tumor hypoxia. Hypoxia has been associated with metastasis and therapy resistance in NSCLC [24,25,26]. Nevertheless, the temporally dynamic nature of the hypoxic condition presents an opportunity for fractionated therapy.
Reoxygenation of hypoxic sub-volumes in the tumor between fractions can increase radiosensitivity and, therefore, improve the treatment performance [27]. Apart from this, fractionation could also take advantage of the redistribution of cells within the cell cycle such that cells in a radioresistant state turn into more sensitive ones over time [28]. Thus, a better tumor control can be expected for increased number of fractions.
Figure 1. Simultaneous fits to the 3-year TCP data for 18, 9, 4 and single fraction carbon ion therapy treatment of stage I NSCLC assuming a clinical RBE at the SOBP center of (a) 2.6 (40-mm SOBP), (b) 2.4 (60-mm SOBP), (c) 2.3 (80-mm SOBP) and (d) 2.2 (100-mm SOBP). The error bars correspond to the TCP uncertainty computed using Equation (15).
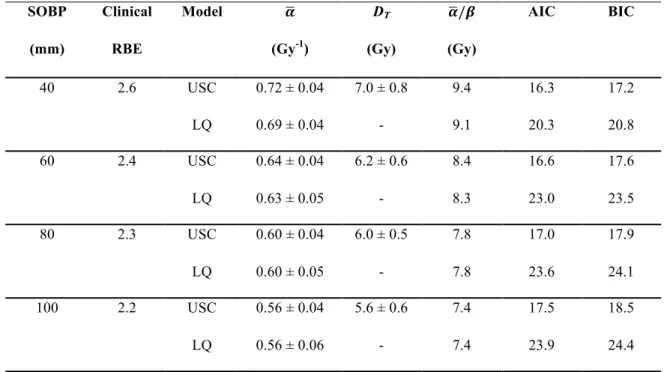
Table 1. Parameters of the USC and LQ models from the simultaneous fit of the clinical data for various fractionation regimen and SOBP sizes.
SOBP Clinical Model 𝜶 DT 𝜶/𝜷 AIC BIC
(mm) RBE (Gy-1) (Gy) (Gy)
40 2.6 USC 0.72 ± 0.04 7.0 ± 0.8 9.4 16.3 17.2
LQ 0.69 ± 0.04 - 9.1 20.3 20.8
60 2.4 USC 0.64 ± 0.04 6.2 ± 0.6 8.4 16.6 17.6
LQ 0.63 ± 0.05 - 8.3 23.0 23.5
80 2.3 USC 0.60 ± 0.04 6.0 ± 0.5 7.8 17.0 17.9
LQ 0.60 ± 0.05 - 7.8 23.6 24.1
100 2.2 USC 0.56 ± 0.04 5.6 ± 0.6 7.4 17.5 18.5
LQ 0.56 ± 0.06 - 7.4 23.9 24.4
3.2 SOBP design for single fraction therapy
CIRT treatment for NSCLC has so far been done with a conventional LQ-based SOBP fixed at the 10%
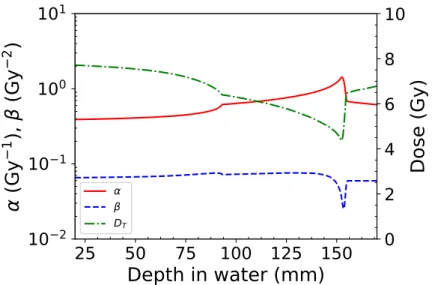
survival level of HSG tumor cells. But as is shown in Figure 1, this strategy has not produced optimum results in the single fraction regimen. Thus, to improve the efficacy of single fraction CIRT, a novel SOBP design was introduced in this study. The SOBP was developed with respect to the USC model aimed at inducing a 95% TCP of the lung tumor. A uniform survival level of 3.0 × 10⁻¹⁰ along the SOBP was then imposed in the optimization. The radiobiological properties of this updated 60-mm SOBP design are depicted in Figure 2. The 𝛼,𝛽 and DT values at the center of the new SOBP are found to be 0.75 Gy-1, 0.075 Gy-2 and 5.8 Gy, respectively. The optimization matched the 𝛼,𝛽 and DT values to within 17.2%, 1.3% and 6.5%, respectively. Moreover, the transition dose is found to decrease along the SOBP region, with its minimum coinciding with the LET maximum. This trend is a result of the assumption made in Equation (19) where 𝑆!!"#is kept at a constant value of 1.0 × 10⁻³. At this high-LET distal fall-off position, the 𝛼,𝛽 and DT values are found to be 1.4 Gy-1, 0.033 Gy-2 and 4.5 Gy, respectively.
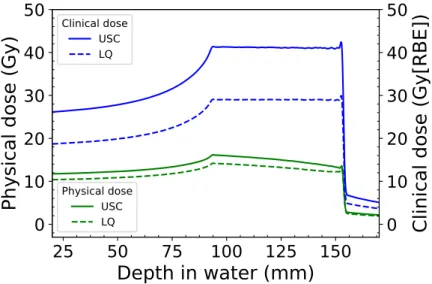
A comparison of the RBE distributions and physical doses of the old and updated SOBP designs are given in Figure 3. Note again that the RBE for the updated SOBP designs were calculated for NSCLC at a survival level of 3.0 ×10⁻¹⁰ for the USC model and 8.2 ×10⁻¹¹ for the LQ model. The much lower survival level requirement of the updated designs produced an RBE profile that gradually varies across the SOBP region. In contrast, the conventional fixed LQ-based design shows a sharp increase in the RBE towards the distal peak. This trend in the RBE distribution is reflected in the physical dose distribution, wherein the updated designs give a flatter profile compared to the conventional one. Furthermore, comparing the RBE values of the conventional (black dotted line) and updated (magenta dashed line) LQ-based designs shows that the former is greater than the latter throughout the SOBP. However, the USC-based design displays higher RBE values compared to the LQ-based ones apart from the distal peak region.
Figure 2. The 𝛼, 𝛽 and DT profiles of the USC-based SOBP design.
Figure 3. The RBE and physical dose distributions for a 60-mm SOBP in the conventional LQ-based design optimized for S = 1.0 ×10⁻¹ and the updated designs optimized for a 95% TCP (USC model at S = 3.0 ×10-
10 and LQ model at S = 8.2 ×10⁻¹¹).
A more thorough comparison of the physical and clinical dose distributions of the updated designs required to reach a 95% TCP are illustrated in Figure 4. Surprisingly, the physical dose profiles obtained from both models are identical. The important difference between the two designs, however, lies in the computed absolute physical and clinical doses. The optimization yielded a physical dose of 13.3 Gy at the SOBP center for the LQ model. But to achieve the same level of tumor control, the USC model requires an additional 1.7 Gy per fraction. This discrepancy is compounded by the difference in the RBE values calculated from the two models. Figure 5 depicts the survival curves of NSCLC after CIRT assuming a treatment using a 60-mm SOBP and the corresponding plot after photon irradiation. The doses used to compute the RBE for the LQ and USC models at the 95% TCP are also marked in the figure as red and magenta arrows, respectively. It is seen that beyond the transition dose the LQ model produces a lower RBE value than the USC model. To achieve a 95% TCP, the LQ model predicted a RBELQ=1.5, whereas the USC model estimated it at RBEUSC=1.9. Consequently, a clinical dose of 41.1 Gy[RBE] is needed for the USC model, while the LQ model requires only 29.0 Gy[RBE]. This much lower clinical dose prediction
is clearly an overestimation of the treatment potency since according to the single fraction TCP data a dose of 34.0 Gy[RBE] (Dphys = 14.2 Gy) resulted only in a meager 63.2% control rate. An improvement in the local control rate can certainly be expected if the updated SOBP design for the LQ model is used in the treatment instead of the conventional one. But the USC model provided a more accurate estimate of the local control rate. Therefore, an optimum TCP can be achieved by employing the USC model predictions in the treatments.
Figure 4. The clinical and physical dose distributions of a 60-mm SOBP designed according to the USC and LQ models to induce a 95% TCP.
Figure 5. The survival fraction of NSCLC computed from parameters determined in the TCP fit using a 60- mm SOBP. X-ray data are taken from Park et al. The red and magenta arrows correspond to the doses used in the RBE computation for the LQ and USC models at 95% TCP, respectively.
4. Conclusions
An analysis of the 3-year TCP data from early stage NSCLC patients treated with CIRT at various fractionation schedules was performed in this study. The USC model was found to be better suited in describing the local control rate of the single fraction course. However, for the 4, 9 and 18 fractionation schemes, the LQ and USC models predicted comparable local control rates. A new SOBP was then created according to the USC model specifications for the single fraction regimen. A flatter RBE profile was achieved from this updated SOBP design. The clinical dose estimated was also found to be more sufficient in inducing a 95% tumor control than the LQ prediction.
References
1. WHO, World Health Organization. Cancer, http://www.who.int/mediacentre/factsheets/fs297/en/
(2018).
2. ACS, American Cancer Society. What is Non-small Cell Lung Cancer?, https://www.cancer.org/cancer/non-small-cell-lung-cancer/about/what-is-non-small-cell-lung- cancer.html (2016).
3. T. Miyamoto, M. Baba, N. Yamamoto, M. Koto, T. Sugawara, T. Yashiro, K. Kadono, H. Ezawa, H. Tsujii, JE. Mizoe, K. Yoshikawa, S. Kandatsu, T. Fujisawa, ”Curative treatment of stage I non- small cell lung cancer with carbon ion beams using hypofractionated regimen”, International Journal of Radiation Oncology Biology Physics 67 (2007) 750–758.
4. M. Taremi, A. Hope, M. Dahele, S. Pearson, S. Fung, T. Purdie, A. Brade, J. Cho, A. Sun, JP.
Bissonnette, A. Bezjak, ”Stereotactic body radiotherapy for medically inoperable lung cancer:
prospective, single-center study of 108 consecutive patients”, International Journal of Radiation Oncology Biology Physics 82 (2012) 967–973.
5. O. Fujii, Y. Demizu, N. Hashimoto, M. Araya, M. Takagi, K. Terashima, M. Mima, H. Iwata, Y.
Niwa, D. Jin, T. Daimon, R. Sasaki, Y. Hishikawa, M. Abe, M. Murakami, N. Fuwa, ”A retrospective comparison of proton therapy and carbon ion therapy for stage I non-small cell lung cancer”, Radiotherapy and Oncology 109 (2013) 32–37.
6. M. Karube, N. Yamamoto, M. Nakajima, H. Yamashita, K. Nakagawa, T. Miyamoto, H. Tsuji, T.
Fujisawa, T. Kamada, ”Single-fraction carbon-ion radiation therapy for patients 80 years of age and older with stage I non-small cell lung cancer”, International Journal of Radiation Oncology Biology Physics 95 (2016) 542–548.
7. C. Hobbs, S. Ko, N. Paryani, J. Accurso, K. Olivier, Y. Garces, S. Park, C. Hallemeier, S. Schild, S. Vora, J. Ashman, W. Rule, J. Bowers, M. Heckman, N. Diehl and R. Miller, ”Stereotactic body radiotherapy for medically inoperable stage I-II non-small cell lung cancer: The Mayo clinic experience ”, Mayo Clinic Proceedings Innovations, Quality & Outcomes 2 (2018) 40–48.
8. J. Nyman, A. Hallqvist, J. Lund, O. Brustugun, B. Bergman, P. Bergström, S. Friesland, R.
Lewensohn, E. Holmberg and I. Lax ”SPACE - A randomized study of SBRT vs conventional fractionated radiotherapy in medically inoperable stage I NSCLC”, Radiotherapy and Oncology 121 (2016) 1– 8.
9. A. Miyakawa, Y. Shibamoto, F. Baba, Y. Manabe, T. Murai, C. Sugie, T. Yanagi and T. Takaoka,
”Stereotactic body radiotherapy for stage I non-small cell lung cancer using higher doses for larger tumors: results of the second study”, Radiation Oncology 12:152 (2017). doi:10.1186/s13014-017- 0888-7.
10. J. Lischalk, S. Woo, S. Kataria, N. Aghdam, I. Paydar, M. Repka, E. Anderson and B. Collins,
”Long-term outcomes of stereotactic body radiation therapy (SBRT) with fiducial tracking for inoperable stage I non-small cell lung cancer (NSCLC)”, Journal of Radiation Oncology 5 (2016) 379– 387.
11. N. Yamamoto, T. Miyamoto, M. Nakajima, M. Karube, K. Hayashi, H. Tsuji, H. Tsujii, T.
Kamada, T. Fujisawa, ”A dose escalation clinical trial of single-fraction carbon ion radiotherapy for peripheral stage I non-small cell lung cancer”, Journal of Thoracic Oncology 12 (2016) 673–
680.
12. T. Kanai, M. Endo, S. Minohara, N. Miyahara, H. Koyama-ito, H. Tomura, N. Matsufuji, Y.
Futami, A. Fukumura, T. Hiraoka, Y. Furusawa, K. Ando, M. Suzuki, F. Soga, K. Kawachi,
”Biophysical characteristics of HIMAC clinical irradiation system for heavy-ion radiation therapy”, International Journal of Radiation Oncology Biology Physics 44 (1999) 201–210.
13. N. Matsufuji, T. Kanai, N. Kanematsu, T. Miyamoto, M. Baba, T. Kamada, H. Kato, S. Yamada, J. Mizoe, H. Tsujii, ”Specification of carbon ion dose at the National Institute of Radiological Sciences (NIRS)”, Journal of Radiation Research 48 (2007) A81–A86.
14. T. Kanai, N. Matsufuji, T. Miyamoto, JE. Mizoe, T. Kamada, H. Tsuji, H. Kato, M. Baba, H.
Tsujii, ”Examination of the GyE system for HIMAC carbon therapy”, International Journal of Radiation Oncology Biology Physics 64 (2006) 650–656.
15. C. Park, L. Papiez, S. Zhang, M. Story, RD. Timmerman, ”Universal survival curve and single fraction equivalent dose: useful tools in understanding potency of ablative radiotherapy”, International Journal of Radiation Oncology Biology Physics 70 (2008) 847–852.
16. T. Miyamoto, N. Yamamoto, H. Nishimura, M. Koto, H. Tsujii, JE. Mizoe, T. Kamada, H. Kato, S. Yamada, S. Morita, K. Yoshikawa, S. Kandatsu, T. Fujisawa, ”Carbon ion radiotherapy for stage I non-small cell lung cancer”, Radiotherapy and Oncology 66 (2003) 127–140.
17. T. Miyamoto, M. Baba, T. Sugane, M. Nakajima, T. Yashiro, K. Kagei, N. Hirasawa, T.
Sugawara, N. Yamamoto, M. Koto, H. Ezawa, K. Kadono, H. Tsujii, JE. Mizoe, K. Yoshikawa, S.
Kandatsu, T. Fujisawa, ”Carbon ion radiotherapy for stage I non-small cell lung cancer using a regimen of four fractions during 1 week”, Journal of Thoracic Oncology 2 (2007) 916–926.
18. F. Liu, A. Tai, P. Lee, T. Biswas, G. Ding, I. E. Naqa, J. Grimm, A. Jackson, F. Kong, T.
LaCouture, B. Loo Jr., M. Miften, T. Solberg, X. A. Li, ”Tumor control probability modeling for stereotactic body radiation therapy of early-stage lung cancer using multiple bio-physical models”, Radiotherapy and Oncology 122 (2017) 286–294.
19. S. Webb and AE. Nahum, ”A model for calculating tumor control probability in radiotherapy including the effects of inhomogeneous distributions of dose and clonogenic cell density”, Physics in Medicine and Biology 38 (1993) 653– 666.
20. S. Agostinelli, J. Allison, K. Amako, et al., ”GEANT4 - a simulation toolkit”, Nuclear Instruments and Methods in Physics Research Section A: Accelerators, Spectrometers, Detectors and Associated Equipment 506 (2003) 250–303.
21. M. Sakama, T. Kanai, Y. Kase, K. Yusa, M. Tashiro, K. Torikai, H. Shimada, S. Yamada, T.
Ohno, T. Nakano, ”Design of ridge filters for spread-out Bragg peaks with Monte Carlo simulation in carbon ion therapy”, Physics in Medicine and Biology 57 (2012) 6615–6633.
22. T. Kanai, Y. Furusawa, K. Fukutsu, H. Itsukaichi, K. Eguchi-Kasai, H. Ohara, ”Irradiation of mixed beam and design of spread-out Bragg peak for heavy-Ion radiotherapy”, Radiation Research 147 (1997) 78–85.
23. Y. Furusawa, K. Fukutsu, M. Aoki, H. Itsukaichi, K. Eguchi-Kasai, H. Ohara, F. Yatagai, T.
Kanai, K. Ando, ”Inactivation of aerobic and hypoxic cells from three different cell lines by accelerated 3He-, 12C- and 20Ne-ion beams”, Radiation Research 154 (2000) 485–496.
24. E. Graves, A. Maity, Q. Le, ”The tumor microenvironment in non-small cell lung cancer”, Seminars in Radiation Oncology 20 (2010) 156–163.
25. J. Zhang, J. Cao, S. Ma, R. Dong, W. Meng, M. Ying, Q. Weng, Z. Chen, J. Ma, Q. Fang, Q. He, B. Yang, ”Tumor hypoxia enhances non-small cell lung cancer metastasis by selectively promoting macrophage M2 polarization through the activation of ERK signaling”, Oncotarget 5 (2014) 9664–9677.
26. A. Salem, M. Asselin, B. Reymen, A. Jackson, P. Lambin, C. West, J. O’Connor, C. Faivre-Finn,
”Targeting hypoxia to improve non-small cell lung cancer outcome”, Journal of the National Cancer Institute 110 (2018) 14–30.
27. L. Antonovic, E. Lindblom, A. Dasu, N. Bassler, Y. Furusawa, I. Toma-Dasu, ”Clinical oxygen enhancement ratio of tumors in carbon ion radiotherapy: the influence of local oxygenation changes”, Journal of Radiation Research 55 (2014) 902–911.
28. J. Brown, D. Carlson, D. Brenner, ”The tumor radiobiology of SRS and SBRT: are more than the 5 R’s involved?”, International Journal of Radiation Oncology Biology Physics 88 (2014) 254–
262.
Supplementary Table 1. Patient characteristics Fraction
size
Study duration Number of patients
Age Gender Stage Tumor size†
(mm)
Target volume (mL)
Reference
18 Oct 1994 - Aug 1998 47 49 - 82
(71)a
M: 34 F: 13
T1: 27 T2: 21
5 - 60 (29.2) a
4.8 - 290 (59.1) a
[16]
9 Apr 1999 - Dec 2000 50 61 - 84
(74.1) a
M: 38 F: 12
T1: 29 T2: 21
10 - 70 (29.6) a
9.8 - 424.4 (117.5) a
[3]
4 Dec 2000 - Nov 2003 79 47 - 88
(74.8) a
M: 54 F: 25
T1: 42 T2: 37
10 - 70 (29.9) a
T1: 54.45±26.07 T2: 123.40±46.91
[17]
1 Apr 2003 - Feb 2012 218 46 - 89
(75) b
M: 157 F: 61
T1: 123 T2: 95
5 - 85 (28) b
24.9 - 357.3 (86.5) b
[11]
aMean
bMedian
†At the greatest axis
Supplementary Table 2. Treatment characteristics and results Fraction
size
Total dose (Gy[RBE])
Number of patients
Local control rate (%)
Reference
18 59.4
64.8 72.0 79.6 86.4 90.0 95.4
5 7 19
6 5 3 3
40.0 57.0 75.0 66.6 80.0 100.0 100.0
[16]
9 72.0 50 97.6 [3]
4 T1: 52.8
T2: 60.0
42 37
98.0 80.0
[17]
1 28.0 - 34.0
36.0 - 42.0 44.0 - 50.0
T1: 32, T2: 35 T1: 47, T2: 20 T1: 44, T2: 40
T1: 80.7, T2: 47.3 T1: 88.0, T2: 74.3 T1: 90.8, T2: 77.7
[11]