The determinants of rural electrification in Bihar, India
著者 Oda Hisaya, Tsujita Yuko
権利 Copyrights 日本貿易振興機構(ジェトロ)アジア
経済研究所 / Institute of Developing
Economies, Japan External Trade Organization (IDE‑JETRO) http://www.ide.go.jp
journal or
publication title
IDE Discussion Paper
volume 254
year 2010‑09
URL http://hdl.handle.net/2344/916
INSTITUTE OF DEVELOPING ECONOMIES
IDE Discussion Papers are preliminary materials circulated to stimulate discussions and critical comments
IDE DISCUSSION PAPER No. 254
The Determinants of Rural Electrification in Bihar, India
Hisaya Oda * and Yuko Tsujita **
September 2010
Abstract
This paper explores intra-state disparity in access to electricity and examines the determinants of electrification at the village level in Bihar, one of the underdeveloped states in India. Our field survey of 80 villages in 5 districts conducted in 2008-09 found that 48 villages (60%) are electrified when using the definition of electrification that a village is electrified if any one household in the village is connected to electricity. The degrees of
“electrification” in terms of the proportion of household connection and available hours of electricity remain by and large low, and at the same time differ across districts, villages and seasons. In the processes of electrification, approximately 40% of villages have been electrified in recent years. Based on the basic findings of the survey, this paper examines the electrification processes and how it has changed in recent years. The econometric analyses demonstrate that location is the most important determinant of a village’s electricity connection. Another important finding is that with the rapid progress of rural electrification
* Ritsumeikan University ([email protected])
**Corresponding author, Institute of Developing Economies
(Yuko_Tsujita @ide.go.jp)
under the recent government programme and the tendency to connect the villages which are easily accessible, the collective bargaining power of the village, which used to significantly affect the process of electrification, has lost influence. This adversely affects remote villages. In order to extend electricity supplies to remote and geographically disadvantaged villages, the government needs to consider seriously other options for sustainable electricity supply, such as decentralized distribution of electricity rather than the conventional connection through the national/local grids.
Key words: Rural electrification, Bihar, India JFE classification: H41, O20, Q40,
The Institute of Developing Economies (IDE) is a semigovernmental, nonpartisan, nonprofit research institute, founded in 1958. The Institute merged with the Japan External Trade Organization (JETRO) on July 1, 1998.
The Institute conducts basic and comprehensive studies on economic and related affairs in all developing countries and regions, including Asia, the Middle East, Africa, Latin America, Oceania, and Eastern Europe.
The views expressed in this publication are those of the author(s). Publication does not imply endorsement by the Institute of Developing Economies of any of the views expressed within.
INSTITUTE OF DEVELOPING ECONOMIES (IDE), JETRO 3-2-2, WAKABA,MIHAMA-KU,CHIBA-SHI
CHIBA 261-8545, JAPAN
©2010 by Institute of Developing Economies, JETRO
No part of this publication may be reproduced without the prior permission of the IDE-JETRO.
The Determinants of Rural Electrification in Bihar, India1
Hisaya Oda
Faculty of Policy Science, Ritsumeikan University, Japan and
Yuko Tsujita
Area Studies Center, Institute of Developing Economies, Japan
1. Introduction
Electricity is an essential commodity in the modern era for enjoying the quality of life, and at the same time it is an indispensable input in economic and social development. Despite its importance, access to electricity is limited in many developing countries. In 2005, 1.569 billion people in developing countries lived everyday without electricity (IEA, 2006). This roughly corresponds to one-third of the population living in developing countries. Access to electricity is especially limited in rural areas, where the majority of the population resides.
The economic and social benefits that electricity brings to rural areas are manifold (see Barnes 1988 for a detailed survey). In terms of economic benefits, electricity can be used for irrigation pumps, processing agricultural outputs, storing perishable agricultural goods, and so on. It also makes it possible for rural entrepreneurs to start small businesses. As for the social benefits, electricity allows kids to study at night; it contributes to health as switching from biomass fuels to electricity produces clearer indoor air (Barnes et al. 1997; UNDP/WHO, 2009);
it gives rural populations opportunities to access telecommunications and mass media (Andreas, 2006). Furthermore, electricity usage has a documented positive impact on women’s lives in rural areas as using electricity in their daily routine, such as for cooking and pumping water, gives them more free time for other activities (UNDP/World Bank, 2004). Thus, the provision of electricity has positive impacts on the lives of rural populations where poverty remains widespread. Because of the diverse nature and extent of the socio-economic benefits of electricity in rural areas, rural electrification is a critical issue for governments in developing countries.
In India, rural electrification has been an important policy agenda for the central as well as
1 We are deeply indebted to Shaibal Gupta, and Prabhat P Ghosh for their invaluable advice and comments to our studies. We are also grateful to Sudip Pandey, Shivnath Yadav, Shashi Ranjan Kumar and other field team members for their collaboration and help in the field survey.
Any error remains solely our responsibility.
1
the state governments since independence2. In the early periods, government focus was placed mainly on the electrification of irrigation pumps for raising agricultural productivity (Bhattacharyya, 2006). This was particularly so when the green revolution took off in the late 1960s. However, there has been a change of direction toward more social purposes as rural electrification has started to assume social roles. In 1947 only about 1,500 villages were electrified (Government of India, 2010). By the end of March 2010, close to 500 thousand villages in India, around 84% of the total, have been electrified. In particular, the number of electrified village has increased rapidly in recent years due in part to government efforts under the accelerated rural electrification programme and initiatives for “Inclusive Growth”, which aim at both rapid growth and social justice.
At the aggregate level, the increase of the number of electrified villages is impressive;
however, there are still many un-electrified villages, and there exists a wide inter-state disparity among richer and poorer states in access to electricity. For example, in advanced states such as Punjab and Haryana, nearly all the villages had been already electrified by the early 1970s, while the rate of village electrification still remains low in the underdeveloped states in the eastern part of India, such as Bihar and Orissa. In fact, electrification at the village level in the advanced states is no longer an issue though the challenge of access to electrification at the household level remains. Meanwhile, it is still a daunting task in the underdeveloped states, where higher poverty rates prevail. These underdeveloped states also face a critical issue in the imbalance between “haves” and “not haves”. It does matter whether a village can or cannot have electricity connections because of the disparity it creates between electrified and un-electrified villages even within a state where the level of development is already low.
An interesting research question here is whether there are any differences between electrified and un-electrified villages. If so, what characteristics of the village influence the authority’s decision to electrify the village? Though electrification of a village does not mean electrification of all households in the village (and the gap is substantial in several states), the legitimacy of analyzing at the village level lies in that the village is the most important unit of the rural society in India, and village electrification is a prerequisite to household electrification.
Despite the importance that India has given to electrification in rural areas, and the priority given to it in policy formulation at both the central and state government levels, there is a scarcity of literature on the issue. To our knowledge there is little more than the two studies by Kemmler Andreas, one which examines the factors influencing rural electrification at the village level (Andreas, 2006), and the other examining those factors at the household level (Andreas, 2009). These studies are based on the 2001 Census data, and the 55th National Sample Survey
2 Electricity in the Constitution of India is listed in the concurrent list, in which responsibility is shared both by central and state governments.
2
(1999-00) data respectively. These two studies have examined the issues in detail, and provide a lot of insights. However, the studies use cross-state data which lacks information on intra-state disparity, and they are also based on data from before the recent rural electrification programmes become active, after which we would expect some changes in the rate of village electrification.
Given the need to increase the literature on the subject, and considering the importance of rural electrification in India’s underdeveloped states, this paper examines Bihar, India’s most backward state, to analyze the determinants of electrification at the village level using the data collected from our field surveys conducted in five districts in Bihar in 2008-09. The paper looks in particular at the impact of village characteristics on electrification and changes before and after the activation of rural electrification projects initiated by the central government.
We would like to note in advance that there are limitations in this study. It presumes that electrification has a positive impact on economic and social development in rural areas.
However, there has been debate on this matter, such as the cost effectiveness of investment, the affordability for rural consumers, and regarding socioeconomic and environmental impacts (Barnes, 1988; Bhattacharyya, 2006). This study also does not take into account electricity generation capacities. In reality, there is a contradiction in the expansion of electrification to rural areas while the country’s generation capacity fails to meet existing electricity demand.
These are points that need to be scrutinized. Nevertheless, it is still important to examine the processes of rural electrification at village level in India’s underdeveloped areas.
The remainder of the paper is organized as follows. Section 2 briefly provides an overview of the current situation of electricity provision and the progress of rural electrification in India.
Section 3 describes the current economic situation in Bihar and the details of the surveyed villages. Section 4 examines the determinants of electrification at the village level using econometric analyses to describe the influencing factors. Section 5 presents our concluding remarks.
2. A Brief Review of Issues over Access to Electricity in India 2.1 Electricity Consumption
Despite being the fifth largest producer of electricity, India faces multiple problems over access to electricity. One such problem is epitomized by the low availability of electricity per capita, reflecting India’s demand for and supply of electricity. Average per capita electricity consumption in 2007 stood at 543kWh3. This was low by international standards. For example,
3 The figure of India’s per capita electricity consumption is obtained from IEA (2009). There is a difference between this figure and the figure released by the Indian government, which is 717 in 2007-08 (Government of India, 2009). For a comparison with other countries, IEA’s figure is used here.
3
the average consumption was 8,477kWh in OECD countries, 705kWh in Asian countries, and 578kWh in African countries in 2007 (IEA, 2009). Among BRICs countries, the figure for India was the lowest and just one-fourth of China’s consumption (2,346kWh)4.
With population increase and economic expansion, the demand for electricity has been growing rapidly; however, the supply of electric power has always been insufficient, the power deficit always exceeding 10% at peak periods, and it was 12.7% in 2009-10 (Government of India, 2010). India still lacks a reliable electricity transmission network, causing loss of electricity due to inadequate infrastructure and making electricity exchanges across regions less efficient. Power theft is also rampant which adds additional burdens on electricity supplies. The amount of electricity loss taking place in transmission and distribution due to technical inefficiency and commercial loss including power theft rose to 38.86% in 2000-015. Although the percentage of loss has tended to decline in recent years, considerable amounts of electricity are disappeared before reaching genuine consumers. Behind all of these problems lies a serious institutional flaw in India’s power sector. This is the malfunction of State Electricity Boards (SEB), which have been the major entity supplying electricity to the state. Currently the disbandment and privatization of the SEB as well as the rationalization of its pricing scheme are underway. However, the problems are deeply rooted in socio-politically intricate matters and it will take time to redress issues.
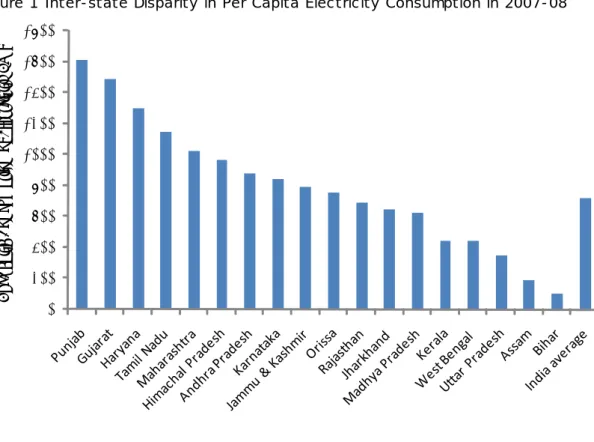
Another issue is the skewed distribution of electricity across states. As Figure 1 shows, states with a developed industrial sector or intensive irrigation networks tend to consume more, while backward states consume less. Among 16 major states, per capita electricity consumption of Punjab, Gujarat, Haryana, Tamil Nadu, and Maharashtra exceeded 1,000kWh in 2007-08. On the other hands, the figure was low in underdeveloped states such as Bihar where the per capita consumption was just 100kWh, less than one-sixteenth of Punjab’s figure. Related to this, Oda (2011) used the level of per-capita electricity consumption as the indicator of infrastructure development to show that differences in electricity consumption explain the differences in the growth rate of state economies, causing inter-state income disparities.
4 Per capita electricity consumption of Russia and Brazil are 6,338kWh and 2,154kWh in 2007 respectively (IEA, 2009).
5 The data is from the homepage of the Ministry of Power of India (http://www.powermin.nic.in/), accessed on 1 Sept. 2010. The T&D losses that include technical and commercial losses are defined as Aggregate Technical & Commercial (AT&C) losses.
4
Figure 1 Inter-state Disparity in Per Capita Electricity Consumption in 2007-08
Source: Indiastat.com (http://www.indiastat.com).
0 200 400 600 800 1000 1200 1400 1600 1800
Per Capita Consumption of Electricity(KWh)
2.2 Rural Electrification in India
The third issue is access to electricity in rural areas. As noted in section 1, electric supplies to the rural areas in the nation are critically important in terms of both economic and social benefits since around 70% of India’s total population live in the rural areas6. Here a cautionary note is necessary about the definition of electrification. In the beginning when the government placed an emphasis on the economic benefits of electrification, a village was defined as
“electrified” if electricity was used in the village for any purpose. For example, a village was labeled electrified if any of its irrigation pumps used electricity. However, as the social aspects of rural electrification came to weigh more, the main target of electrification shifted from villages to households. Accordingly the definition was changed in 1997 under which a village was defined as “electrified” when the electricity was used in an inhabitant locality. In 2004 the new and still current definition of rural electrification was introduced. Under it (1) at least 10%
of village households must be electrified, (2) basic infrastructure such as a transformer and distribution lines must be placed in the inhabited locality as well as the Dalit Basti hamlet, and
6 For example, the lack of access to electricity constrains the use of irrigation pumps, thereby reducing agricultural productivities. A study by the World Bank (2002) estimates that agricultural productivity has declined by 5% to 13% due to the lack of electricity, while village electrification yields 20 to 35 rupees per kWh.
5
(3) public facilities such as the school and Panchayat office must be electrified. This definition is considerably stricter than the original one, but it is still inadequate since the village can be said “electrified” even if only 10% of households have access to electricity as long as (2) and (3) are satisfied. Although the 2004 definition has come into effect, it seems that many of the official figures including those of the Ministry of Power still use the old definitions.
It also needs to be recognized that the current definition of electrification does not take into account of quality of electrification. As the following section will reveal, based on our field survey, electrification does not mean that villages or households are getting a reasonable supply of electricity. In the rural areas, the availability of electricity fluctuates from one village to another and from one day to another. It is common for a village to be supplied each day with only a few hours of electricity or none at all.
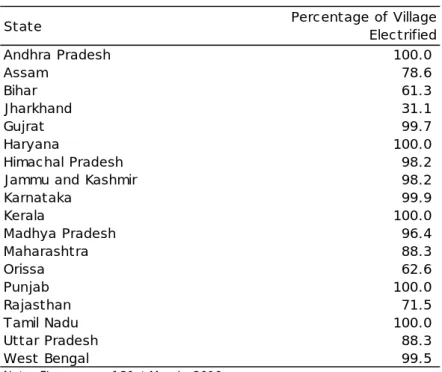
As of the end of March 2010, the government reported that 497,398 out of 593,015 villages in India had been electrified (Government of India, 2010) giving an 83.9% rate of village electrification. However, it is unclear which definition of electrification the government used, and our assumption is that it used the 1997 definition. While several states such as Andhra Pradesh, Punjab, and Haryana have attained 100%, the rates in Jharkhand (31.1%), Bihar (61.3%), and Orissa (62.6%) remain low (Table 1)7. Clearly there is a considerable gap in the progress of rural electrification between the developed and underdeveloped states causing inter-state as well as intra-state imbalances in terms of access to electricity, and hence economic and social disparities across and within states. As Table 1 shows, electrification at the village level is an issue only in a few states where the rate of village electrification remains low. With the new definition, the disparity becomes more evident. The rate of village electrification in Bihar, for example, declines to 30.2% from 61.3% under the new definition (Government of Bihar, 2010: 130-131), while the rates remain more or less the same in the developed states8. For these developed states, the challenge in terms of access to electricity has already shifted to the electrification of individual households.
7 Bihar was bifurcated into Bihar and Jharkhand in 2000.
8 For example, the number of electrified villages in Punjab declined slightly from 12,428 in 2003-04 to 12,278 in 2004-05 after adaptation of the new definition. In Haryana the number was not negatively affected and in fact increased from 6,759 in 2003-04 to 6,764 in 2004-05. In Bihar, the figure declined sharply to 20,006 from 48,166 over the same period (CMIE, 2010).
6
Table 1 Current Status of Electrification at the Village Level
State Percentage of Village
Electrified
Andhra Pradesh 100.0
Assam 78.6
Bihar 61.3
Jharkhand 31.1
Gujrat 99.7
Haryana 100.0
Himachal Pradesh 98.2
Jammu and Kashmir 98.2
Karnataka 99.9
Kerala 100.0
Madhya Pradesh 96.4
Maharashtra 88.3
Orissa 62.6
Punjab 100.0
Rajasthan 71.5
Tamil Nadu 100.0
Uttar Pradesh 88.3
West Bengal 99.5
Note: Figures as of 31st March, 2010.
Source: Ministry of Power's Homepage(http//www.powermin.nic.in).
With the First Five-year Plan (1951-56), the Indian government recognized the importance of rural electrification for the expansion of agricultural production by electrifying irrigation pumps and other agricultural equipments and raising the living standard of the rural population, however it was slow to get started on the problem. Under the Fifth Five-year Plan (1975-79), the government stepped up electrification with the start of its “Minimum Needs Program”. Later, other programs such as the “Kutir Jyoti Yojana (KJY: Bright Home Programme)” and “Pradhan Mantri Gramodaya Yojana (PMGY: Prime Minister’s Rural Electrification Programme)” were introduced9. Currently the PMGY has been discontinued, and the KJY has been merged with the
“Rajiv Gandhi Grameen Vidyutikaran Yojana (RGGVY: Rajiv Gandhi Rural Electrification Programme),” which started in April 2005 as part of the National Common Minimum Programme of the United Progress Alliance (UPA), the coalition government that came to power in 2004. Under the RGGVY, the central government provides a grant for 90% of the project, and the remaining 10% is loaned by the Rural Electricity Corporation to the state governments. As part of the goals of the RGGVY, the Indian government aims to electrify all households in the nation by 2012 (Power For All by 2012), which corresponds to the final year
9 Kutir Jyoti Yojana was introduced in 1988. Its main target was rural households below the poverty line. Pradhan Mantri Gramodaya Yojana was launced in 2000-01. Other programmes include the Accelerated Rural Electrification Programme (2003), and the Accelerated Electrification of One-Lakh Villages and One-Crore Households (2004), which have also been merged with the RGGVY.
7
of the 11th Five-year Plan (2007-08 - 2011-12). From the figures indicated for rural electrification, the programme is making progress (Figure 2). For the last five years from 2005-06 to 2009-10, about 72,000 villages were electrified.
Figure 2 Annual Number of Village Electrified since 1990-91
Note: The number of village electrified in 2009-10 is the figure up to 31st Jan, 2010.
The definition of electrification changed in 2004.
Source: Government of India (2010).
0 5000 10000 15000 20000 25000 30000 35000
3. Village-Level Electrification in Bihar 3.1. An Overview of Bihar State
Before presenting the details of our surveyed village and the state of electrification, we will briefly discuss the current situation of Bihar.
Bihar, with the latest estimated population of 94.5 million, is considered to be one of the underdeveloped states in India. Per-capita net state domestic product (NSDP) is the lowest among India’s states, only one third of the national level. Bordering on Nepal in the north, the state is prone to recurrent floods which affect more than 70% of the area and the population (Government of Bihar, 2008b). This has had an adverse impact on the state’s primarily agrarian economy. Due to colonial legacies (Frankel, 1989), the central government’s agricultural and industrial policies (Ghosh, 2011), and the negative interaction between the state’s politics and economy (Minato, 2011) among other reasons, the population of Bihar, approximately 90% of which reside in the rural areas, suffer from social and economic backwardness. The National Sample Survey in 2004-05 estimated that the incidence of poverty, defined as the percentage of
8
the population below the poverty line in terms of monthly per-capita expenditure, is 42.1% in rural Bihar, which is far higher than the 28.3% in rural India as a whole. The state has also lagged behind in social development. For example, the adult literacy rate (47.0%) in the Census of India 2001 is the lowest among all states, and the under-five mortality rate in Bihar (84.8) in the National Family Health Survey 2005-06 is much worse than the national average (74.3).
Not well acknowledged is that along with its underdevelopment, Bihar is suffering from growing intra-state disparity. The per-capita Gross District Domestic Product (GDDP) for Patna district, where the capital city of the state is located, is by far the highest among the state’s 38 districts. The difference has increased in recent years with the disparity in per-capita GDDP between Patna district and that of Sheohar district, which has the lowest GDDP in Bihar, increasing sharply from 3.3 times in 1998-99 to 8.5 times in 2006-07 (Government of Bihar, 2007; 2010). Worse still, the allocation of public expenditures on social and economic development has been extremely skewed to only one district, i.e. Patna district (See Government of Bihar, 2010). The disparity is also manifested in social strata and gender.
Scheduled Castes (SC) and Muslims, who make up approximately 15.7% and 16.5% of the state population respectively, are often regarded as socio-economically backward classes. The literacy rates in 2001, for example, clearly reveals the disparity across gender and caste within the state: 59.7% for males, 33.6% for females, 31.5% for Muslim females, 15.6% for SC females, and only 3.9% for female Mushar, one of the most deprived SCs in Bihar.
As already pointed out, the village electrification rate in Bihar was 61.3% under the 1997 definition of electricity being used in inhabited localities. However, that rate has fallen to only 30.2% under the new definition that at least 10% of village households are electrified (Government of Bihar, 2010: 130-131). The reasons for the slow progress of rural electrification relative to other states are manifold as discussed in section 2. Also the construction of power stations has been delayed. Under the Tenth Five-year Plan (2002-03 - 2007-08), 171 power sub-stations were planned for construction; however only 66 were built, and of these only 45 were generating electricity by the time of the Eleventh Five-year Plan (ibid.). There has been only a marginal increase in the length of T & D lines over the years. Meanwhile, T & D losses as a percentage of electricity availability have gradually increased, reaching 51% in 2006-07 and 49% in 2007-08 (CMIE, 2010: 185), as opposed to the gradual decline in these losses for the entire country.
3.2. Selection of Surveyed Villages in Bihar
In order to investigate the current situation in rural electrification, we carried out a village-level survey in 80 villages in 2008-09. We selected the surveyed villages as follows, based on the three-tiered rural self-government system in Bihar (pancyayat system) of district, block and
9
village (gram). First, we selected five districts, one each from the five groupings of districts, in accordance with their rankings for the livelihood potential index. This index is based on the availability of land per rural household, cropping intensity, agriculture productivity, bovine per thousand capita and the percentage of urban population (for details see ADRI, undated). Next we randomly selected four blocks in each district, then four Gram Panchayats (GP) in each block. Finally, we selected the revenue village during our field visit, after reaching the GP. One revenue village was selected in each GP based on two criteria: (1) the caste composition and (2) population size that best represented the particular GP. Our interviews were mainly with mukhiyas (the head of a GP) and/or village leaders.
3.3. Electrification Processes in the Surveyed Villages
For our analysis we adopted the government’s old definition of electrification, i.e. a village is regarded as electrified if any household is electrified. We found that 48 out of the 80 villages (60.0%) were electrified. This figure roughly coincides with the latest official figure for village electrification (61.3%). More developed districts were likely to be electrified; all 16 villages (100%) in Rohtas district had electricity compared to only 5 villages (41.7%) in Kishanganj district.
The pace of electrification picked up noticeably after 2005, i.e. 41.7% of villages were electrified after that year (Table 2)10. In the survey, seven villages pointed out that access to electricity was one of the three most important reasons why the villages were relatively better off than ten years ago (for details see Hirashima et al. 2011). All these villages were electrified after 2007. The recent rapid expansion of village electrification can be explained, as we have pointed out, by the accelerated efforts of the central government’s RGGVY scheme launched in April 2005. This scheme offers better financial conditions for state governments than similar earlier programmes. At the same time, the new state government in Bihar, which came to power in the state assembly election at the end of 2005, is more committed to development programmes than was the previous government. During the 1990s and the first half of 2000s, Bihar’s electrification process had been slow, as the state government of that time had put insufficient priority on development. The state was ironically known as the jungle raj since it suffered from chronic poverty, caste-based violence, deficient law and order, and rampant corruption. Electricity was an example of the state’s poor performance. The growth rate of total energy availability in 1990-91 to 2000-01 (62.9%) was less than that in 1980-81 to 1990-91 (78.0%) (CMIE, 2010: 184). The length of T& D lines in the state in 1990-91 was 175,270 Ckt.
10 It should be noted that state assembly elections were held twice in 2005. Due to the model code of conduct, there was little expenditure that year on development activities. In fact, only one village in the survey was electrified in 2005.
10
Km; it was still only 177,567 Ckt. Km in 2000-01 when the Bihar was bifurcated into two states (CMIE, 2010: 187). According to the government, which we again assume used the 1997 definition of electrification, only 427 villages were electrified from 1992-93 to 2000-01, while the number of electrified villages had more than doubled in the previous decade (ibid.).
As noted in the previous section, an “electrified village” does not mean that all the households are provided with electricity. The proportion of electrified households, in fact, remains low in most villages. Except for two villages in Rohtas district, only a limited number of households in the surveyed villages benefitted from electricity. Only a quarter of the villages were able to distribute electricity to more than half of the households, and on average the proportion of electrified households was only 31.9% (Table 3). In four villages the proportion was even less than 10% of village households11. As we have pointed out, public facilities such as school ought to be electrified under the new definition of electrification. We found that only four out of 80 government primary or middle schools in the surveyed villages were electrified.
No access to electricity adversely affects children’s learning at school, such as dark classrooms, less concentration on learning due to the lack of air-conditioning facility, no provision of electric gadgets for enhancing understanding of studies and so on. The lack of electrified schools also means that the number of “electrified” villages would be much less than 48 if the new definition of electrification is adopted.
The quality of electricity in terms of available hours also varied from village to village.
Table 4 shows a dismal picture. On average, it was only 6.3 hours in good months and 1.3 hours in bad ones. For three out of five districts, the average was less than one hour in bad months.
Interestingly, we found no clear association between the length of years a village had been electrified, the proportion of households electrified and the hours of availability power.
Kishanganj district was the lowest in terms of the proportion of electrified villages and households among all the surveyed districts; however, the available hours of electricity was the highest of all the districts. There was only one village where around-the-clock- electricity was available in good months, and that was located in Kishanganj district. At the same time the proportion of electrified households in that particular village remained at only 20%, even though the village had been electrified back in the year 1990. One of the two villages where all households had access to electricity had been electrified in 1966, while the other was in 2008.
However, both villages could enjoy only three hours a day of electric power even in the best months.
Our survey investigated the primary source of lighting in villages (respondents could give up to two answers). In 46 of the 48 electrified villages, kerosene was considered the primary source of lighting, followed by electricity in 40 villages. This suggests that electricity becomes a
11 For example, we came across a village where only the mukhiya’s house was electrified.
11
primary source of lighting once it is available to a certain proportion of households and for a reasonable number of hours. The electrified villages which still mainly depended on kerosene (7 villages) were ones where very limited hours of electricity was available even in good months, or the percentage of electrified households was small. On the whole, the survey showed that village-level electrification has accelerated in recent years; at the same time, however, it clearly showed that differences exist in quality and quantity of electricity across districts, villages and seasons.
Table 2 Chronology of Village Electrification in Surveyed Villages in Bihar
District Rohtas Kishanganj Bhagalpur Madhubani East
Champaran Total
No. of surveyed villages 16 16 16 16 16 80
No. of electrified villages 16 5 10 9 8 48
1950s 0 0 0 0 2 2
1960s 3 0 1 0 0 4
1970s 4 1 1 1 0 7
1980s 0 1 1 1 2 5
1990-2004 1 1 2 3 3 10
After 2005 8 2 5 4 1 20
Source: IDE-ADRI Survey 2008-09.
Year of electrification (no. of villages)
Table 3 Proportion of Electrified Households in Electrified Villages in Bihar
District Rohtas Kishanganj Bhagalpur Madhubani East
Champaran Total
Less than 10% HH 1 0 1 1 1 4
10-49% HH 9 5 5 6 7 32
50-99% HH 4 0 4 2 0 10
100% HH 2 0 0 0 0 2
No of electrified villages 16 5 10 9 8 48
Average(%) 39.1 18.5 37.8 24.4 26.6 31.9
Source: Same as Table 2.
Table 4 Available Hours of Electricity Supply in Electrified Villages in Bihar (hours per day)
District Rohtas Kishanganj Bhagalpur Madhubani East
Champaran Total
No of electrified villages 16 5 10 9 8 48
In good months Mean 4.6 16.6 5.5 7.1 3.1 6.3
SD 2.7 5.9 4.7 5.9 2.2 5.5
Max 12.0 24.0 18.0 20.0 6.0 24.0
Min 1.0 10.0 1.0 1.0 1.0 1.0
In bad months Mean 0.7 4.0 0.6 2.4 0.1 1.3
SD 0.8 4.7 1.2 3.8 0.4 2.8
Max 2.0 10.0 4.0 10.0 1.0 10.0
Min 0.0 0.0 0.0 0.0 0.0 0.0
Source: Same as Table 2.
12
4. Estimation and Results 4.1. Methodology
In order to examine the determinants of electrification at the village level, we consider the following framework. First, we assume that the utility from choice (j) of electrifying village i for the state authorities depends on the characteristics of the village, and is given by:
where is a vector of explanatory variables, is a vector of parameters, and is the error term. Choice j is either electrifying the village (j=1) or not electrifying it (j=0).
Then define
, and assume
The authorities choose electrifying the village when and not electrifying when . is a latent variable or unobserved, but we can observe the authorities’ choice of either electrifying the village or not. We denote when the village is electrified ( ) and
otherwise. The probability of choosing is given by:
where is the standard normal cumulative density function.
In order to estimate the above model, we employ a Probit estimation technique. The dependent variable is a binary variable indicating whether the village is electrified or not. The value of the dependent variable takes 1 if the village is electrified and 0 otherwise. The explanatory variables are the characteristics of the village, consisting of the number of households, social classes, geographical conditions, and the degree of cohesion of the village.
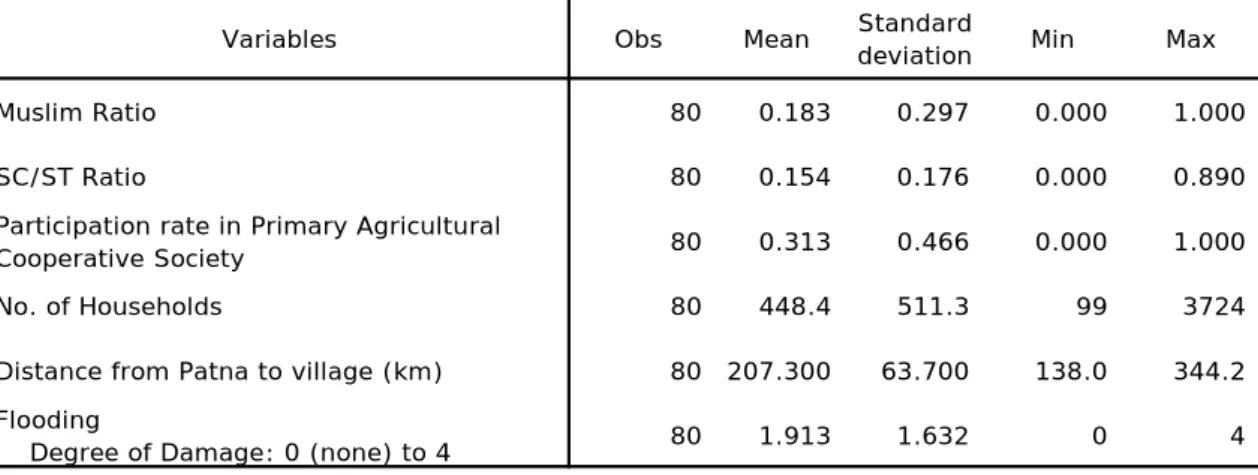
The number of households is included to see if the size of the village matters in the process of electrification. The social class variables include the ratios of SC/ST and Muslim households in the village. The purpose of testing these variables is to examine the impact of social characteristics of the village on electrification. The geographical variables are the kilometer distance from Patna, the capital of Bihar State, to the village, and the degree of damage caused by flooding, ranging from 0 (none) to four (the heaviest). These variables are included in order to account respectively for the remoteness or accessibility of the village and its proneness or vulnerability to natural disaster. For the cohesion variable, we use the rate of participation in the primary agriculture cooperative society. We include this to account for the possible influence of collective action on electrification. A summary of the statistics of variables is given in Table 5.
What became evident from the chronology of electrification of the surveyed villages was that slightly over 40% of he villages were electrified after the introduction of the RGGVY in 2005. Therefore we ran another regression to see if we could find any differences in the process of rural electrification before/after the RGGVY programme was launched. We modified the
13
dataset above by treating all the villages electrified after 2005 as un-electrified, and repeat the same estimation. Using the new data created in such a way, we were able to estimate the determinants of village-level electrification before 2005 and could compare them with the results previously obtained.
Table 5 A Summary of Descriptive Statistics of Sample
Variables Obs Mean Standard
deviation Min Max
Muslim Ratio 80 0.183 0.297 0.000 1.000
SC/ST Ratio 80 0.154 0.176 0.000 0.890
Participation rate in Primary Agricultural
Cooperative Society 80 0.313 0.466 0.000 1.000
No. of Households 80 448.4 511.3 99 3724
Distance from Patna to village (km) 80 207.300 63.700 138.0 344.2 Flooding
Degree of Damage: 0 (none) to 4 80 1.913 1.632 0 4
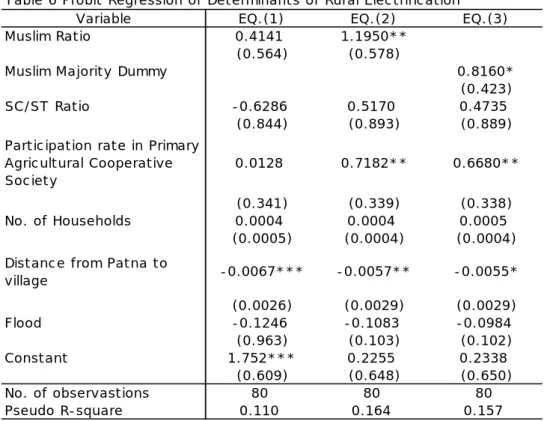
4.2. Estimation Results
The results are presented in Table 6. The column under EQ (1) shows the estimated parameters based on our 2008-09 survey. The only significant factor is the distance from Patna to the village, the geographical variable. It is negative and statistically significant, meaning that the location of the village does matter in electrification. In essence, this result is consistent with the findings of Andreas (2007; 2009). Villages in remote areas tend to be un-electrified due to cost ineffectiveness and the technical difficulties in electricity connection. In particular, several studies have pointed to the fact that the cost of supplying electricity through a conventional grid connection increases considerably as the distance from the grid to the village increases (Chakrabarti and Chakrabarti, 2002). Certainly remoteness is not financially attractive to electricity providers. This has activated the discussions on the supply of electricity through off-grid options (Banerjee, 2006; Cust et al. 2007). Even the government of Bihar has documented the possibility to generate electricity through non-conventional energy sources such as solar power and wind power generation on location in order to avoid the supplying of electricity through costly and technically difficult grid connections (Government of Bihar, 2008a)12.
The impact of the degree of damage caused by flooding, another geographical variable, is
12 Government of Bihar (2008a) reports, “Many villages are located in remote areas. It may not be feasible to electrify these villages through conventional grid due to the absence of load development in the near future…”. In fact, a couple of solar lights on streets as a part of grant by the Twelfth Finance Commission have been installed in the 90% of the surveyed villages.
14
negative as expected since it might be associated with technical difficulties, but it is not statistically significant. This insignificancy may arise from the fact that the degree of damage is subjective and it differs from village to village even if villages are hit to the same degree. The size of the village in terms of household numbers does not have a significant explanatory power either. From the viewpoint of cost effectiveness, the village with a large number of households would be preferred because of the number of potential electricity consumers (Andreas, 2006).
Although the estimated parameter is positive, the tendency to favor larger villages was not systematically observed in the surveyed villages probably because cost effectiveness might be a secondary issue for the State Electricity Board, which has been accustomed to chronic deficits.
The estimates of variables representing social classes are not significant. Prior to running this estimation, we had expected that villages with a higher ratio of ST/SC and/or Muslim would tend to be un-electrified because of their weak social status. However, the results show no such tendency. Likewise, the participation rate of villagers in the primary agricultural cooperative society does not have explanatory power. We will come back to these after presenting the results of the next estimation.
The column under EQ (2) shows the results of the estimation on the determinants of rural electrification before 2005. As in the previous estimation, the estimated parameter of the distance variable is negative and statistically significant while that of the flooding variable is negative but not significant. Other significant parameters are the ratio of Muslims in the village, which has a statistically significant positive impact on electrification, as does the participation rate of villagers in the primary agriculture cooperative society. Both explanatory variables have the same signs but are not significant in column EQ (1).
A reason for the significantly positive impact of the ratio of Muslims might be the increased political participation of socially backward classes. Banerjee and Somanathan (2007) point out that the political success of socially backward groups has an influence on the provision of infrastructure. Their point in the present context is that villages with socially backward but politically integrated groups (Muslims in this case) are more likely to be electrified than those with socially backward groups having no political power (SCs in this case). This becomes evident from a detailed examination of the data. Among 16 villages electrified before 2005, seven had a predominantly Muslim population. Muslims might have exercised their collective power to influence the decision on village electrification. Assuming a correlation between Muslim population and the BPL, Muslims took advantage of the Kutir Jyoti Yojana (Bright Home Programme) launched in 1988, which targetted the BPL population for access to electricity. Although it was reported that the programme had not been highly successful (Bhattacharyya, 2006), Muslims who had collective powers might have benefitted from it. This result can be verified by using a Muslim dummy variable (which takes 1 if the Muslim
15
population in the village is the majority and 0 otherwise) instead of using the Muslim population ratio in the village. The result in the column under EQ. (3) shows that the estimated parameter of the Muslim dummy is positive and significant. On the other hand, SCs made up minor groups in the surveyed villages. Out of the 80 surveyed villages, SCs were a majority in three villages, only one of which was electrified before 2005. This difference in terms of collective power may explain the differing impact of Muslim and SC ratios on village electrification. By the same token, the effect of the participation ratio of villagers in the primary agriculture cooperative society can be explained in the following manner. As the ratio increases, the village becomes more united on the demand for electricity. Considering that the villagers who belong to the cooperative society are farmers, they are especially keen on having electricity for irrigation pumps and other agricultural activities. As they directly affect agricultural productivity, farmers exercise their bargaining power for the electrification of their village13.
Given the above, it is necessary to explain why the impact of Muslims and the participation rate in agriculture cooperatives turned to non-significant in the 2008-09 data. This was due in part to the rapid expansion of village electrification under the RGGVY. In Bihar the number of villages electrified in 2004-05, just before the introduction of the RGGVY, was 134; this increased to 1,600 in 2005-06 and to 8,415 in 2006-0714(Government of India, 2010). Along with the better financial terms provided by the RGVVY, both the central and state governments have committed themselves to “Inclusive Growth”. This is the much advertized slogan of the Eleventh Five-year Plan which is aimed at growth and social justice. During this rapid expansion, the state government has targeted in the main easily accessible villages in order to increase the number of electrified villages as they can be connected to the nearest grid in less time and at less cost. This has left out other considerations including the pressure from collective action, which has diluted the positive impact of Muslims and the rate of participation in primary agriculture cooperative society that was observable before the introduction of the RGGVY. The result has been the non-significant impact of these factors after 2005.
13 However, the expansion of electrified villages in Bihar was slow, causing stagnant agricultural output (Kishore, 2004).
14 Similar to note 10, one national lower house of parliament election and one state assembly election were held in the year 2004-05. As a cautionary note, development activities in 2004-05 were relatively limited due to the model code of conduct; however, there is still no doubt that the RGGVY boosted rural electrification in Bihar.
16
Variable EQ.(1) EQ.(2) EQ.(3)
Muslim Ratio 0.4141 1.1950**
(0.564) (0.578)
Muslim Majority Dummy 0.8160*
(0.423)
SC/ST Ratio -0.6286 0.5170 0.4735
(0.844) (0.893) (0.889)
Participation rate in Primary Agricultural Cooperative Society
0.0128 0.7182** 0.6680**
(0.341) (0.339) (0.338)
No. of Households 0.0004 0.0004 0.0005
(0.0005) (0.0004) (0.0004) Distance from Patna to
village -0.0067*** -0.0057** -0.0055*
(0.0026) (0.0029) (0.0029)
Flood -0.1246 -0.1083 -0.0984
(0.963) (0.103) (0.102)
Constant 1.752*** 0.2255 0.2338
(0.609) (0.648) (0.650)
No. of observastions 80 80 80
Pseudo R-square 0.110 0.164 0.157
Table 6 Probit Regression of Determinants of Rural Electrification
* indicates significance at 10% level; ** indicates significance at 5% level; ***
indicates significance at 1% level; standard errors appear in parentheses.
5. Concluding Remarks
This paper has taken up the issue of intra-state disparity in access to electricity. It examined the determinants of electrification at the village level using Bihar, one of the underdeveloped states in India, as a case study. The data from our field survey of 80 villages in five districts conducted in 2008-09 showed that 48 villages were electrified, meaning that any one household in the village was connected to electricity. The data noted that a little over 40% of these were electrified in recent years. Differences in terms of the number of household connections and the available hours of electricity were clear across districts, villages and seasons. The econometric analyses demonstrated that the location of a village is the most important determinant of electricity connection, and concluded that villages in remote areas tend to have less access to electricity. This is because electricity is supplied through a grid to the village, and as a result, villages closer to the grid are more easily connected for technical and financial reasons. Another important finding is that due to the rapid progress of rural electrification under the RGGVY and the tendency to connect the villages which are easily accessible, the collective bargain power of the village, which used to significantly affect the process of electrification, has lost its influence.
This implies a seriously adverse effect on remote villages; for no matter how hard the villagers may demand through collective action the electrification of their village, they are unlikely to be
17
18
heeded. While the electrification programmes so far have succeeded in covering around 60% of all villages in Bihar, the difficult task lies ahead as remote and geographically disadvantaged villages are still left without electricity. In order to extend electricity supplies to these villages, the government needs to consider seriously other options for sustainable electricity supply such as the decentralized distribution of electricity rather than the conventional connection through the national/local grids. This is particularly so in the northern part of Bihar, given that those areas are more vulnerable to recurrent floods.
The multiple benefits of electrification on development are well known. One of the important implications for Bihar’s development is that rural electrification would trigger the growth of state’s stagnated agriculture by reducing the cost of irrigation and improving agriculture related facilities, notably processing and storage15. Our survey, though not discussed in detail here, found that electrified villages tended to have more irrigated land, which positively affected agricultural activities. We also found that rural development programmes are more likely to be implemented in electrified villages (See Hirashima et al. 2011 for details)16. As being implemented at present, electrification will intensify intra-state disparity in other spheres of social and economic development. Unless the existing pattern of the rapid electrification of villages near to urban centres can be modified, public investment in rural electrification with social objectives will paradoxically reinforce the existing socio-economic disparity within the state, districts and villages. Our findings on the electrification processes in Bihar provide important implications for pursuing processes of inclusive growth that can benefit every section of the underdeveloped state in India.
15 The Eleventh Five-year-Plan emphasizes that energized pump-sets will make a great difference in the ability of farmers in eastern states to utilize ground water at more reasonable costs (Government of India, 2008, p.8)
16 The possible reasons include (1) Electric gadgets increase information and raise awareness about development programmes, and (2) The construction of solid-structured houses and toilets that are two different components of development programmes is more likely to be demanded by households in electrified villages.
References
Andreas, Kemmler 2006. “Regional disparities in electrification of India – do geographic factors matter?” CEPE Working Paper No. 51. Centre for Energy Policy and Economics, Swiss Federal Institute of Technology.
Andreas, Kemmler 2009. “Factor Influencing Household Access to Electricity in India,” Energy for Sustainable Development, Vol. 11 (4), pp.13-20.
Asian Development Research Institute (ADRI) Undated. Poverty and Social Assessment: A Districtwise Study of Bihar, Sponsored by Bihar Rural Livelihood Promotion Society Patna, mimeo.
Banerjee, Abhijit, and Rohini Somanathan 2007. “The Political Economy of Public Goods:
Some Evidence from India,” Journal of Development Economics, Vol.82, pp. 287-314.
Banerjee, Rangan 2006. “Comparison of Options for Distributed Generation in India,” Energy Policy, Vol. 34 (1), pp. 101-111.
Barnes, D.F. 1988. Electric Power for Rural Growth: How Electricity Affects Rural Life in Developing Countries, Boulder, Colorado: Westview Press,
Barnes, D.F., R. van der Plas, and W. Floor 1997. “Tackling the Rural Energy Problem in Developing Countries,” Finance and Development, Vol. 34 (2), pp. 11-15.
Bhattacharyya, S.C. 2006. “Energy Access Problem of the Poor in India: Is Rural Electrification a Remedy?” Energy Policy, Vol. 34 (18), pp. 3387–3397.
Centre for Monitoring Indian Economy (CMIE) 2010. Energy, Economic Interference Service, March 2010.
Chakrabarti, S. and S. Chakrabarti 2002. “Rural Electrification Programme with Solar Energy in Remote Region-a Case Study in an island,” Energy Policy, Vol. 30 (1), pp.33-42.
Cust, J., A. Singh, and K. Neuhoff 2007. “Rural Electrification in India: Economic and Institutional Aspects of Renewables,” Cambridge Working Papers in Economics No. 0763, Faculty of Economics, University of Cambridge.
Frankel, F. R. 1989. “Caste, Land and Dominance in Bihar: Breakdown of the Brahmanical Social Order,” in Frankel, F. R. and M.S.A. Rao eds. Dominance and State Power in Modern India: Decline of a Social Order, Vol. 1, Delhi: Oxford University Press.
Government of Bihar 2007 Economic Survey 2006-07, Department of Finance, March 2007.
Government of Bihar 2008a. Economic Survey 2007-08, Department of Finance, March 2008.
Government of Bihar 2008b. Memorandum to the Thirteenth Finance Commission, Department of Finance, December 2008.
Government of Bihar 2010. Economic Survey 2009-10, Department of Finance, March 2010.
Government of India 2008. Eleventh Five Year Plan 2007-12. Volume I Inclusive Growth, 19
20
Planning Commission, New Delhi: Oxford University Press.
Government of India 2009. All Indian Electricity Statistics-General Review-2009, Central Electricity Authority, Ministry of Power.
Government of India 2010. Annual Report 2009-10, Ministry of Power.
Ghosh, P. P. 2011. “Inter-state Disparity in India and Development Strategies for Backward States,” in S. Hirashima, H. Oda, and Y. Tsujita eds. Inclusiveness in India: A Strategy for Growth and Equality, Basingstoke and New York: Palgrave Macmillan, forthcoming.
Hirashima, S., H. Oda and Y. Tsujita 2011. “Introduction: Inclusive Growth in India,” in S.
Hirashima, H. Oda, and Y. Tsujita eds, Inclusiveness in India: A Strategy for Growth and Equality, Basingstoke and New York: Palgrave Macmillan, forthcoming.
International Energy Agency (IEA) 2006. World Energy Outlook 2006, Paris, France.
International Energy Agency (IEA) 2009. Key World Energy Statistics, Paris, France.
Kishore, Avinash 2004. “Understanding Agrarian Impasse in Bihar,” Economic and Political Weekly, Vol. 39 (31), pp. 3484-3491.
Minato, Kazuki 2011. “Historical Origins of Underdevelopment and a Captured Democracy: An Analytical Narrative of Bihar,” in S. Hirashima, H. Oda, and Y. Tsujita eds. Inclusiveness in India: A Strategy for Growth and Equality, Basingstoke and New York: Palgrave Macmillan, forthcoming.
Oda, Hisaya 2011. “Infrastructure, Economic Growth and Income Disparity: A Case of India,”
in S. Hirashima, H. Oda, and Y. Tsujita eds. Inclusiveness in India: A Strategy for Growth and Equality, Basingstoke and New York: Palgrave Macmillan, forthcoming.
World Bank 2002. India: Power Sector Reforms and the Poor, Washington D.C. :World Bank, UNDP and World Bank/Energy Sector Management Assistance Program (ESMAP) 2004. The
Impact of Energy on Women’s Lives in Rural India, UNDP/ World Bank.
UNDP and World Health Organization (WHO) 2009. The Energy Access Situation: A Review Focusing on the Least Developing Countries and Sub-Sahara Africa.