Survey on logistics cost in Vietnam
著者 Ishida Masami, Vo Thi Minh Le, Ikebe Ryo
権利 Copyrights 日本貿易振興機構(ジェトロ)アジア
経済研究所 / Institute of Developing
Economies, Japan External Trade Organization (IDE‑JETRO) http://www.ide.go.jp
journal or
publication title
IDE Discussion Paper
year 2019‑03
URL http://hdl.handle.net/2344/00050764
INSTITUTE OF DEVELOPING ECONOMIES
IDE Discussion Papers are preliminary materials circulated to stimulate discussions and critical comments
Keywords: Logistics Cost, Vietnam, Transportation Cost, Container, Round Trip, Ha Noi, Ho Chi Minh City, Da Nang
JEL Classification: L91, O53, R40
1. Director General of Development Studies Center, IDE-JETRO ([email protected]).
2. Deputy Director of Center for Greater Mekong Subregion Cooperation Studies of Institute of World Economics and Politics, Viet Nam Academy of Social Science (IWEP-VASS).
3. Associate Professor, School of Commerce, Senshu University, Tokyo.
IDE DISCUSSION PAPER No. 743 Survey on Logistics Cost in Vietnam
Masami Ishida1, Vo Thi Minh Le 2 and Ryo Ikebe 3 March 2019
Abstract: This paper analyzes transportation time and costs for domestic and international cargo in Vietnam by using a questionnaire and interview survey of 19 freight forwarders. The cargo route between Ha Noi and Ho Chi Minh City is one of the primary logistics pathways in Vietnam, with logistics costs from Ho Chi Minh City to Ha Noi being higher than that in the opposite direction. For freight forwarders in Vietnam, there are four options: road, railway, ship, and air. In this paper, we compare the transportation time and costs for each mode of transport. For international logistics, cross-border costs such as customs clearance fees are still higher, but the time required for cross-border procedures has shown improvements at borders between Vietnam and Laos. Our survey results also show that the price difference for transporting a 20-foot container versus a 40-foot container by ship is significant, whereas the costs are not different for road transport.
The Institute of Developing Economies (IDE) is a semigovernmental, nonpartisan, nonprofit research institute, founded in 1958. The Institute merged with the Japan External Trade Organization (JETRO) on July 1, 1998. The Institute conducts basic and comprehensive studies on economic and related affairs in all developing countries and regions, including Asia, the Middle East, Africa, Latin America, Oceania, and Eastern Europe.
The views expressed in this publication are those of the author(s). Publication does not imply endorsement by the Institute of Developing Economies of any of the views expressed within.
INSTITUTE OF DEVELOPING ECONOMIES (IDE), JETRO 3-2-2, WAKABA,MIHAMA-KU,CHIBA-SHI
CHIBA 261-8545, JAPAN
©2019 by Institute of Developing Economies, JETRO
No part of this publication may be reproduced without the prior permission of the IDE-JETRO.
Survey on Logistics Costs in Vietnam
Masami Ishida, Vo Le Thi Minh, and Ryo Ikebe1
Abstract
This paper analyzes transportation time and costs for domestic and international cargo in Vietnam by using a questionnaire and interview survey of 19 freight forwarders. The cargo route between Ha Noi and Ho Chi Minh City is one of the primary logistics pathways in Vietnam, with logistics costs from Ho Chi Minh City to Ha Noi being higher than that in the opposite direction. For freight forwarders in Vietnam, there are four options: road, railway, ship, and air. In this paper, we compare the transportation time and costs for each mode of transport. For international logistics, cross-border costs such as customs clearance fees are still higher, but the time required for cross-border procedures has shown improvements at borders between Vietnam and Laos. Our survey results also show that the price difference for transporting a 20-foot container versus a 40-foot container by ship is significant, whereas the costs are not different for road transport.
Keywords: Logistics Cost, Vietnam, Transportation Cost, Container, Round Trip, Ha Noi, Ho Chi Minh City, Da Nang
JEL Classification: L91, O53, R40
Introduction
Vietnam is an elongated country from north to south and has two megacities, Ha Noi in the north and Ho Chi Minh City in the south. Both cities have large urban areas that serve as important commercial markets and production bases. Logistics are needed to transport goods and materials between factories and ports/airports, and to deliver domestic and imported commercial goods to shops and households. In Vietnam, the coastal inter-city
1 M. Ishida is Director General of Development Studies Center, IDE-JETRO; Vo Le Thi Minh is Deputy Director of Center for Greater Mekong Subregion Cooperation Studies of Institute of World Economics and Politics, Viet Nam Academy of Social Science (IWEP-VASS); and R. Ikebe is Associate Professor, School of Commerce, Senshu University. We express our thanks to Dr. Pham Anh Tuan, Director of International Economics; Mr. Dong Van Chung, Department of Transition Economies; and Ms. Thi Hong Nga, researcher at the Center for International Security and Strategy Studies of IWEP-VASS).
logistics along National Highway No. 1 is an interesting case to study, particularly between Ha Noi and Ho Chi Minh City, as consignors have four options for shipment:
road, railway, ship, and air.
Vietnam’s cross-border logistics with Cambodia, Laos, Thailand, and southern China have progressed with the development of three economic corridors through the Greater Mekong Subregion (GMS) Economic Cooperation Program (Ishida and Isono 2012; Ishida 2019). Outside of the GMS, trade with the United States, South Korea, Japan, and China are also important.
This paper shows the results of a survey on freight forwarders jointly conducted by the Institute of Developing Economies, Japan External Trade Organization (IDE-JETRO) and the Institute of World Economics and Politics, Vietnam Academy of Social Sciences (IWEP-VASS) in 2017. The survey primarily focused on fundamental aspects of logistics—the time required for transport and transportation costs for specific locations and modes of transport. This paper is composed of six sections. The first section reviews related literature. The second section outlines the framework of the survey and the key features of freight forwarders selected for inclusion in the survey. The third section describes the domestic logistics routes in Vietnam between Ha Noi and Ho Chi Minh City, between Ha Noi and Da Nang, between Ho Chi Minh City and Da Nang, and between other locations in Vietnam. The fourth section focuses on international logistics, including cross-border logistics within the Mekong Region (excluding China) and logistics to areas outside of the Mekong Region. The fifth section shows the differences in cargo transportation costs between a 20-foot container and 40-foot container for both a one-way trip load and round-trip load by different modes of transport.2 Lastly, concluding remarks summarize the results and discuss future challenges.
1. Literature Review
Here we review well-known studies on logistics in Vietnam and on cargo transportation cost. Regarding studies on logistics in Vietnam, Banomyong et al. (2015) illustrates a comprehensive picture of the logistics system in Vietnam from viewpoints of transportation and logistics infrastructure as well as mode of transport. It describes the institutional frameworks and the quality of logistics service providers in accordance with semi-structured interviews with policy makers and business associations related to the logistics business in Vietnam. The paper details two aspects of the logistics system in
2 “Cargo transportation cost” is also called “transport price,” “transport charge,” and “logistics charge” in this paper.
Vietnam: a lower-quality logistics system provided by local small and medium-sized firms on the one hand, and a limited number of modernized joint-venture logistics providers for international transportation on the other.
Lu and Lin (2012) presents importance-satisfaction analyses on national logistics competence of Vietnam as well as those of Taiwan and Malaysia in accordance with questionnaire surveys on the evaluation by manufactures. According to the evaluation by the manufacturers, inland transport linkage like road and rail, air transport and ports and maritime transport are well-evaluated while they do not satisfy with eradication of corruption, simplification of customs clearance and financial services like banking and insurance in Vietnam. Nguyen (2016) presents challenges and opportunities for Vietnam upon participation in the ASEAN Single Shipping Market (ASSM) by reviewing the ASSM initiative and the current situations of Vietnamese shipping industry.
As for transportation costs, economists of international trade have tried to estimate the transportation cost out of the imports. As one of representative studies, Hummels (2007) shows a long-term declining trend of transportation costs for ocean and air trpansportation by analyzing data between the 1950s and 2004. Golub and Tomasik (2008) estimates the country-specific international transportation costs of air, maritime, and road transportation for 21 OECD countries. He, Li, and Whalley (2017) develops a general equilibrium trade model using transportation costs between the United States and Canada. Regarding transportation costs in developing countries, Limao and Venables (2001) examine the transportation costs of land-locked countries at the level of infrastructure development and geographical features. Christ and Ferrantino (2011) focuses on the uncertainties of transportation costs and time consumed in Sub-Saharan Africa countries and De (2009) estimates the cross-border transportation costs among India, Pakistan, Bangladesh, Sri Lanka, and Nepal.
However, the number of academic literatures on the logistics in Vietnam and also on transportation costs is limited (Nguyen 2016; Hummels 2007). In addition, the previous studies on logistics in Vietnam have yet focused on the transportation cost in detail; few studies on transportation costs also have not discussed national domestic logistics cost while the major issues of transportation costs have been those out of international trade. IDE-JETRO (2017) has obtained actual transportation costs for certain sections in Laos and Thailand, including the domestic logistics costs and international costs between Bangkok and Vientiane. This paper focuses on the time required for transport as well as cargo transportation costs domestically in Vietnam, internationally in the Mekong Region, and internationally outside of the Mekong Region in accordance with the methodologies adopted in IDE-JETRO (2017).
2. Framework of Logistics Survey and Feature of Freight Forwarders
The IDE-JETRO and IWEP-VASS conducted surveys of freight forwarders, forwarder associations, air cargo operators, and airport terminal operators in Vietnam from September to November in 2017. This paper focuses on the results of the survey with freight forwarders.
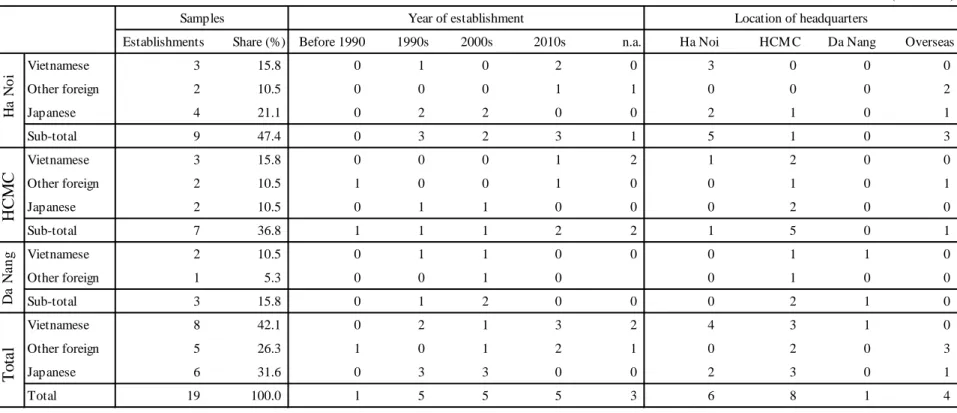
Table 1 shows the framework of the semi-structured survey and the features of logistics forwarders grouped as local Vietnamese forwarders, Japanese forwarders, and forwarders in other foreign countries, and by locations (Ha Noi, Ho Chi Minh City, and Da Nang). The sample for the survey includes 19 freight forwarders. By location, there are 9 forwarders in Ha Noi, 7 in Ho Chi Minh City, and 3 in Da Nang; by country of origin, there are 8 local Vietnamese forwarders, 6 Japanese forwarders, and 5 forwarders from other foreign countries. The targets of our survey were “establishments,” rather than firms, because each forwarder operates in multiple locations. For example, a firm operating in Ha Noi and Ho Chi Minh City has two establishments, and both establishments operate independently of each other and have a different network of branches in the north and in the south. For the 18 establishments in our sample, both a questionnaire survey was distributed and an interview was conducted; for one establishment we only conducted an interview. In a small number of cases where an establishment provided conflicting answers to the questionnaire and interview survey, the questionnaire survey was used. While the total number of respondents in the sample was 19, in cases where only one respondent replied we show the answer of that one respondent; in such a case, we should interpret that such a respondent exists and not that the respondent represents a majority of respondents. Because the number of respondents is limited for each question, most of the tables show the minimum, maximum, and average values, rather than the standard deviation.
Regarding the year of establishment, Japanese forwarders were mostly established in the 1990s and 2000s, while there were no forwarders of other foreign countries established in the 1990s. One forwarder from a country other than Vietnam and Japan was established prior to 1990, but the year of establishment in this case refers to establishment of the firm in the home country, rather than the establishment in their operation in Vietnam.
The year of establishment of forwarders of other foreign countries was mostly after the year 2000, with two established in the 2010s. This trend may reflect the large amount of foreign investments in Vietnam, such as the Samsung mobile phone factories in Bac Ninh Province and in Thai Nguyen Province that were opened in 2009 and 2014, respectively.
In terms of capital structure, all of the Japanese forwarders operate as joint ventures,
Table 1. Features of logistics forwarders in Vietnam in the survey sample (continues)
(number/%)
Establishments Share (%) Before 1990 1990s 2000s 2010s n.a. Ha Noi HCM C Da Nang Overseas
Vietnamese 3 15.8 0 1 0 2 0 3 0 0 0
Other foreign 2 10.5 0 0 0 1 1 0 0 0 2
Japanese 4 21.1 0 2 2 0 0 2 1 0 1
Sub-total 9 47.4 0 3 2 3 1 5 1 0 3
Vietnamese 3 15.8 0 0 0 1 2 1 2 0 0
Other foreign 2 10.5 1 0 0 1 0 0 1 0 1
Japanese 2 10.5 0 1 1 0 0 0 2 0 0
Sub-total 7 36.8 1 1 1 2 2 1 5 0 1
Vietnamese 2 10.5 0 1 1 0 0 0 1 1 0
Other foreign 1 5.3 0 0 1 0 0 1 0 0
Sub-total 3 15.8 0 1 2 0 0 0 2 1 0
Vietnamese 8 42.1 0 2 1 3 2 4 3 1 0
Other foreign 5 26.3 1 0 1 2 1 0 2 0 3
Japanese 6 31.6 0 3 3 0 0 2 3 0 1
Total 19 100.0 1 5 5 5 3 6 8 1 4
Samples Year of establishment Location of headquarters
Da NangHCMCHa NoiTotal
Table 1. Features of logistics forwarders in Vietnam in the survey sample (continued)
(number)
100% Local 100% Foreign Joint-venture M in. M ax. Ave. Respondents M in. M ax. Ave. Respondents
Vietnamese 3 0 0 0 0 0 3 0 18 9 3
Other foreign 0 2 0 0 0 0 2 15 85 50 2
Japanese 0 0 4 69 709 389 3 420 900 707 3
Sub-total 3 2 4 0 709 146 8 0 900 281 8
Vietnamese 3 0 0 0 53 18 3 12 100 51 3
Other foreign 0 1 1 0 40 20 2 100 300 200 2
Japanese 0 0 2 130 388 259 2 700 900 800 2
Sub-total 3 1 3 0 388 87 7 12 900 307 7
Vietnamese 2 0 0 13 26 20 2 60 97 79 2
Other foreign 0 0 1 5 5 5 1 15 15 15 1
Sub-total 2 0 1 5 26 15 3 15 97 57 3
Vietnamese 8 0 0 0 53 12 8 0 100 42 8
Other foreign 0 3 2 0 40 9 5 15 300 103 5
Japanese 0 0 6 69 709 337 5 420 900 744 5
Total 8 3 8 0 709 101 18 0 900 254 18
Capital structure Number of retained vehicles Number of employees
Da NangHCMCHa NoiTotal
Table 1. Features of logistics forwarders in Vietnam in the survey sample (continued)
Notes: 1) Respondents in the sample are defined as “establishments,” rather than “firms,” because we surveyed two establishments of the same firm in Hanoi and Ho Chi Minh City, that are managed independently of each other.
2) The methods for counting the number of vehicles are different depending on the forwarders and may include tractor head and chassis separately.
3) Services provided by the respondents are designed with multiple answers and the categories can be duplicated.
Source: Survey results.
(number)
Transport Inbound Outbound Air Cargo Shipping M ultimodal Forwarding NVOC Customs Cosolidation Packing Insurance
Vietnamese 1 2 1 1 1 0 1 0 2 1 1 1
Other foreign 2 0 0 2 2 0 2 0 2 0 2 0
Japanese 3 3 3 3 3 2 3 2 3 2 3 2
Sub-total 6 5 4 6 6 2 6 2 7 3 6 3
Vietnamese 1 1 1 1 1 1 2 0 1 0 0 0
Other foreign 2 0 0 1 2 1 1 0 1 1 0 0
Japanese 2 2 2 2 2 2 2 2 2 2 2 2
Sub-total 5 3 3 4 5 4 5 2 4 3 2 2
Vietnamese 2 0 0 2 2 0 0 0 1 0 0 0
Other foreign 1 0 0 1 1 0 0 0 1 0 0 0
Sub-total 3 0 0 3 3 0 0 0 2 0 0 0
Vietnamese 4 3 2 4 4 1 3 0 4 1 1 1
Other foreign 5 0 0 4 5 1 3 0 4 1 2 0
Japanese 5 5 5 5 5 4 5 4 5 4 5 4
Total 14 8 7 13 14 6 11 4 13 6 8 5
Services provided (establishents)
Da NangHCMCHa NoiTotal
10
while forwarders of other foreign countries prefer to a operate with 100% foreign capital.
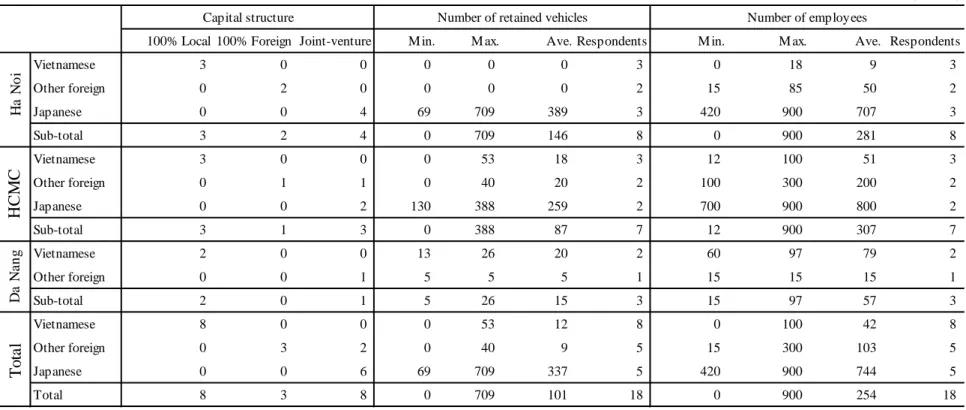
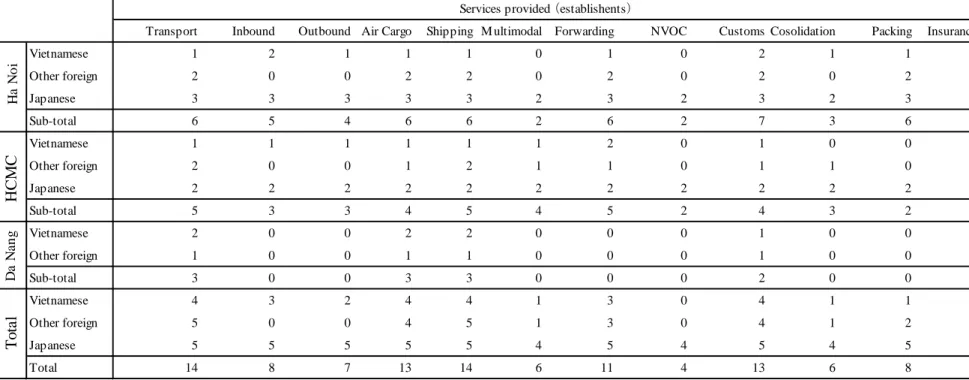
Vietnamese law stipulates that foreign firms must establish a joint venture firm if they provide logistics services such as domestic land cargo transport, international cargo transport, and warehousing services (Ikebe 2008). With regard to this regulation, Japanese forwarders prefer to establish joint venture firms, while forwarders from other foreign countries tend to outsource such services. This result is not unrelated to the fact that the average numbers of retained vehicles and employees of Japanese forwarders is overwhelmingly higher than for forwarders from other foreign countries, with Japanese forwarders reporting 337 vehicles and 744 employees, as shown in Table 1. In particular, the minimum number of the retained vehicles and employees for Japanese forwarders is larger than the maximum number for local Vietnamese forwarders and forwarders from other foreign countries. Furthermore, Japanese forwarders provide all of the services enumerated in Table 1, while local Vietnamese forwarders and forwarders from other foreign countries do not provide the full spectrum of logistics services. Comparing local forwarders and forwarders of other foreign countries, the average number of employees of forwarders from other foreign countries is twice as large as the average number employed by local forwarders.
Even though our sample size is limited, we can observe that because most forwarders from other foreign countries tend to operate using 100% foreign capital, they do not retain vehicles for transporting cargo, but rather supply logistics services as front forwarders with a large number of employees. These characteristics differ from Japanese forwarders, which generally choose to operate joint ventures with local partners, provide a full spectrum of services, and retain more vehicles. In contrast, some local forwarders do not retain trucks and trailers, and instead outsource transport and warehouse services to other forwarders, while others use their own vehicles to provide logistics services even though the size of their establishments are not so large.
3. Domestic Logistics in Vietnam
Comparing domestic logistics and international logistics in Vietnam, the demand for domestic logistics is much higher than the demand for international logistics, as indicated in the traffic volumes published by General Statistics Organization of the Vietnam Ministry of Planning and Investment (Table 2). Comparing shares by transport mode, logistics by road accounts for more than 60% of total demand and that share has increased constantly year after year. The share occupied by inland water is the second largest, although this share is trending downward. The traffic volume by air remains negligible.
11
Table 2. Cargo traffic volume in Vietnam by domestic and international transport and by mode of transport
Note: Numbers in parentheses represent the share (%) of traffic volume.
Source: General Statistics of Vietnam (various years) Statistical Yearbook.
After confirming the higher demand of traffic volume for domestic logistics in Vietnam, we next examined the cargo transportation time and costs between Ha Noi and Ho Chi Minh City, between these two megacities and Da Nang, and between various other domestic locations.
3.1. Logistics between Ha Noi and Ho Chi Minh City
Highway No. 1, which spans the 1,608 km between Ha Noi and Ho Chi Minh City, plays an important role in the logistics of Vietnam. As mentioned in the Introduction, there are four transport options for consignors in Vietnam: road, railway, ship, and air. According to the survey responses from forwarders, electrical and electronics parts and components, machinery, garments, drinking water, and consumer final goods such as motorcycles are transported in both directions. Refrigerated food is also transported using cold chain logistics between the two megacities.
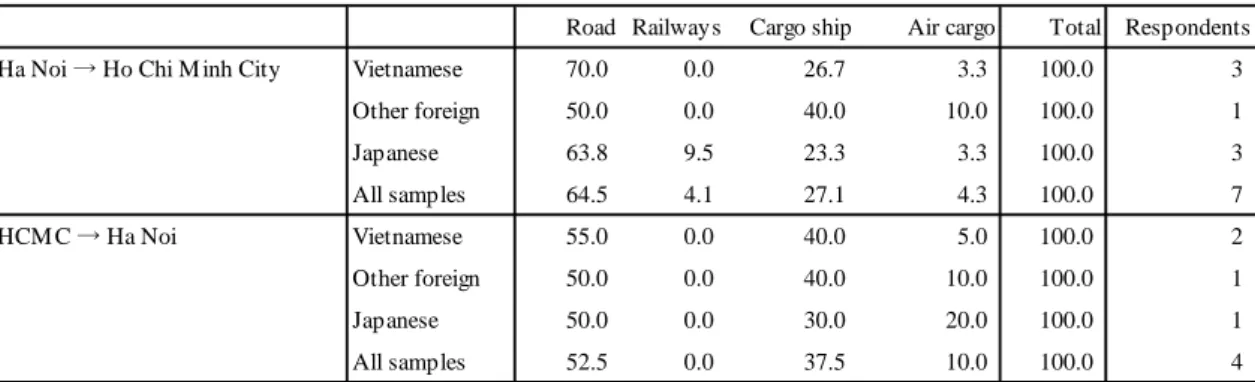
Table 3 shows utilization share by transport mode. Road transport makes up more than half of the traffic volume, but the share is higher for transport to Ho Chi Minh City from Ha Noi than for the transport in the opposite direction. After road transport, cargo
1995 2000 2005 2010 2015 2016
Domestic 136.7 214.8 426.1 765.6 1,115.1 1,207.6 (97.2) (96.0) (92.6) (95.6) (97.2) (97.4)
International 4.0 9.0 34.1 35.3 31.8 32.6
(2.8) (4.0) (7.4) (4.4) (2.8) (2.6)
Railway 4.5 6.3 8.8 7.9 6.7 5.2
(3.2) (2.8) (1.9) (1.0) (0.6) (0.4)
Road 91.2 144.6 298.1 587.0 877.6 957.5
(64.8) (64.6) (64.8) (73.3) (76.5) (77.2) Inland water 37.7 57.4 111.1 144.2 201.5 212.5
(26.8) (25.6) (24.1) (18.0) (17.6) (17.1)
Sea 7.3 15.6 42.1 61.6 60.8 64.8
(5.2) (7.0) (9.1) (7.7) (5.3) (5.2)
Air 0.0 0.0 0.1 0.2 0.2 n.a.
0.0 0.0 (0.0) (0.0) (0.0) n.a.
Total 140.7 223.8 460.2 800.9 1,146.9 1,240.2
(100.0) (100.0) (100.0) (100.0) (100.0) (100.0)
Trafficvolume(millionton)
12
Table 3. Share of utilization by mode of transport between Hanoi and Ho Chi Minh City
Source: Survey results.
ships is the next largest mode of transport. It is interesting that the share of traffic for Japanese and local forwarders using cargo ships is larger for transport to Ha Noi from Ho Chi Minh City than for transport in the opposite direction. As mentioned later, the transport demand to Ha Noi from Ho Chi Minh City is higher than that in the opposite direction. The share of utilization of cargo ships is higher in the direction of Ha Noi and utilization of road transport is lower because the higher demand may be complemented by the utilization of cargo ships. After cargo ships, the share of air cargo is the next highest, while rail is the lowest. According to forwarders that transport by rail, even though it is a relatively small share, transport by rail is advantageous in that the delivery time is more predictable than for other modes of transport.3 Comparing Table 2 and Table 3, these tables show similar trends while the importance of utilizing air cargo is higher between Ha Noi and Ho Chi Minh City than in the whole country as shown in Table 3.
Table 4 shows the door-to-door time required for transport between Ha Noi and Ho Chi Minh City. The minimum time required by road between Ha Noi and Ho Chi Minh City is 48 hours (2 days) and the maximum time is 96 hours (4 days), for an average of 69 hours. Transporting goods 1,608 km over 48 hours can be accomplished by two drivers working full-time in shifts; if they drive at an average speed of 40 km/h, they have to work 20 hours per day in turn. Thus, many forwarders usually estimate that 72 hours door- to-door is required. For rail and cargo ship, 4.5 days and 6 days are required, respectively, while air only requires 12 hours.
Table 5 shows transport costs between Ha Noi and Ho Chi Minh City according to transport mode. The transport charge from Ho Chi Minh City to Ha Noi is 1.5 times higher
3 In contrast, Banomyong et al. (2015) shows a different view that the inflexibility and unreliability of rail compared other modes of transport discourage shippers from using rail freight service.
(% / number) Road Railways Cargo ship Air cargo Total Respondents
Ha Noi → Ho Chi M inh City Vietnamese 70.0 0.0 26.7 3.3 100.0 3
Other foreign 50.0 0.0 40.0 10.0 100.0 1
Japanese 63.8 9.5 23.3 3.3 100.0 3
All samples 64.5 4.1 27.1 4.3 100.0 7
HCM C → Ha Noi Vietnamese 55.0 0.0 40.0 5.0 100.0 2
Other foreign 50.0 0.0 40.0 10.0 100.0 1
Japanese 50.0 0.0 30.0 20.0 100.0 1
All samples 52.5 0.0 37.5 10.0 100.0 4
13
Table 4. Time required for transport between Hanoi and Ho Chi Minh City by mode of transport
Notes: 1) Time required for transportation decrease in cases where two truck drivers alternative driving.
2) Time required for transportation by road between Hanoi and Ho Chi Minh City is said to be 3 days.
Source: Survey results.
than the return trip. This number is based on the transportation costs for both directions provided by respondents. Comparing the average value of the charges or costs in the case of a 40-foot container between Ho Chi Minh City and Ha Noi, the ratio increases to 2.0 times higher. The transport charge from Ho Chi Minh City to Ha Noi is higher than that for the opposite direction because the demand in that direction is higher, according to the respondents. More than a few respondents noted that the transport charges for a round- trip load is lower than the charges for a one-way trip load, with a round-trip discount rate of 15.5% and 5.6% for road and cargo ship (from door to door), respectively. The round- trip discount by road is the highest, although this value is not so high compared with that for other locations. As a matter of fact, one respondent said that he does not discount the transport charge even when he receives an order for a return trip.
Comparing the transportation time and costs of road transport with that of rail and sea in Table 4 and Table 5, rail transport takes 1.3 to 1.5 times longer than by road whereas a trip by ship takes 1.5 to 2.3 times longer compared with road transport. The transportation costs by truck and trailer is 1.1 to 1.2 times higher than by train and is 1.0 to 2.1 times higher than by cargo ship in the case of a 40-foot container. In other words, the discount in cost for railway and cargo ship is not attractive when the cost performance is taken into account. Using a 20-foot container, however, can be attractive; the ratio of transport by ship becomes 2.4 to 2.5 times less expensive than that by road. For a 20-foot container, the transportation cost is much lower than for a 40-foot container in the case of
M in. M ax. Ave. Respondents
Ha Noi - HCM C by road hour 48.0 96.0 68.8 8
day 2.0 4.0 2.9
Ha Noi - HCM C by railways hour 96.0 120.0 108.0 2
day 4.0 5.0 4.5
Ha Noi - HCM C by sea hour 120.0 168.0 141.8 5
day 5.0 7.0 5.9
Ha Noi - HCM C by air hour 12.0 1
Ratio (railways/road) power 1.3 1.5 1.4 2
Ratio (sea/road) power 1.5 2.3 2.0 4
Ratio (sea/railways) power 1.2 1.3 1.2 2
14
Table 5. Transport cost between Hanoi and Ho Chi Minh City by mode of transport (continues)
a cargo ship because space can be saved while the difference in transport cost is not so different as in the case of road transport. Table 5 also shows transport cost for the route of air cargo, but we do not mention them because the comparing the transport cost of air cargo with the cost by other modes of transport is difficult.
(USD/number) Unit M in. M ax. Ave. Respondents Distances Ave./100km
a. Ha Noi → HCM C 40ft 444.4 1,422.2 903.7 6 1,616 55.9
b. HCM C → Ha Noi 20ft 2,000.0 2,000.0 2,000.0 1 1,616 124.0
40ft 800.0 3,333.3 1,812.7 7 1,616 112.4
c. b/a 40ft 1.2 2.1 1.5 5
d. Ha Noi ⇔ HCM C 20ft 3,555.6 1 3,225 110.3
40ft 1,377.8 3,644.4 2,617.8 5 3,225 81.2
Round trip discount rate (%) 40ft 0.0 13.5 15.5 4
e. Ha Noi → HCM C 40ft 533.3 800.0 666.7 2 1,726 38.6
f. HCM C → Ha Noi 40ft 1,022.2 1 1,726 59.2
g. f/e 1.3 1
h. Ha Noi - HCM C 20ft 311.1 800.0 620.0 2
40ft 533.3 977.8 730.6 2
i. Hai Phong - HCM C (door to door) 40ft 444.4 1
j. Ha Noi ⇔ HCM C 20ft 1,511.1 1
40ft 800.0 1,955.6 1,525.9 3
Round trip discount rate (%) 20ft 5.6 1
40ft -13.9 30.8 5.6 3
1) Ha Noi - Hai Phong 20ft 131.1 177.8 154.4 2 113 136.5
40ft 144.4 257.8 201.1 2 113 177.7
2) Ha Noi ⇔ Hai Phong 20ft 196.7 377.8 287.2 2 226 126.9
40ft 216.7 502.2 359.4 2 226 158.8
Round trip discount rate (%) 20ft -6.3 25.0 9.4 2
40ft 2.6 25.0 13.8 2
3) Hai Phong - HCM C 20ft 177.8 400.0 274.1 3 1,608 17.0
40ft 222.2 533.3 422.2 3 1,608 26.3
4) Hai Phong ⇔ HCM C 20ft 155.6 800.0 477.8 2 3,215 14.9
40ft 377.8 888.9 633.3 2 3,215 19.7
Round trip discount rate (%) 20ft 0.0 12.5 6.3 2
40ft 15.0 16.7 15.8 2
5) HCM C Port-its center and suburbs 20ft 133.3 222.2 177.8 2
40ft 133.3 231.1 180.7 3
6) HCM C Port ⇔its center and siburbs 20ft 200.0 377.8 288.9 2
40ft 266.7 386.7 326.7 2
Round trip discount rate (%) 20ft 15.0 25.0 20.0 2
40ft 16.3 25.0 20.7 2
RoadRailwaysCargo ship
15
Table 5. Transport cost between Hanoi and Ho Chi Minh City by mode of transport (continued)
Notes: 1) Exchange rate is assumed to be VND 22,500 per USD.
2) “→” is used in cases where the destination and origin are clear, “ – ” is used when the destination and origin are ambiguous, and “⇔” is used to indicate round-trip transport.
3) The round-trip discount rate is calculated based on the following formula: [(one-way charge)
× 2 – (round-trip charge)] / [(one-way charge) × 2].
4) ”HCMC Port" means ports in Ho Chi Minh City and there are a lot of port terminals the mega city along Saigon and Dong Nai River.
Source: Survey results.
3.2. Logistics between the Two Megacities and Da Nang
Da Nang is considered to be the major city in central Vietnam between Ha Noi and Ho Chi Minh City; however, the city is much smaller and it does not have satellite provinces like Ha Noi (Bac Ninh and Hung Yen) and Ho Chi Minh City (Dong Nai and Binh Duong).
Some forwarders consider Da Nang a base for transporting to cities in central Vietnam because the distance between Ha Noi and Ho Chi Minh City is too great.
As for goods transported between the two megacities and Da Nang, according to the respondents, construction materials are transported from Ha Noi to Da Nang and consumer goods, like rice and drinking water, are transported from Da Nang to Ha Noi.
Consumer goods are transported from Ho Chi Minh City to Da Nang, while electric appliances, automobile parts and components, furniture, cement, and construction materials are transported from Da Nang to Ho Chi Minh City. From Da Nang to other cities in central Vietnam, consumer goods like pastries and drinking water, tapioca glue,
(USD/number) Unit M in. M ax. Ave. Respondents Distances Ave./100km k. Ha Noi - Ho Chi M inh City
7) Ha Noi & its suburbs - Noi Bai Airport Truck 13.3 26.7 19.4 2
Cost in case of round trip Truck 31.1 2
Round trip discount rate (%) 19.2 2
8) Noi Bai - Tan Son Nhat Airport kg 0.8 1
9) Tan Son Nhat Airport - HCM C & its suburbs Truck 13.3 1
Cost in case of round trip Truck 22.2 1
Round trip discount rate (%) 16.7 1
road/railways (Ha Noi → HCMC) 40ft 1.1 1.2 1.2 2
road/railways (HCMC → Ha Noi) 40ft 1.1 1
road /railways (Ha Noi-HCM C) 40ft 1.1 1.2 1.1 3
road/ship (Ha Noi→HCMC) 40ft 1.0 1.5 1.2 3
road/ship (HCMC→Ha Noi) 20ft 2.5 1
40ft 1.4 2.1 1.7 3
road/ship HCM C ⇔ Ha Noi 20ft 2.4
40ft 1.7 1.9 1.8 2
railway/ship Ha Noi -HCM C 40ft 0.9 1
40ft 1.0 1
Cost comparisonAircargo
16
Table 6. Share of utilization by mode of transport between Hanoi and Da Nang and between Ho Chi Minh City and Da Nang
(Unit: %)
Source: Survey results.
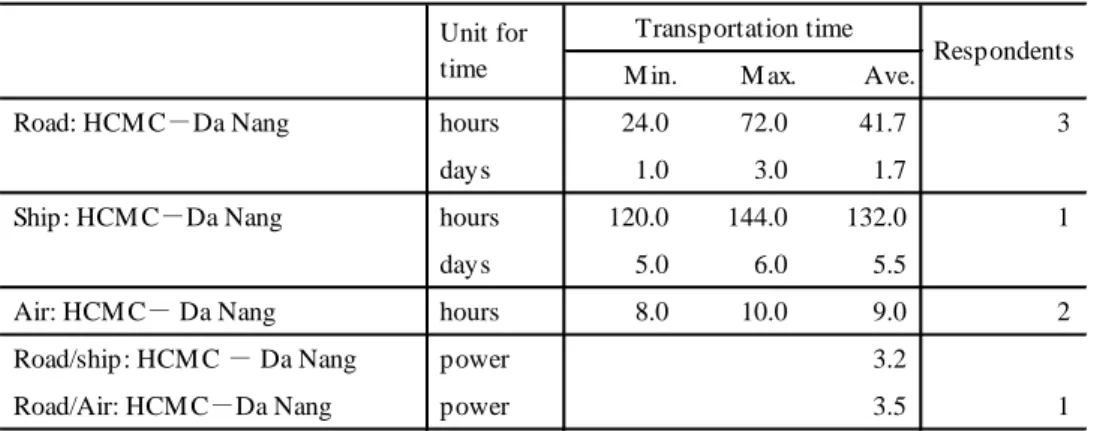
Table 7. Time required for transport between Ha Noni and Da Nang and between Ho Chi Minh City and Da Nang by mode of transport
Source: Survey results.
and fabrics are transported.
Table 6 shows the utilization share by transport mode between Ha Noi and Da Nang as well as that between Ho Chi Minh City and Da Nang. All transport between Ho Chi Minh City and Da Nang is by road; only one forwarder reported sometimes using cargo
Road Railaways Ship Air Total Respondents
Ha Noi→Da Nang 85.0 0.0 10.0 5.0 100.0 1
Da Nang→Ha Noi 85.0 0.0 10.0 5.0 100.0 1
HCMC→Da Nang 100.0 0.0 0.0 0.0 100.0 2
Da Nang→HCMC 100.0 0.0 0.0 0.0 100.0 2
< Ha Noi - Da Nang >
M in. M ax. Ave.
Road: Ha Noi-Da Nang hours 36.0 1
days 1.5
Ship: Ha Noi-Da Nang hours 26.0 96.0 51.5 4
days 1.1 4.0 2.1
Air: Ha Noi- Da Nang hours 7.0 1
Road/ship: Ha Noi - Da Nang power 1.4
Road/Air: Ha Noi-Da Nang power 5.1 1
< Ho Chi M inh City - Da Nang>
M in. M ax. Ave.
Road: HCM C-Da Nang hours 24.0 72.0 41.7 3
days 1.0 3.0 1.7
Ship: HCM C-Da Nang hours 120.0 144.0 132.0 1
days 5.0 6.0 5.5
Air: HCM C- Da Nang hours 8.0 10.0 9.0 2
Road/ship: HCM C - Da Nang power 3.2
Road/Air: HCM C-Da Nang power 3.5 1
Unit for
time Transportation time Respondents
Unit for time
Transportation time
Respondents
17
ships and air cargo between Ha Noi and Da Nang.
Table 7 shows the amount of time required for each transport mode between the two megacities and Da Nang. In the case of road transport, it takes 36 hours (1.5 days) between Ha Noi and Da Nang, while it takes 42 hours (1.7 days) between Ho Chi Minh City and Da Nang. For a cargo ship, it takes 52 hours (2.1 days) between Ha Noi and Da Nang and 132 hours (5.5 days) between Ho Chi Minh City and Da Nang. Comparing transport times by ship and by road, transport by ship between Ha Noi and Da Nang is just 1.5 times longer than by road, whereas the ratio between Ho Chi Minh City and Da Nang is 3.2 times longer.
Table 8 shows the logistics charges, or cargo transportation costs, between the two megacities and Da Nang. The transport costs per 100 km between Ha Noi and Da Nang are lower than those between Ho Chi Minh City and Da Nang except the cases of transporting a truck. In particular, the transport charge per 100 km between Ho Chi Minh City and Da Nang for the one-way transport of a 40-foot container load by road (USD 140) is higher than the transport charge between Ha Noi and Da Nang (USD 70 to USD 87). For ship, the transport charge per 100 km between ports in Ho Chi Minh City and Da Nang Port (USD 29) is much cheaper than that between Hai Phong and Da Nang Port (USD 43) for a 40-foot container. Thus, the use of ship is more advantageous between Ho Chi Minh City and Da Nang than between Hai Phong and Da Nang. While not many forwarders use cargo ships for this route, as shown in Table 6, it may reflect the smaller demand for the route.
3.3. Accessibility between Center/Suburbs and Ports/Airports of the Two Megacities This subsection shows the transport time and logistics costs between the center/suburbs and ports/airports of Ha Noi, Ho Chi Minh City, and Da Nang.
Table 9 shows the time required for the various routes. Transport between the center/suburbs and port/airport of Ha Noi and Ho Chi Minh City requires between 2 and 5 hours, while for Da Nang the time required varies from 2 to 24 hours. Considering, however, that the area of Da Nang city is smaller and there are no surrounding suburbs, transport times of 24 hours can be assumed to be from other provinces in central Vietnam.
On the other hand, the time required for procedures at ports varies and depends on the shipping company, according to respondents. As for the time required between the center/suburbs and the airport, shorter time is required for transport and procedures at the airport, although this is limited to the route between the center/suburbs of Ha Noi and Noi Bai Airport.
18
Table 8. Logistics charges between Hanoi and Da Nang and Ho Chi Minh City and Da Nang by mode of transport (continues)
(USD/number) Unit M in. M ax. Ave. Respondents Distances Ave./100km
a. Ha Noi-Da Nang Truck 800.0 1 759 105.3
b. Ha Noi → Da Nang 40ft 888.9 1 759 117.0
c. Da Nang → Ha Noi 40ft 533.3 1 759 70.2
d. Ha Noi ⇔ Da Nang 40ft 1,333.3 1 1,519 87.8
Round trip discount rate for b (%) 40ft 25.0 1
Round trip discount rate for c (%) 40ft -25.0 1
c. HCM C-Da Nang Truck 800.0 1,022.2 911.1 2 879 103.6
20ft 1,066.7 1,422.2 1,244.4 2 879 141.5
40ft 1,066.7 1,555.6 1,229.6 3 879 139.8
d. HCM C⇔Da Nang Truck 1,066.7 1,777.8 1,422.2 2 1,759 80.9
20ft 1,466.7 2,222.2 1,844.4 2 1,759 104.9
40ft 1,466.7 2,666.7 1,985.2 3 1,759 112.9
Round trip discount rate (%) Truck 13.0 33.3 23.2 2
20ft 21.9 31.3 26.6 2
40ft 14.3 31.3 20.0 3
e. Ha Noi-Da Nang 20ft 177.8 531.1 295.6 3
40ft 222.2 657.8 385.9 3
f. Ha Noi ⇔ Da Nang 20ft 222.2 1
40ft 311.1 1
Round trip discount rate (%) 20ft 37.5 1
40ft 30.0 1
1) Ha Noi -Hai Phong Truck 88.9 1 113 78.6
20ft 66.7 131.1 98.9 2 113 87.4
40ft 77.8 144.4 111.1 2 113 98.2
2) Ha Noi⇔Hai Phong Truck 151.1 1 113 133.5
20ft 142.2 155.6 148.9 1 113 131.6
40ft 155.6 164.4 216.7 1 113 191.5
Round trip discount rate (%) Truck 15.0 1
20ft 25.0 1
40ft 25.0 1
3) Hai Phong -Da Nang 20ft 77.8 311.1 194.4 2 670 29.0
40ft 166.7 411.1 288.9 2 670 43.1
g. HCM C-Da Nang 20ft
40ft 653.3 1 937 69.7
4) HCM C & its suburbs -HCM C Port 20ft
40ft 120.0 1
5) HCM C Port-Da Nang Port 20ft
40ft 166.7 373.3 270.0 2 937 28.8
6) Da Nang Port-Da Nang & its suburbs 20ft
40ft 71.1 1
RoadCargo ship
19
Table 8. Logistics charges between Hanoi and Da Nang and Ho Chi Minh City and Da Nang by mode of transport (continued)
Notes: 1) Exchange rate is assumed to be VND 22,500 per USD.
2) “→” is used in cases where the destination and origin are clear, “ – ” is used when the destination and origin are ambiguous, and “⇔” is used to indicate round-trip transport.
3) The round-trip discount rate is calculated based on the following formula: [(one-way charge)
× 2 – (round-trip charge)] / [(one-way charge) × 2].
Source: Survey results.
Table 10 shows the logistics charge for transport between the center/suburbs and ports/airports of Ha Noi, Ho Chi Minh City, and Da Nang. Considering the small size of Da Nang and the fact that it does not have suburbs, the transport charge between the center/suburbs and the port is smaller than those for Ha Noi and Ho Chi Minh City, as expected. For Ha Noi and Ho Chi Minh City, the transport costs for a 20-foot container and 40-foot container do not show much difference. Table 10 does not show the transportation costs per 100 km because it includes numerous diverse cases. Considering that the distance between Ha Noi and Hai Phong is about 100 km and the transportation costs for Ha Noi and Ho Chi Minh City are between USD 100 and USD 200, these amounts seem reasonable. Regarding the higher transport charge to the airport in Da Nang, USD 111 and USD 151 with 20-foot and 40-foot container, respectively, than those of cases of Ha Noi and Ho Chi Minh City, it is because the transport depends on smaller trucks in Ha Noi and in Ho Chi Minh City while it depends on trailers with 20-foot and/or 40-foot container between center/suburbs and the airport in Da Nang.
(USD/number) Unit M in. M ax. Ave. Respondents Distances Ave./100km h. Ha Noi-Da Nang
7) Ha Noi & its suburbs -Noi Bai Airport Truck 13.3 22.2 17.8 1
8) Noi Bai -Da Nang Airport kg 0.6 1
9) Da Nang Airport-Da Nang & its suburbs 20ft 88.9 1
40ft 102.2 1
i. HCM C-Da Nang
10) HCM C & its suburbs-Tan Son Nhat Airport Truck
11) Tan Son Nhat Airport - Da Nang Airport kg 0.4 1
12) Da Nang Airport-Da Nang & its suburbs 20ft 133.3 1
40ft 200.0 1
road/cargo ship (Ha Noi-Da Nang) 40ft 2.7 1
road/cargo ship (Ha Noi-HCM C) 20ft 3.7 1
40ft 2.2 1
AircargoCompair
20
Table 9. Time required for transport by truck from center of cities or their suburbs
Notes: 1) “Truck” includes transport by a tractor and trailer.
2) “Procedure” means time required for procedure at ports.
3) One respondent provided the time required for the same route depending on whether the final destination was domestic or international. We included both cases in the sample.
Source: Survey results.
3.4 Logistics for Other Routes in Vietnam
Some respondents provided information on the time required and logistics charges for specific transport routes. Even though these routes were supplied by only one respondent, we list them here. Table 11 shows the time required and Table 12 shows the transportation costs for specific routes in Vietnam. The route between Hai Phong and Bac Ninh and the route between Ho Chi Minh City and Binh Duong are similar to the cases described in Table 9. Qui Nhon, Quang Binh, and Kon Tum are provinces located in Central Vietnam.
The transportation charges per 100 km between Ho Chi Minh City to Phu Tho in the North, which takes 48 hours, between Da Nang and Hue, and between Da Nang Port and Dung Quat Economic Zone are less than USD 100, maybe because the cargos are
<Center or suburbs-port> (hour/number)
M in. M ax. Ave.
Ha Noi & its suburbs-Hai Phong Transport 2.0 5.0 3.0 6 4
Procedures 3.0 48.0 20.0 5 4
Sub-total 5.0 53.0 23.0
HCM C & its suburbs-its port Transport 2.0 5.0 3.5 5 5
Procedures 2.0 22.0 11.8 4 4
Sub-total 4.0 27.0 15.3
Da Nang & its suburbs-its port Transport 2.0 24.0 13.3 1 1
Procedures 1.5 12.0 6.4 1 1
Sub-total 3.5 36.0 19.6
<Center or suburbs-airport>
M in. M ax. Ave.
Ha Noi -Noi Bai Airport Transport 2.0 1 1
Procedures 2.0 1 1
Sub-total 4.0
Da Nang - Da Nang Airport Transport 1.0 1 1
Procedures 2.0 1 1
Sub-total 3.0
Time Required for:
Samples Respondents
Time Required for:
Samples Respondents
21
Table 10. Transportation cost by road from center of cities or their suburbs to ports and airports in Hanoi, Ho Chi Minh City, and Da Nang
Notes: 1) “ – ” is used in cases where the destination and origin are ambiguous.
2) One respondent provided the time required for the same route depending on whether the final destination was domestic or international. We included both cases in the sample
Source: Survey results.
transported by smaller trucks. But the transportation costs per 100 km for other routes are mostly between USD 100 and USD 200. On the other hand, the costs per 100 km between Ho Chi Minh City and Vung Tau, between Ho Chi Minh City and Can Tho, and between Da Nang and Kon Tum are higher than USD 200. Among these, the route between Da Nang and Kon Tum includes mountainous routes, so it is understandable why the logistics costs are higher; however, for the other two routes, it is unclear what accounts for the higher costs.
4. International Logistics for Vietnam
International logistics makes up between 2% and 8% of total demand, based on the traffic volume shown in Table 2. Considering the importance of imports and exports, however, the international logistics in Vietnam should not be underestimated. For our analysis of international logistics in Vietnam, we separated logistics into two groups: international
<Center or suburbs-port> (USD per kg or Container/number)
Unit M in. M ax. Ave. Samples Respondents
Ha Noi-Hai Phong 20ft 131.1 177.8 152.6 4 2
40ft 144.4 257.8 180.6 4 1
HCM C & its suburbs-its port 20ft 133.3 222.2 177.8 2 2
40ft 133.3 231.1 180.7 3 3
HCM C & its suburbs-Vung Tau port 20ft 150.0 1 1
40ft 170.0 1 1
Da Nang & its suburbs-its port 20ft 88.9 1 1
40ft 71.1 102.2 81.5 3 3
<Center or suburbs-airport> (USD per kg or Container/number)
Unit M in. M ax. Ave. Samples Respondents
Ha Noi & its suburbs-Noi Bai Airport Ttuck 0.6 26.7 15.4 4 2
HCM C & its suburbs-Tan Son Nhat Airport Truck 13.3 1 1
Truck 22.2 1 1
Da Nang & its suburbs-its port 20ft 88.9 133.3 111.1 2 1
40ft 102.2 200.0 151.1 2 1