Land use classification using satellite imagery in mountain area
-case study in Mae Chaem district, Chiang Mai province-
Kazuki H
AGIAWRA, Yutaka M
ATSUNOand Nobumasa H
ACHODepartment of Environmental Management, Faculty of Agriculture, Graduate school of Kindai University Kindai University
Synopsis
This study aims to analyze land use changes in mountain areas in Mae Chaem District, Chiang Mai Province, Thailand, by using satellite imagery, and to identify factors associated with these changes. To classify the land uses, Normalized Difference Vegetation Index (NDVI) was used. Two villages were selected for calibrating the values of NDVI for specific land uses, including forest, maize, paddy field rice, and others. In NDVI analysis, the classification efficiency reached approximately 15% accuracy for forest, maize, and rice, however, it was difficult to distinguish between maize and paddy field with good accuracy. These two villages responded differently to the declining price of maize during the study period. One village continue to expand the maize area, while the other switched to other high value crops such as fruit or vegetables. Applying the NDVI values obtained by calibrating in two villages, the analysis of land use changes at Mae Chaem district was carried out. The result suggested the decline of forest cover and the expansion of maize area, which agreed with the general pattern of land use changes at the district level. The use of satellite imagery for analyzing land use can be a good tool to identify land use changes over a large area. However, supplementary index including slope or seasonal changes is required to improve classification accuracy.
Keywords: Land use changes, Satellite imagery, NDVI, Thailand, Mountain area
1. Introduction
Recently, maize has become important cash crop for livestock industry and human consumption in Thailand. Northern region has the biggest area under cultivation of maize among four regions in Thailand, accounting for nearly 70 % of the total or 756,724 ha in 2015
(Office of Agricultural Economics in 2016).
Especially, maize cultivated area has increased from 1,024,284 ha in 2007 to 1,161,328 ha in 2014 in Whole Thailand (FAOSTAT). Rapid expansion of maize cultivating area can be attributed to the favorable maize price and the progress of contract farming by one of major food company in Thailand. The cultivation area
of maize has also increased in country level, while the price of maize has declined since 2012 when it hit its peak. As the size of maize area expanded in this region, hot spots of burning fields also increased remarkably in order to prepare lands after harvests which led to the smoke problem during March and April in Northern provinces.
For the analysis of land use changes, remote sensing and GIS have been widely applied in recent years. Li and Fox (2012) created the map of rubber tree growth in Southeast Asia using value of Normalized Difference Vegetation Index (NDVI) based on 250 m resolution MODIS images and statistical data. They pointed out the MODIS images were suitable for differentiation between young rubber trees and other field crops. An estimate of paddy field area in Japan and accuracy analysis was conducted using NDVI based on Landsat satellite images (Okamoto et al., 2015).
Amano and Takagi (2005) tried to create the detailed vegetation map in urban area in U.S.
using hyper spectrum data AVIRIS with high resolution was evaluated its accuracy compared to Quick Bird satellite data. In addition, they concluded the classification based on Spectrum Angle Mapper was effective for vegetation classification. Many studies about land classification in plain field and urban area have been conducted using NDVI. However, classification in mountain area has not yet been fully conducted due to the difficulty in complexity of geography. The purpose of this study to analyze the land use changes in the mountain areas of Chiang Mai Province using
satellite data and identify factors associated with these changes.
2. Materials and methods
Study area
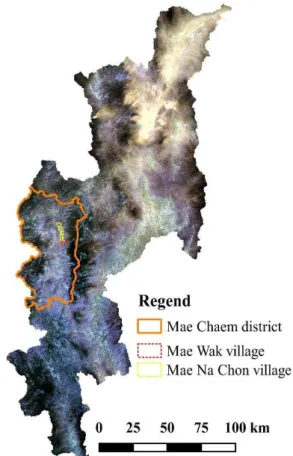
Mae Chaem District is located at 18.12 –18.59 N and 98.4 – 98.30 E, in the western part of Chiang Mai Province, Northern Thailand (Fig.
1). Two villages, Mae Na Chon (MNC) and Mae Wak (MW) are selected for this study in southwest of Mae Na Chon Sub-District, Mae Chaem District. Characteristics of two villages are listed in Table 1.
Fig. 1 Map of Chiang Mai Province with study sites (obtained from satellite image, Landsat 8 OLI/TIRS C1 Level-1 image in March 7, 2015)
As seen from Fig. 1, we can distinguish some
land use such as forest area with black, cropland with brown to light blue, urban area with white by individual interpretation. It appears that it’s difficult to separate the cropland due to similarity in their colors each other such as between paddy field, Maize and other field crops.
Table. 1 Description of study area
Materials
Landsat 7 ETM+ C1 Level-1 (Enhanced Thematic Mapper Plus) for 2007 and Landsat 8 OLI/TIRS C1 Level-1 for 2015 set on EarthExplorer (U.S. Geological Survey).
Landsat 8 OLI images consist of nine spectral bands which are Band 1 to 7 and 9 with a spatial resolution of 30 meters and Band 8 is 15 meters.
Images with cloud cover of less than 10 % were selected to calculate NDVI at the end of cultivation season, March 25, 2007 (Path; 131, Row; 47, cloud cover; 0 %) and March 7, 2015
(cloud cover; 0.07 %) was used.
Method
Field survey
To supplement the satellite image analysis, field survey was conducted at MW and MNC villages from Mar – May 2017. During the period, interviews with farmers and extension government officer were conducted to analyze the factors associated with land use changes.
NDVI calculation using bands
In this study, NDVI was used for the land use and cover classification between the target date.
NDVI expression is below as:
NDVI = (NIR − R)/(NIR + R) NIR: Reflectance of Near Infrared Red band R: Reflectance of Red band
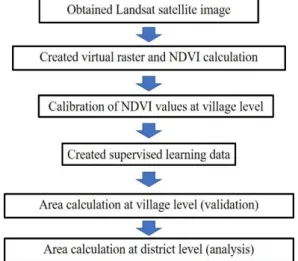
Fig. 2 shows the flow of analysis from satellite image to land vegetation classification, including two types of analysis. The land use was classified into four classes, forest, paddy field, maize and others for both villages.
Fig. 2 Schematic flow of classification analysis using satellite data
Image classification
Image classification was carried out using Semi-To supplement the satellite image analysis, field survey was conducted at MW and MNC villages from March–May 2017. During the period, interviews with farmers and extension government officer were conducted to analyze the factors associated with land use changes. After calculating NDVI values, calibrated values of NDVI at village level was applied to classify land use at district level.
3. Calibration of NDVI values
Land use maps of 2007 and 2015 of these villages produced by Land Development Department of Thailand are shown in Figure 3.
Fig.3 Changes of land use in MW (above) and MNC (below) villages between 2007 and 2015
Source: Land Development Department Thailand
In MW maize area cover decreased from 222
ha (22 %) to 151 ha (15 %) while the forest area increased from 740 ha (72 %) to 799 ha (77 %). According to villagers, the maize area of about 160 ha has been converted to other crops such as passion fruits, green beans and banana in after 2009 because of declining price of maize. However, in MNC, maize area increased 113 ha and forest area declined about 121 ha between 2007 and 2015 in spite of declining trend of maize price. Factors associated with different response to declining maize price are analyzed after clarifying the overall land use change in Mae Chaem District.
Calibration of NDVI values
Based on the available land use pattern for MW and MNC by Land Development Department, NDVI values for different land uses were calibrated so that relatively good estimation can be made by using SCP. NDVI values for 2007 and 2015 for both MW and MNC villages were calibrated for best accuracy efficiency. The average of NDVI values for MW and MNC villages is used to estimate the land use changes at district level.
4. Results and discussion
Estimation of land use change at Mae Chaem District
Based on the village level calibration (validation), the land use change analysis was scaled up to Mae Chaem District level (analysis), Chiang Mai Province based on calibrated values of NDVI for 2007 and 2015. The classification types were similar to the village level as
followings: 1. Forest, 2. Paddy field, 3. Maize and 4. Others. Others (other land uses) including houses, river and field crops except for maize and rice. It was difficult to distinguish mixed fields crops from NDVI value.
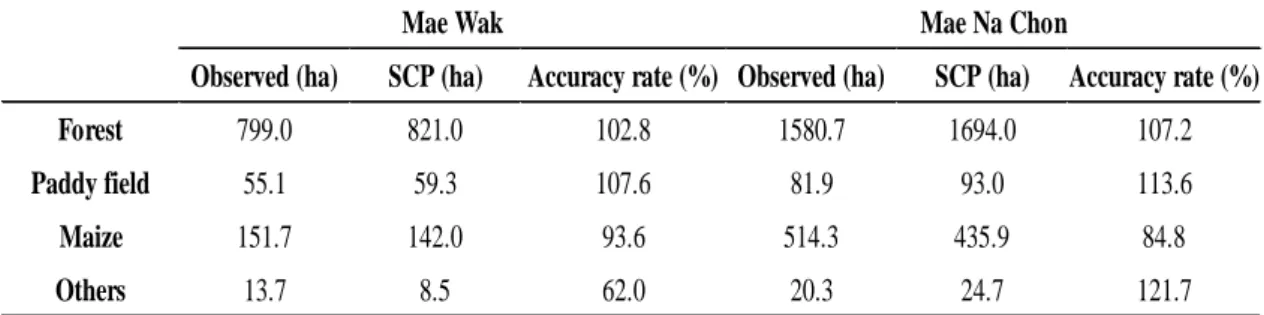
Area calculation using NDVI values When the calibrated value of NDVI were used to assess the land use pattern for MW and MNC and the result for 2015 classification is shown in Fig. 4. The result of accuracy analysis is shown in Table 2, and the calculated values of NDVI for 2007 and 2015 are shown in Table 3.
Table. 3 Description of NDVI value of each classification type
NDVI(2007) NDVI(2015)
Forest 0.48 0.60
Paddy Field 0.21 0.35
Maize 0.14 0.20
Others 0.34 0.39
Value of NDVI was defined by counting five random spots and calculated average of both villages for each classification type. All type of the value is increased from 2007 to 2015.
Table 3 shows that the value of NDVI was quite similar between paddy field and maize field.
Also for 2015, other land uses (others) had NDVI value of 0.39 which was nearly the same as the one of paddy field, which was 0.35. The classification based on only NDVI value may result in some misleading classification, particularly crops like rice, maize or other crops.
In both villages, accuracy rate of forest was 102.8 % and 107.2 %, respectively. However, paddy field was overestimated in both villages approximately 15 % and maize area was underestimated approximately 6-1
Fig. 4 Land classification map using NDVI value in 2015 (MW: above, MNC: below)
Table. 2 Comparison between observed* area and calculated area for two villages
Accuracy rate expression: (SCP / Observed) *100
*Observed area is by the statistics of LD
Observed (ha) SCP (ha) Accuracy rate (%) Observed (ha) SCP (ha) Accuracy rate (%)
Forest 799.0 821.0 102.8 1580.7 1694.0 107.2
Paddy field 55.1 59.3 107.6 81.9 93.0 113.6
Maize 151.7 142.0 93.6 514.3 435.9 84.8
Others 13.7 8.5 62.0 20.3 24.7 121.7
Mae Wak Mae Na Chon
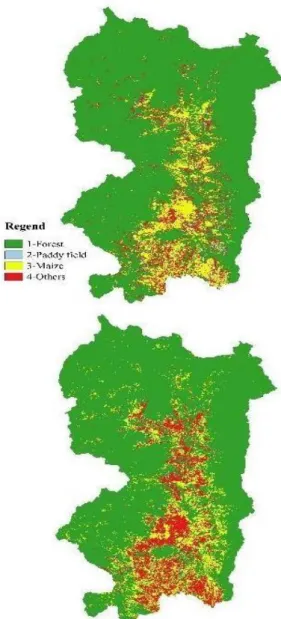
Fig. 5 Changes of land use in Mae Chaem District, Chiang Mai Province with four classification groups (2007: above, 2015:
below)
Area calculation at district level
Utilizing the results of village level classification by NDVI value, the classification was scaled up to Mae Chaem District level.
Fig.5 and Table 4 show the calculated land use changes between 2007 and 2015 in Mae Chaem District.
Table. 4 Changes of land use generated by analysis 2 in Mae Chaem District, Chiang Mai Province between 2007 and 2015
(Unit: ha) 2007 2015 Change Forest 229,561 216,552 -13,009 Paddy Field 4,160 3,272 -888 Maize 27,102 31,513 +4,411 Others 20,338 29,824 +9,428 Total 281,161 281,161 0
As shown in Table 4, forest cover has declined as much as 13,000 ha between 2007 and 2015, with its proportion declining from more than 80 % in 2007 to about 77 % in 2015. During the same period, maize area increased as much as 4,411 ha and other land use 9,428 ha, the trend of which is confirmed by the statistics of land use change in Mae Chaem District. The forest area in Northern region is an important watershed for Central region of Thailand, however, it has been encroached by the expansion of maize cultivation and expansion of other land use types, including urbanization and cultivation of high value crops such as fruits and vegetables. Conservation and control measures are needed to prevent further reduction of forest cover.
Discussion
With the increased demands for feed, the maize cultivation and production increased rapidly in Northern Thailand in the late 2000s.
Food companies in Thailand promoted the expansion of maize production by contract farming, resulting in the conversion of forest
area into maize field in Northern Thailand. In Mea Chaem District only, about 13,000 ha or 3% of the forest cover has been lost between 2007 and 2015.
However, the price of maize has been in the declining trend after 2012. At the village level, different response to this price change was observed. In MW village maize field has been converted to other field crops such as passion fruit, chill, beans and banana tree, while in MNC village, introduction of alternative crop did not spread as fast as MW village and maize area continued to expand. Different responses by villagers to declining maize price may be attributed to the difference in entrepreneurship of villagers. According to the interview with extension agent in MNC, villagers are conservative and averse to taking the risk of cultivating high value cash crops. While in MW, the village leader persuades villagers to introduce new crops and they accepted such a new initiative. These differences seem to have originated in different socio-economic backgrounds of two villages, which needs to be analyzed in the future study. At the district level, overall trend is same as MNC where the expansion of field crops (especially maize) and the decline of forest area proceeded. After 2012 when the maize price started to fall down, some progressive villages have been taking proactive measures to introduce high value cash crops, while conservative village seem to lag behind.
4. Conclusion
In this paper, land use changes in
mountainous area in Northern Thailand was assessed by using satellite imagery. Utilizing the available data on land use pattern at village level, NDVI values for different land uses (4 types) were calibrated. The calibrated NDVI values were used to assess the land use change at different periods at district level. It was confirmed that general trend of land use changes at district level was the expansion of maize field and other land uses and the decline of forest area.
The use of satellite imagery can be a viable tool for analyzing land use changes in mountain area in a large scale.
Expansion of maize cultivation in Northern Thailand can be attributed to the promotion of maize cultivation by contract farming by food company and increasing price of maize. After the declining trend of maize price, progressive village respond to switch from maize to other cash crops, while the one of conservative villagers continue to cultivate and expand maize cultivation.
To distinguish field crops such as rice and maize by using NDVI values only will pose a challenge. To make more precise classification, especially for paddy field and maize, the data gathering period for satellite images should be set in the middle of cultivation season, that is, June or July, where paddy field is filled with water. Furthermore, additional factors, including topography of land, can be supplemented in interpreting land use pattern, where paddy fields lie at flat area.
REFERENCES
Li, Z., and Fox, J. M. (2012) Mapping rubber tree growth in mainland Southeast Asia using time-series MODIS 250 m NDVI and statistical data, Applied Geography, 32:
420-432.
Okamoto, K., Ono, K., Doi, Y. (2015) Detecting and Estimating 2002 Rice Planted Area in Aomori Prefecture, Using Changes in Multi- temporal Data-based Water Index and Vegetation Index, J. JASS, 31(4): 109-116.
Schuler, U. (2010) Towards regionalisation of soils in Northern Thailand and consequences for mapping approaches and upscaling procedures.
Thomas, D. E., Preechapanya, P., Saipothong, P.
(2004) Developing science-based Tools for participatory watershed management in montane Mainland Southeast Asia: final report to the Rockefeller foundation. Chiang Mai, Thailand, International Centre for Research on Agroforestry (ICRAF).
Webpages
From GIS to Remote Sensing https://fromgistors.blogspot.com/
Food and Agriculture Organization of the United Nations (FAO), FAOSTAT
http://www.fao.org/faostat/en/#home USGS science for a changing world
https://landsat.usgs.gov/what-are-band- designations-landsat-satellites
https://lta.cr.usgs.gov/L8 https://lta.cr.usgs.gov/LET
タイ山岳部における衛星画像を用いた土地利用区分図の作成 - チェンマイ県メーチェム郡を事例として –
萩原 一樹・松野 裕・八丁 信正 (近畿大学農学研究科環境管理学専攻)
要約
本研究では、チェンマイ県メーチェム郡において衛星画像を用い山岳部における土地 利用の変化とその要因を明らかにすることを目的とし、植生指標を用いた土地利用区分 図の作成を試みた。メーチェム郡の二つの村を選択し、既存の土地利用区分を用いて、
森林、トウモロコシ、水田、その他の土地利用区分における植生指数のカリブレー ションを行った。植生指数を用いた分類では、森林地域とトウモロコシの分類精度は 両村ともに実測値と比べ約 15%以内の差に抑えることができた。しかし、トウモロコシ と水田の区別は植生指数値の類似性から十分な精度を得ることは困難であった。これら二 つの村は、分析期間中におけるトウモロコシ価格の低下に対して異なる対応を行った。一 つの村では、トウモロコシ栽培面積の拡大が続き、もう一つの村では果物や野菜等の換金 作物への切り替えが進んだ。
村レベルでカリブレーションを行った植生指数を用いて、チェンマイ県メーチェム郡の土 地利用分類を行った。その結果、対象期間中に森林地域の減少、トウモロコシの面積拡大が 見られ、広域レベルの土地利用の変化の動向を明らかにすることができた。大きな地域を対 象とした土地利用変化を見る場合、衛星画像を土地利用区分に活用することが有効な方法で あることが明らかになった。今後、土地の傾斜や季節毎の植生変化等の要素も加味した分類 を行い、分類精度を向上させる必要がある。