INTRODUCTION
Sugar - sweetened beverages, especially tapioca milk tea, are very popular in Taiwan. Beverages stores are everywhere ; according to the statistics from the Ministry of Finance in Taiwan, there are about 16,000 beverage stalls in Taiwan(1). Beverage production value grew from NT $ 30.4 billion in 2010 to NT $ 51.9 billion in 2014(1).
According to the Nutrition and Health Survey in Taiwan (NAHSIT) over the years, the average daily energy intakes from sugar - sweet-ened beverages in adults were 141 kcal, high school students 200 kcal, junior high school students 156 kcal, and elementary school children 119 kcal(2), which were from 5 to 8% of total energy intake. However, there have been no reports about sugar compositions (glucose, fructose, sucrose, lactose, maltose).
Sugar - sweetened beverages, especially tapioca milk tea, are very popular in Taiwan. Regular size is 700 mL and 550 kcal(3). Ac-cording to the Dietary Guidelines for Taiwanese 2013, the energy recommendation for a 19 - 30 year - old male (average height and weight 171 cm and 64 kg, respectively) is 2400 kcal per day(4). A cup of tapioca milk tea, accounts for 22 percent of total energy intake, equivalent to about two bowls of rice.
There are many reports about the high intake of sweetened beverages in students in elementary schools, junior and senior high schools and universities in Taiwan. However, only one study on 2 5 -year old children is available on the quantity (5).
Beverages often contain high isomerized sugar made from starch.
In the US, isomerized sugar is usually made from corn starch and is called high - fructose corn syrup (HFCS). It is soluble and usually used in sugar - sweetened beverages. Because high - fructose corn syrup is cheaper and sweeter than sucrose, it is widely used in beverages, frozen fruit, candy, jelly, and dairy products. In recent years, there are reports that high - fructose corn syrup can lead to many health problems(6 - 18). For example, fructose elevates blood triglyceride concentrations more than glucose (8 - 11), increases body weight and causes obesity(6 - 8, 12 - 16), which induces insulin resistance and diabetes(16 - 18).
Because sugar - sweetened beverages pose a health threat, for-mer US President Bill Clinton proposed a plan to stop the sale of cola and other sugar - sweetened beverages in public elementary schools(19). However, it is unknown whether limiting tapioca milk tea in Taiwan is effective in reducing sugar intake. There was no literature about sugar intake from sugar - sweetened beverages and sweet snacks in university students. Therefore, the aim of the study was to elucidate whether limiting tapioca milk tea could reduce sugar intake in university students.
METHODS
SubjectsThe necessary sample size was calculated by following equa-tion : n![σ/µ×0.05]2= [ 18 /(60 × 0.05)]2= 36
Where n = number of subjects,σ = standard deviation, µ= average value
In addition, allowing for a 10% drop - out rate, the necessary sample size was 40. The study was conducted in summer with about 38 university students of 20 to 24 years old from southern Taiwan. First, we collected 341 questionnaires from university students to assess university students for their preference for
ORIGINAL
The Effect of Limiting Tapioca Milk Tea on Added Sugar
Consumption In Taiwanese Young Male and Female
Subjects
Pei Ying Lin1, Ting Chun Chen1,2, Fang Yu Lin1,2, Jia Yau Doong1, Wen Lee Chen1, Sumiko Kamoshita2,
Indri Kartiko Sari2, Hitomi Takeichi2, and Shigeru Yamamoto2
1Department of Nutrition and Health Science, Fooyin University, Kaohsiung, Taiwan,2Asian Nutrition and Food Culture Research Center
-Jumonji University, Saitama, Japan
Abstract : Tapioca milk tea, the most popular beverage in Taiwan, is consumed a lot by Taiwanese which con-tributed to their daily sugar intake. Our study purpose is to investigate whether limiting intake of tapioca milk tea is useful for the control of sugar intake in Taiwanese. The study was conducted in questionnaires selected 38 subjects, 2024 y, from 341 university students in Kaohsiung City, Taiwan. Subjects were match -paired by sex, age, department, and randomly divided into two groups for cross -over design in which each group had 1 week with or without tapioca milk tea. Other beverages and foods were allowed freely in both periods. Each group member recorded their own daily sugary intake for two weeks and was confirmed by researchers the next day. The average sugar intakes with or without tapioca milk tea were similar between the two treatments (p 0.05), 58.4 23.2 g/day and 56.5 22.2 g/day (glucose 25%%, fructose 19%%, sucrose 53%%, lactose 3%%). With or without tapioca milk tea, 85%% of sugar intakes came from beverages. Even by limiting tapioca milk tea, the subjects took the same sugar amount from other beverages, suggesting that an established sugar intake level is hard to change. J. Med. Invest. 65 : 43-49, February, 2018
Keywords : sugar intake, tapioca milk tea, food habit, Taiwan
Received for publication September 8, 2017 ; accepted October 16, 2017. Address correspondence and reprint requests to Shigeru Yamamoto, Professor, 2 - 1-28 Sugasawa, Niiza City, Saitama Prefecture 352 - 8510, Japan and Fax : +81 - 48 - 260 - 7613.
sugar - sweetened beverages and sweet snacks. Subjects in this study were selected from those who favored sugar - sweetened bev-erages and sweet snacks. We designed this questionnaire to select appropriate subjects for this study. The questionnaire con-sisted of four sections, the first section was about the intake of sweet snacks, the second was about the intake of sugar - sweetened beverages, the third was about liking for tapioca milk and the fourth elicits demographic information on the subjects. Inclusion criteria were as follows : (1) the weekly frequency of intake of sugar -sweetened beverages had to be four or more times, (2) the weekly frequency of intake of sweet snacks had to be two or more times, (3) those who like tapioca milk tea, (4) age from 20 to 24 years old without sickness. A total of 75 students met the conditions, and after an orientation the number of remaining students was 40. Two of them were excluded because their records were incom-plete, and the final available number was 38 (16 males and 22 females ; 15 and 23 were from the nutrition and non - nutrition de-partments, respectively).
Orientation
We held two orientations for this study to explain the purpose and implementation of the research methods. Participants were instructed in how to record their intake of sugar - sweetened bever-ages and sweet snacks. Through discussion, it was confirmed that subjects understood how to record their intake of sugar added foods and could fill out their records sheets without error.
Ethics of human subject participation : This study was approved by the ethical committee of National Cheng Kung University Govern-ance Framework for Human Research Ethics please add number of approval (No. 104 - 029). The participants were informed in detail about the purpose, the advantages and disadvantages of this study, and their rights and obligations pertaining to their lifestyle. In-formed consent was obtained from all the participants.
Study design
This study was conducted by cross - over design. We matched pairs of subjects by sex, age, and department, randomly divided into Group A and B. Each having 20 people, and were given either 500 mL tapioca milk tea or no tapioca milk tea for the first week. After a one week - long washout period, the subjects received the opposite test for another week. Each period was 1 week with a 1 week washout between the periods, was with or without tapioca milk tea, and freely allowed other beverages. The duration of study was three weeks. Tapioca milk tea of 500 mL is consisted of fructose 2.55 g, glucose 2.55 g, sucrose 18.65 g. All subjects had to keep a record of sugar added foods for each week by filling out their record sheets and took photographs whenever they drank sugar -sweetened beverages or ate sweet snacks during intervention.
Estimation of sweet food intake
When the subjects started the study, they had to write a sugar added food record for each week (with or without tapioca milk tea) and photograph whenever they drank sugar - sweetened beverages or ate sweet snacks. The records were confirmed by the researcher the next day. In order to estimate weights of beverages and snacks intake we have four methods : (1) weighing method (When the subjects consumed sugar - sweetened or sweet snacks, they put the food on a scales to check the weight of sweet food), (2) food model (subjects were instructed to report food record and we used food model to estimate intakes of sugar - sweetened beverage or sweet snacks, (3) use credit card for estimating size (before subjects con-sumed sugar - sweetened beverages or sweet snacks, they put a standard - size credit card next to it and took a photograph), (4) food label for estimating weight (if it had the nutrition facts on the label they could read the information and write the weight of what they ate or drank).
Calculation of sugar intake
The Taiwan sugar composition table “Development of a food composition database of refined monosaccharide and disaccha-rides in snacks, desserts, and beverages” was used (20). In this study, we estimated the total daily intake of sugar for each week with or without tapioca milk tea. If the intake of sweet snacks and sugar - sweetened beverages was not in this analysis table, the package label was used as a reference to calculate the intake of refined sugars.
Physical measurement
We did four times measurements before and after studies in each period. Height and weight were measured to one decimal point. We also used In body 720 BODY COMPOSITION ANALYZER (Seoul, South Korea products) to measure a subject’s body composition.
Statistical analysis
Data were carried out with SPSS (version 18.0) statistical soft-ware. Data were assessed by paired t- test and p values less than 0.05 were considered statistically significant.
RESULTS
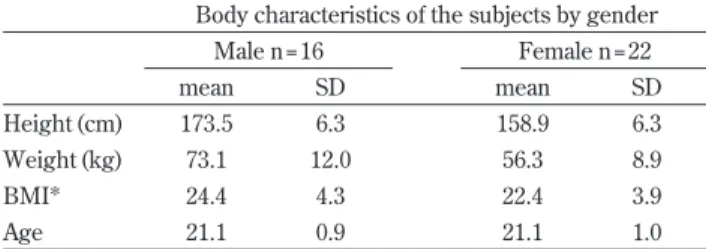
Table 1 shows the body characteristics of the subjects by gen-der (n = 38, male 16, female 22).
Table 2 presents sugar intakes in the period with or without tapioca milk tea by gender and percentages of each sugar against total intake of all subjects in the week with or without tapioca milk tea (TM and NTM, respectively). All the sugar intakes were not significantly different between the two periods (p!0.05) except that the sucrose intake of females was higher in TM than in NTM. The intake of glucose + fructose increased in the week without tapioca milk tea, about 44% more than the week of consuming tapioca milk tea, when it was about 38%. In the week with tapioca milk tea total sugar intake was 58.4g/ day (glucose 21%, fructose 17%, sucrose 60%, lactose 2%). In the week without tapioca milk tea total sugar intake was 56.5 g/ day (glucose 25%, fructose 19%, sucrose 53%, lactose 3%).
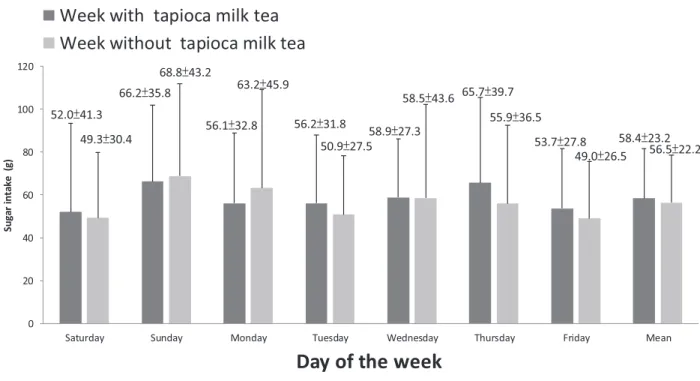
Fig. 1 shows daily and mean sugar intakes for the weeks with or without tapioca milk tea. Statistical differences between days with and without tapioca milk tea were not observed ( p!0.05). The average sugar intakes with or without tapioca milk tea were similar, and in the week with tapioca milk tea period intake was 58.4! 23.2g/day, while in the week without tapioca milk tea period it was 56.5!22.2 g/day.
Table1. Body Characteristic of the subjects by gender Body characteristics of the subjects by gender
Male n = 16 Female n = 22 mean SD mean SD Height (cm) 173.5 6.3 158.9 6.3 Weight (kg) 73.1 12.0 56.3 8.9 BMI* 24.4 4.3 22.4 3.9 Age 21.1 0.9 21.1 1.0
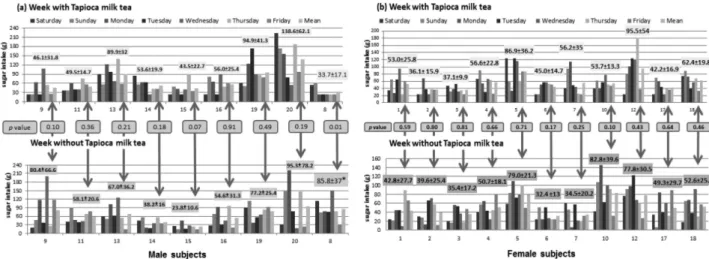
Fig.2 shows the daily sugar intake of individuals in males (a) and females (b) with and without tapioca milk tea and the statistical difference between the two periods. Although there were 16 male subjects, here we show only 9. Only two of the 16 subjects had different sugar intakes in the two periods (p!0.05). There were 11 females with a total of 22. All the subjects took a similar amount of sugar in the two periods (p"0.05).
Fig. 3 shows the total percentages of sugar intake from sugar -sweetened beverages and sweet snacks. In the week without tapioca milk tea, subjects consumed more than 85% of their sugar from beverages. The sugar intake in the week with tapioca milk tea from sugar - sweetened beverages was 90% (52.6 g), and from sweet snacks was about 10% (5.8 g). The sugar intake in the week without tapioca milk tea from sugar - sweetened beverages was 86% (48.6 g), from sweet snacks was about 14% (7.9 g). On the middle part, it shows the contribution of major beverage groups to sugar intake
from sugar - sweetened beverages was as follows. In the week with tapioca milk tea sugars from milk tea contributed about 55% (28.9 g) and tea and soft drinks about 21% (11 g) and 11% (5.8 g), respec-tively. These 3 items contributed about 87% of the sugar intake from beverages. In the week without tapioca milk tea sugars from tea contributed about 42% (20.4 g) and milk tea and soft drinks about 20% (9.7 g) and 14% (6.8 g), respectively. These 3 items contributed about 76% of the sugar intake from beverages. In the week without tapioca milk tea, the percentage of sugar intake from tea increased to 42%. On the left part, it shows the contribution of major foods to sugar intake from sweet snacks. In the week with tapioca milk tea, ice products contributed about 26%, cake about 18% and bread and cookies about 17% and 9%, respectively. These 4 items contributed about 70% of the sugar intake from sweet snacks. In the week without tapioca milk tea, sugars from cake contributed about 21%, from ice products about 17% and from bread and cookies about 14% Table 2. Sugar intakes in the period with or without tapioca milk tea by gender
Sugar intakes in the period by gender and percentage of sugar intake against total intake with or without tapioca milk tea
Male n = 16 Female n = 22 All Subjects
TM* NTM† TM NTM TM NTM
mean SD mean SD mean SD Mean SD ! !
Sugar Intakes Glucose 13.8 11.3 15.6 11.5 10.4 5.8 11.8 7.4 21 25 Fructose 11.6 8.6 11.6 8.2 8.2 4.2 8.8 5.7 17 19 Sucrose 36.1 14.2 30.8 14.4 32.1 8.8 25.5 15.5 60 53 Lactose 0.9 1.3 1.5 1.4 1.3 1.7 1.6 1.7 2 3 Total 64.1 28.9 62.9 23.9 54.2 17.5 51.8 20.3 100 100 *TM, Tapioca Milk Tea (With Tapioca Milk Tea)
†NTM, No Tapioca Milk Tea (Without Tapioca Milk Tea)
Bold indicates the significant difference between the week with TM and the week with NTM analyzed by paired t - test, respectively (p!0.05)
and 13%, respectively. These 4 items contributed about 65% of the sugar intake from sweet snacks, respectively.
DISCUSSION
This study was conducted by cross - over design. Subjects were match - paired by sex, age, and department and were randomly
divided into two groups. We found in this study that average sugar intakes from sugar - sweetened beverages and sweet snacks were similar with or without tapioca milk tea, being 58.4!23.2 g/day and 56.5!22.2 g/day, respectively (p!0.05). Even with limited intake of tapioca milk tea, the subjects took the same amount of added sugar from other sugar - sweetened beverages and sweet snacks, suggesting that an established sugar intake level is hard to change. Excessive sugar intake can lead to health problems (6 - 18), Fig 2. Daily sugar intakes (mean!SD) of individuals in males (a) and females (b) with and without tapioca milk tea.
Fig 3. Percentages of sugar intake from sugar - sweetened beverages and sweet snacks, that were in weeks with (upper) or without (below) tapioca milk tea were shown at the left. Contribution of various food groups to either sugar - sweetened beverages or sweet snacks was shown as followed.
and former U.S. President Bill Clinton proposed a plan to stop the sale of cola and other sugar - sweetened beverages in public ele-mentary schools (19). However, our present results proved that restriction of tapioca milk tea showed no substantial benefit in re-ducing sugar intake.
Dietary habits may play an important role because once it is established, it is difficult to change. Socio - psychological and envi-ronmental factors have an effect on changing eating behavior (21). For example, Japanese salt intake is one of the highest in the world and still many people suffer from hypertension, stroke, heart dis-ease, even stomach cancer (22 - 24). For these reasons, Japanese have been trying to reduce salt intake for many years. However, in 2013 it was still 9.8g (25). WHO recommends an intake less than5 g (26). Average intake by Americans is about 8.5 g (27) and they are trying to reduce it to less than 6 g (28). Death rate from stroke and stomach cancer is higher in Japan than in the US (29). Similar habits are seen in the high fat and sugar intake of Americans and many other nations. From these facts, our hypothesis would seem to be correct. Our present results also suggest that the Clinton strat-egy to limit high sugar soft drinks and juices maybe ineffective.
The present result also suggests that to change the behavior, we have to form good habits before bad ones are established. From reports by us and others (30), sugar intake of preschool children (2 - 5 y) was 13.0 g/day at 2 y, about 19.2 g/day at 3 y, about 31.6 g/ day at 4 y, about 29.6 g/day at 5y (30) and 51.6 g at 7 - 12 y. If we express these intakes by percentage against total energy intake (reported by the Nutrition and Health Survey in Taiwan (NAHSIT)), they were 5% (2 y), 6%(3 y), 9%(4 y), 8%(5 y), 10.3%(7, 10, 12 y), and 10.9% (20 - 24 y), respectively. These results indicate that after 4 years old, the percentage of energy from sugar becomes almost 10% and is maintained, indicating that the habit of high sugar intake is already established at 4 years old.
WHO and American Guideline recommended that healthy eating patterns limits added sugars to less than 10% of calories per day. However, WHO recommended further reduction to 5% for better health benefits (31). The young Taiwanese in this study obtain approximately 10.9% of their total intake from added sugars as expressed by percentage against total energy intake reported by NAHSIT (32). Recent American analyses indicate that 18 - 34 years old adults obtain approximately 16.3% of their total intake from added sugars (35).
There are reports about sugar intake from various countries (g/ day) : United Kingdom 85(33), South African 70(34), American adults of 18 - 34y old 92.3(35) and Japanese 24.7(30). Sugars intake in this study is lower than that of American 18 - 34 years old adults, 92.3g/day between the years 2007 to 2008(35), but more than Japanese children 24.7 g/day(30). We can see that sugar intake in Taiwan was between the United States and Japan.
In the present result, whether tapioca milk tea was limited or not, there was still 85% of sugar intake from sugar - sweetened beverages. Sugar intake in the week with tapioca milk tea from sugar -sweetened beverages was 90% (52.6 g), and in the week without tapioca milk tea was 86% (48.6 g), milk tea was the major beverage for sugar intake. In the United States, more than 59% (54 g) of sugar intake was from sweetened beverages in 18 - 34 years old adults, and soft drinks were the leading contributor of sugar intake for this age group (33), but in Japanese children only 25% (6.2g) was from sugar - sweetened beverages (30). In this study, sugar intake from sweet snacks was 10% (5.8 g with tapioca milk tea) and 14% (7.9 g without tapioca milk tea) in Taiwan, 41% (38 g) in United States, 75% (18.5 g) in Japan. This means that in the United States, sugar intake from both beverages and snacks is higher than in Taiwan or Japan. In Japan, although the sweet snacks intake is higher than in Taiwan, because of low intake of sugar - sweetened beverages, the total sugar intake is only half of Taiwan’s. These data show that Taiwanese take most of their sugar from beverages and a
little from snacks. However, as discussed above, it is not easy to limit beverages and this again shows the importance of establish-ing the habit of low sugar intake from beverages from childhood. In Taiwan, kindergartens provide sweet snacks or sugar - sweetened beverages once or twice every day. From the results, we recom-mend that before children establish habits of eating sweet foods, when the child wants to eat something, maybe choosing unsweet-ened natural food can be established as a better habit.
According to the results, during the week with tapioca milk tea, sugar intake from milk tea was about 28.9 g. We used Nutrition and Health Survey in Taiwan (NAHSIT) data, which show a daily energy intake for adults (19 - 30 y) of about 2100 kcal/day (24), the milk tea accounted for 5.7% (28.9 g) of total intake, similar to soft drinks in United States, where total energy intake from soft drinks is 6.4% (36.5g) (27). So we can say the prevalence of American soft drinks and Taiwan milk tea is about the same.
We know that most of the sugar - sweetened beverages contain isomerized sugar, also known as high - fructose corn syrup. It is produced by the hydrolysis of corn starch and other starches and is cheaper than sucrose. It is in soluble form and is usually used in beverages. In recent years, high - fructose corn has been shown to lead to many health problems (6 - 18), and Taiwan has begun to pay attention to this problem. In Taiwan, there are many beverage stores, these stores have begun to reduce the use of isomerized sugar, and instead use sucrose.
The contribution of each sugar to the total sugar intake (about 58.4 g) for the week with tapioca milk tea in the present study was 60% (35 g) for sucrose, 21% (12.3 g) for glucose, 17% (9.9 g) for fructose and 2% (1.2 g) for lactose (Table 2). From the data shown in Fig. 3, sugar intake from beverages was 90% (52.6 g). These results indicate that fructose and glucose (total 38%) were mainly from beverages, and some drink beverage stores are using sucrose in beverages, so sugar - sweetened beverages also contain sucrose (total 60%).
Biochemical pathways of glucose and fructose are different and have different physiological effects. For example, fructose increases blood triglyceride concentration more than glucose (8 - 11), and may lead to an increase in body weight (6 - 8, 12 - 16), and to diabetes (16 - 18). Therefore, we need to recognize the intake of carbohy-drate sources in our daily lives and to understand their impact on health.
Nutritional surveys may have overestimated or underestimated the intake ; in order to prevent it, we used several means : weigh-ing method, food models, standard cards (use of credit card for estimating quantity), and use of food labels for estimating weight, which were our four methods to identify the intake.
This study was conducted in summer. In this season, sugar intake from beverages is thought to be usually higher than in other seasons, because people drink more cold sweet beverages. However, Taiwanese also have hot sweet beverages in winter, which de-creases the overestimation or underestimation problem. Taiwanese young people like to drink sugar - sweetened beverages, so we may speculate that this is associated with the environment and habits. In conclusion, Taiwanese have high sugar intake, especially from beverages, perhaps because of childhood habits. Nutrition educa-tion should be directed to all and the government and the general public must be in agreement in order to avoid health problems caused by bad habits.
DISCLOSURE STATEMENTS
Financial SupportConflict of interest
The authors declare no conflict of interest. We declare that all authors have approved of the manuscript to submit to The Journal of Medical Investigation. We also declared that the contents of the manuscript have not been previously published and are not cur-rently submitted elsewhere.
Authorship
P.Y.L. and T.C.C. contributed in designing the protocol, collect-ing data, analyzcollect-ing data, and writcollect-ing the article. F.Y.L. contributed in analyzing data and writing the article. J.Y.D. and W.L.C. contrib-uted in collecting data. I.K. and H.T contribcontrib-uted in analyzing data and writing the article. S.Y. gave advice on designing the study, interpreting the results, and writing the article.
Ethics of human subject participation
This study was approved by the ethical committee of National Cheng Kung University Governance Framework for Human Re-search Ethics please add number of approval (No. 104 - 029). The participants were informed in detail about the purpose, the advan-tages and disadvanadvan-tages of this study, and their rights and obliga-tions pertaining to their lifestyle. Informed consent was obtained from all the participants.
ACKNOWLEDGEMENTS
The authors would like to thank the subjects for their coopera-tion in participating in this study. We are also grateful to Fooyin University and all the co - researchers and advisors for our study and Dr. Andrew Durkin, Professor Emeritus of Indiana University for editing English. This study was supported by US - Japan Medical Science Program.
REFERENCES
1. Ministry of Finance, R.O.C. (2014) [in Chinese].
http : //web02.mof.gov.tw/njswww/WebProxy.aspx?sys = 100&funid = defjspf2 (accessed January 2016)
2. Health Promotion Administration, Ministry of Health and Welfare (2014) [in Chinese].
http : / / health 99. hpa. gov. tw / Article / articleDetail. aspx ? TopIcNo = 821&DS = 1-life (accessed January 2016). 3. Health Promotion Administration, Ministry of Health and
Welfare. (2014) [in Chinese].
https : //obesityap.hpa.gov.tw/DragonBoatFestival/funsummer /funsummer.aspx (accessed January 2016)
4. Health Promotion Administration, Ministry of Health and Welfare (2013) Daily dietary guidelines.
http : //health99.hpa.gov.tw/educZone/edu_detail.aspx? Catid = 11932 (accessed January 2016)
5. Yang YC : Long - term follow - up study of sugar sweetened bev-erages, snacks and desserts, and refined sugar consumption among preschoolers aged 2 to 5 years [master‘s thesis]. National Taiwan Normal University ; 2012. [in Chinese] 6. Bray GA, Nielsen SJ, Popkin BM : Consumption of high
-fructose corn syrup in beverages may play a role in the epi-demic of obesity. Am J Clin Nutr 79 : 537-543, 2004
7. Vartanian LR, Schwartz MB, Brownell KD : Effects of soft drink consumption on nutrition and health : A systematic review and meta- analysis. Am J Public Health 97 : 667-675, 2007
8. Bocarsly ME, Powell ES, Avena NM, Hoebel BG : High -fructose corn syrup causes characteristics of obesity in rats :
Increased body weight, body fat and triglyceride levels. Pharmacol Biochem Behav 97 : 101-106, 2010
9. Stanhope KL, Griffen SC, Keim N : Consumption of fructose, but not glucose - sweetened beverages produces an atherogenic lipid profile inoverweight/obese men and women. Diabetes 56 : A16 - A17, 2007
10. Swarbrick MM, Stanhope KL, Elliott SS, Graham JL, Krauss RM, Christiansen MP, Griffen SC, Keim NL, Havel PJ : Con-sumption of fructose - sweetened beverages for 10 weeks increases postprandial triacylglycerol and apolipoprotein - B concentrations in overweight and obese women. Br J Nutr 100 : 947 - 952, 2008
11. Teff KL, Elliott SS, Tschöp M, Kieffer TJ, Rader D, Heiman M, et al : Dietary fructose reduces circulating insulin and leptin, attenuates postprandial suppression of ghrelin, and increases triglycerides in women. J ClinEndocrinol Metab 89 : 2963 - 2972, 2004
12. Rippe JM : The health implications of sucrose, high - fructose corn syrup, and fructose : what do we really know? J Diabetes
Sci Technol 4 : 1008-1011, 2010
13. Stanhope KL : Role of fructose - containing sugars in the epi-demics of obesity and metabolic syndrome. Annu Rev Med 63 : 329 - 343, 2012
14. Page KA, Chan O, Arora J, Belfort- Deaguiar R, Dzuira J, Roehmholdt B, et al : Effects of fructose vs glucose on regional cerebral blood flow in brain regions involved with appetite and reward pathways. JAMA 309 : 63-70, 2013
15. Ludwig DS, Peterson KE, Gortmaker SL : Relation between consumption of sugar - sweetened drinks and childhood obe-sity : a prospective, observational analysis. Lancet 357 : 505-508, 2001
16. Schulze MB, Manson JE, Ludwig DS, Colditz GA, Stampfer MJ, Willett WC, et al : Sugar-sweetened beverages, weight gain, and incidence of type 2 diabetes in young and middle -aged women. JAMA 292 : 927-934, 2004
17. Paynter NP, Yeh HC, Voutilainen S, Schmidt MI, Heiss G, Folsom AR, et al : Coffee and sweetened beverage consumption and the risk of type 2 diabetes mellitus : the atherosclerosis risk in communities study. Am J Epidemiol 164 : 1075-1084, 2006
18. Stanhope KL, Schwarz JM, Keim NL, Griffen SC, Bremer AA, Graham JL, et al : Consuming fructose-sweetened, not glucose-sweetened, beverages increases visceral adiposity and lipids and decreases insulin sensitivity in overweight/obese hu-mans. J Clin Invest 119 : 1322-1334, 2009
19. Alliance for a Healthier Generation : A lot can happen in 10 years : Annual Impact Report July 2014 - June 2015. Alliance for a Healthier Generation : Portland, 2015
20. Tseng AT, Tsao HC, Sarukura N, Huang KC, Wang MF, Huang PC, et al : Development of a food composition database of refined monosaccharides and disaccharides in snacks, desserts, and beverages [in Chinese]. Nutr Sci J 35 : 146-156, 2010
21. Hardcastle SJ, Thogersen - Ntoumani C, Chatzisarantis NL : Food Choice and Nutrition : A Social Psychological Perspec-tive. Nutrients 7 : 8712-8715, 2015
22. Yuan M, Chen W, Teng B, Fang Y : Occupational Disparities in the Association between Self - Reported Salt- Eating Habit and Hypertension in Older Adults in Xiamen, China. Int J Environ Res Public Health 13 : 148, 2016
23. Kario K : Key points of the Japanese society of hypertension guidelines for the management of hypertension in 2014. Pulse 3 : 35-47, 2015
24. Burnier M, Wuerzner G, Bochud M : Salt, blood pressure and cardiovascular risk : what is the most adequate preventive strategy? A Swiss perspective. Front Physiol 6 : 227, 2015
25. World Life Expectancy (2016) World health rankings. http : //www.worldlifeexpectancy.com/world - health - rankings (accessed January 2016).
26. WHO. (2012) Guideline : Sodium intake for adults and children. Geneva, World Health Organization (WHO)
27. WHO. (2015) Guideline : Sugar intake for adults and children. Geneva, World Health Organization (WHO)
28. U.S. Department of Health and Human Services and U.S. De-partment of Agriculture. (2015) 2015 - 2020 Dietary Guidelines for Americans. 8thEdition. December 2015.
29. U.S. Department of Agriculture, Agricultural Research Service. 2014. Nutrient Intakes from Food and Beverages : Mean Amounts Consumed per Individual, by Gender and Age, What We Eat in America, NHANES 2011 - 2012
30. Takeichi H, Taniguchi H, Fukinbara M, Tanaka N, Shikanai S, Sarukura N,et al : Sugar Intakes from Snacks and Beverages in Japanese Children.J Nutri Sci Vitaminol 58 : 113-117, 2012 31. Welsh JA, Sharma AJ, Grellinger L, Vos MB : Consumption of
added sugars is decreasing in the United States.Am J Clin Nutr 94 : 726 - 734, 2011
32. Ministry of Health and Welfare (2008) The outline report of the National Health and Nutrition Survey of Taiwan, 2005 -2008. [in Chinese]
https : //consumer.fda.gov.tw/Pages/List.aspx? nodeID= 287 (accessed January 2016)
33. A National Statistics Publication (2011) Family Food in 2011. York : Department for Environment, Food and Rural Affair 34. Vorster HH, Kruger A, Wentzel - Viljoen E, Kruger HS, Margetts
BM : Added sugar intake in South Africa : findings from the adult prospective urban and rural epidemiology cohort study. Am J Clin Nutr 99 : 1479-1486, 2014
35. U.S. Department of Health and Human Services (2014) Nutrition and weight status.
http : / / www. healthypeople. gov / 2020 / topics - objectives / topic/nutrition - and - weight- status/objectives (accessed January 2016)