Transformation of a Woodworking and Furniture
Industrial District in Kampala, Uganda:
Dichotomous Development of SME Cluster and
Large Firm Sector
著者
Yoshida Eiichi
権利
Copyrights 日本貿易振興機構(ジェトロ)アジア
経済研究所 / Institute of Developing
Economies, Japan External Trade Organization
(IDE-JETRO) http://www.ide.go.jp
journal or
publication title
IDE Discussion Paper
volume
171
year
2008-10-01
INSTITUTE OF DEVELOPING ECONOMIES
IDE Discussion Papers are preliminary materials circulated
to stimulate discussions and critical comments
Keywords:
SME, cluster, agglomeration, incubation, woodworking, furniture, Uganda,
Kampala
*
Research Fellow, African Studies Group, Area Studies Center, IDE
([email protected])
IDE DISCUSSION PAPER No.
171
Transformation of a Woodworking
and Furniture Industrial District in
Kampala, Uganda:
Dichotomous Development of SME
Cluster and Large Firm Sector
Eiichi YOSHIDA*
Abstract
Clustering small manufacturers are believed to attain various types of collective
efficiency. A woodworking and furniture SME district in Uganda has created a
learning environment for artisans to start up their own workshops. In the district
workers can access various managerial information including business skills and
input materials easily than outside. Hence it attracted new entrants to follow and
district growth continued. On contrary large firms are locating separately and
dispersedly from SME district and have a negative image to SME. This dichotomy
has been created partly through spatial division of two sectors and partly through
policy favouritism toward large firms.
The Institute of Developing Economies (IDE) is a semigovernmental,
nonpartisan, nonprofit research institute, founded in 1958. The Institute
merged with the Japan External Trade Organization (JETRO) on July 1, 1998.
The Institute conducts basic and comprehensive studies on economic and
related affairs in all developing countries and regions, including Asia, the
Middle East, Africa, Latin America, Oceania, and Eastern Europe.
The views expressed in this publication are those of the author(s). Publication does not imply endorsement by the Institute of Developing Economies of any of the views expressed within.
INSTITUTE OF DEVELOPING ECONOMIES (IDE), JETRO 3-2-2, WAKABA,MIHAMA-KU,CHIBA-SHI
CHIBA 261-8545, JAPAN
©
2008
by Institute of Developing Economies, JETRO
No part of this publication may be reproduced without the prior permission of the
IDE-JETRO.
1. Introduction
Implementation of industrial cluster policy requires that the government prioritize specific industrial sectors and industrial space. In the early period after independence, many Sub-Sahara African (SSA) countries pursued industrialisation through large-scale parastatal industries; however, this policy resulted in many liquidations in the public sector, which proved that the policy direction was not suitable for industrialisation in these countries. Since then, many SSA countries have not had any particular policy focusing on specialisation in an industry sub-sector, primarily because a policy consensus was reached with donor countries that focused on poverty reduction and AIDS care in recent years and on post-civil war restructuring in many countries, including Uganda. Due to this, laissez-faire has remained the basis of governments’ industrialisation concepts, and the domestic industrial environment has remained exactly as it was in the 1960s and 1970s.
Uganda, one of the Least Developed Countries (LDC) and Heavily Indebted Poor Countries (HIPCs) in SSA, had not paid much attention to industrial priorities or to priorities in economic planning, other than structural adjustment. The industrial areas were zoned, and some estates, which were developed in the early years after independence, were occupied by the parastatal industries and public investment. Some parts of these plots became vacant following a series of divestures and privatisation failures. On the other hand, as in many other SSA countries, small industries in Uganda have grown substantially and have come to dominate the urban industrial landscape.
In the industrial landscape of Uganda, small firms in a similar production range created industrial districts which are called clusters or agglomerations; whereas large firms in a similar production located themselves in a dispersed manner in the industrial zones developed around the city. However, the current concept of spatial planning and zoning has not taken into account the slum-like growth of SMEs’ spatial concentration. Hence, SME sub-sectors including furniture, metalworking, and other industries were excluded from industrial policy formulation. Instead, information from external sources made the local governments aware of the significance of the geographical concentration of small firms as a form of industrial cluster. Even in Uganda, despite the fact that a visible agglomeration of small firms in the woodworking and metalworking sectors exists, the government recognised neither the roles these firms played nor the significance of prioritisation of industry or industrial space.
This paper deals with the significance of clusters made up mainly of SMEs in an African LDC context. As these are clusters formed without relevant cluster policy or industry prioritisation policy, they may present a slightly different context than other cases in this publication. This study selected
Uganda as a typical LDC in the SSA region and chose the woodworking and furniture industry as a typical SME cluster sector in SSA. There are many small industry clusters or districts in SSA without any relevant policy guidance and which maintain no mutual relations with large firms. In this sense, it is significant to examine how the dominant SME clusters transformed separately from the large firms without policy guidance and to study what kind of intervention should be proposed in the event that this trend strengthens.
This paper begins by introducing the global trend in the woodworking sector and attempts to map out where the Ugandan woodworking sector might be located in this global trend before looking at woodworking cluster formation. Then, we see how the trajectory of sectoral dynamism is separate from the mushrooming of woodworking SMEs. As mentioned above, SMEs form clusters and large firms are dispersed, so this study discusses the two sectors separately. In contextualising the SMEs’ location preference within and outside of the districts, this study examines how the SME clusters maintained distance and stood apart from large firms in their institutional aspects, particularly from an industrial spatial planning point of view. Finally, the chapter concludes by discussing the problems caused by this dichotomous development of SMEs and large firms.
2. Global Trends in Furniture Production and Trade
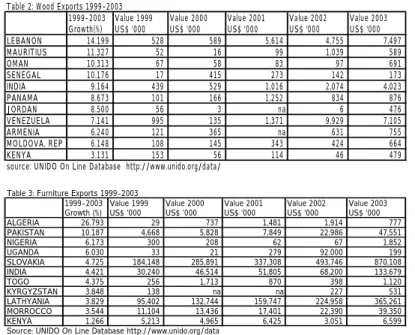
A major change has been emerging during the past decade in the traditional location patterns of furniture and woodworking industries throughout the world, due to changes in global demand. These changes have been caused by the globalization of modern urban lifestyle, the growth of a mass urban middle classes in developing countries, and modernization of product distribution systems. It is also becoming difficult in recent years to distinguish between furniture designs of different countries when they are exhibited side by side, for example at the ‘Milano Salone’ International Furniture Trade Show or the International Furniture Fair Tokyo. Along with the expanding distribution of modular furniture, production and exports have been dramatically increasing in China and East European countries where supplier companies are concentrated. South Africa, being rich in forest resources, has been partly incorporated into the furniture value chain developed by the global woodworking industry, as components processed in South Africa are moved on to further processing outside the region. In terms of the trade volume of African countries, distribution has been increasing in East African countries such as Malawi, Uganda, and Kenya (Tables 1, 2, 3) (Kaplinsky et al. 2002, 2003; Kaplinsky and Readman 2004; Loebis and Schmitz 2005).
However, these international trade statistics do not show the overall trend of the entire woodworking industry in these African countries. The reality in these countries is that small,
medium, and micro enterprises in the sector generate the majority of the industry’s production; however, they have been excluded from this healthy trend of global production growth and have in fact been facing a severe struggle for survival in a less dynamic domestic consumer market in recent years. Small, medium, and micro enterprises (SMEs) involved in woodworking, as in many other developing countries, form spatial concentrations or agglomerations, even in poor countries like Uganda. However, between SMEs and large firms in Uganda’s woodworking sector, there exists not only a spatial division but market segregation as well, with the upper market reserved for
Table 1: Global Furniture Trade-Top15 Net Exporting Countries
Country Gross exports Net exports Net exports exp. Growth(%)
year 2000 1995 2000 1995-2000 Italy 8359 7595 7395 -3 China 4582 1671 4412 164 Canada 5179 685 2044 198 Poland 2191 1180 1815 54 Indonesia 1518 819 1498 83 Malaysia 1596 826 1491 80 Denmark 1900 1687 1209 -28 Mexico 3315 468 1173 151 Thailand 949 712 909 28 Spain 1453 523 531 2 Slovenia 586 409 461 13 Czech Rep. 780 148 445 201 Romania 445 472 377 -20 Sweden 1298 510 338 -34 Brazil 496 212 333 57 Total of rest 22742 Total 57388
Source: UNCTAD/WTO International Trade Centre on line database http://www.intracen.org (US$million)
large firms and the rest for SMEs. Needless to say, export markets are hardly accessible to SMEs, which were accustomed to shipping their handcrafted products to neighbouring Sudan, Rwanda, and Congo before regional conflicts disrupted regional trade routes.
The above-mentioned shift in the international trade of furniture and woodworking products has two primary causes. The first of these is a change on the consumer side (i.e., global urbanization), and the other is a change on the supplier side (logistical system development). Due to the worldwide trend toward urbanization, along with the information diffusion through globalized media like satellites, television, and the Internet that typifies modern urban lifestyle, furniture consumers have become more familiar with modern design styles that are simple and minimalist as well as lightweight. These urbanized consumers have less residential space than their predecessors, and their household units are of a wider variety, including not only those who are unmarried and married-with-children, but also those who are single, living with younger and older generations, single mothers, pensioners both single and couples, divorced, and widowed. This wide variety of households leads to different lifestyles such as multi-habitation, co-habitation, connected housing, collective housing, same-sex habitation, and so on. The demand for household space and furniture has this become more complex, demanding flexibility on the producer side.
Table 2: Wood Exports 1999-2003 1999-2003 Growth(%) Value 1999 US$ '000 Value 2000 US$ '000 Value 2001 US$ '000 Value 2002 US$ '000 Value 2003 US$ '000 LEBANON 14.199 528 589 5,614 4,755 7,497 MAURITIUS 11.327 52 16 99 1,039 589 OMAN 10.313 67 58 83 97 691 SENEGAL 10.176 17 415 273 142 173 INDIA 9.164 439 529 1,016 2,074 4,023 PANAMA 8.673 101 166 1,252 834 876 JORDAN 8.500 56 3 na 6 476 VENEZUELA 7.141 995 135 1,371 9,929 7,105 ARMENIA 6.240 121 365 na 631 755 MOLDOVA, REP 6.148 108 145 343 424 664 KENYA 3.131 153 56 114 46 479
source: UNIDO On Line Database http://www.unido.org/data/
Table 3: Furniture Exports 1999-2003 1999-2003 Growth (%) Value 1999 US$ '000 Value 2000 US$ '000 Value 2001 US$ '000 Value 2002 US$ '000 Value 2003 US$ '000 ALGERIA 26.793 29 737 1,481 1,914 777 PAKISTAN 10.187 4,668 5,828 7,849 22,986 47,551 NIGERIA 6.173 300 208 62 67 1,852 UGANDA 6.030 33 21 279 92.000 199 SLOVAKIA 4.725 184,148 285,891 337,308 493,746 870,108 INDIA 4.421 30,240 46,514 51,805 68,200 133,679 TOGO 4.375 256 1,713 870 398 1,120 KYRGYZSTAN 3.848 138 na na 227 531 LATHYANIA 3.829 95,402 132,744 159,747 224,958 365,261 MORROCCO 3.544 11,104 13,436 17,401 22,390 39,350 KENYA 1.266 5,213 4,965 6,425 3,051 6,599 Source: UNIDO On Line Database http://www.unido.org/data
Modular furniture has also enabled the globalization of distribution. Modular furniture (assembled by consumers) distributed through mass merchandise chain stores such as IKEA, as well as sales through online catalogues such as Belle Maison in Japan, have succeeded in entrusting the task of assembly to consumers. This has reduced the bulkiness of furniture transportation, leading to significant cost reduction in furniture production and distribution. This situation has promoted the globalization of supply management, which in turn has promoted the globalization of the supply chain network.
Consumers, mainly those in the urban middle class in developing countries, have also begun to show strong preferences for global, modern designs over traditional, heavy, extravagant styles. The traditional industries of furniture, woodworking, and woodcraft even in the developing world have been influenced by these changes. Also, due to the above-mentioned systematization of production and globalization of distribution, distribution costs for modular furniture were reduced, thereby enabling transactions with distant lumber sources and woodworking production centres. Some non-western home ware products played a role in this; witness how East Asian furniture, including "futons" (Japanese sleeping mattresses), was modified and adopted into the modern western lifestyle in the 1980s and 1990s. With this development, influenced by the so-called “ethnic boom,” traditional design models were applied to meet the demands of modern western lifestyle. In Japan, demand increased for Balinese furniture, Vietnamese furniture, and wood products to fit into an ordinary Japanese room size. These various furniture products were increasingly exported through a number of different channels.
On the production side, evidence of this global trend can be observed in the growth of exports from transitional economies, in terms of production volume and added value in the overall
manufacturing industry, starting from 1993. This growth was strongly displayed in
Table 4 : Global Industrial Production Index between 1993 and 2003 (%)
1993 1998 2003 1993 1998 2003 1993 1998 2003 Food and beverages 74.4 73.5 71.7 4.5 3.6 4.6 21.2 22.9 23.7 Tobacco products 53.2 52.3 51.6 3.6 1.9 4.2 43.2 45.9 44.2
Textiles 63.9 63.1 56.1 2.9 2.5 3.5 33.2 34.5 40.4
Wearing apparel, fur 75.2 70.5 59.4 3.1 3.6 5.3 21.7 25.9 35.3 Leather, leather products and footwear 63.5 63.9 56.5 4.4 3.5 4.6 32.1 32.6 38.9 Wood products (excl.furniture) 83 84.2 83 2.9 2.6 4 14.1 13.2 13 Paper and paper products 86.3 85.8 83.1 2.7 2 3.5 11 12.3 13.5 Printing and publishing 90.9 90.7 89.9 1.2 1.4 1.9 7.9 7.9 8.2 Coke, refined petroleum products, nuclear fu 62.3 60.8 58.4 4.4 3.4 4.1 33.3 35.8 37.5 Chemicals and chemical products 80.5 80 78.4 2.8 1.7 2.4 16.7 18.4 19.2 Rubber and plastics products 78.9 79.3 76.4 2.3 2.1 3.6 18.8 18.6 20 Nonmetallic mineral products 74.4 73.6 70.4 4.7 3.8 5.1 20.9 22.6 24.5 Basic metals 77.4 77.6 73.6 6.8 4.6 6.1 15.8 17.9 20.3 Fabricated metal products 86.2 86.7 83.5 2.1 1.8 3.3 11.7 11.5 13.2 Machinery and equipment n.e.c 86.1 87.7 84.1 3.3 2.5 3.4 10.5 9.8 12.5 Office accounting and computing machinery 91.6 93.4 90.6 0.6 0.3 0.3 7.8 6.4 9.1 Electrical machinery and apparatus 91 91.4 89.2 1.8 1.5 2.6 7.2 7.2 8.3 Radio, television and communication equipme 72.9 76.8 72.6 1.8 1.3 1.7 25.3 21.9 25.7 Medical, precision and optical instruments 90.4 92 91.2 2.4 1.6 2.5 7.2 6.4 6.3 Motor vehicles, trailers, semi-trailers 86.8 87.3 84.6 1.7 1.7 2.1 11.4 11 13.3 Other transport equipment 83.5 81.7 75.8 4.6 2.8 4 11.9 15.5 30.3 Furniture; manufacturing n.e.c 87.2 86.2 83 1.8 2.2 3.6 11 11.7 13.4 Source: UNIDO On Line Database http://www.unido.org/data
ISIC(Rev.3)-Branch Developed market economies Transition economies Developing countries
the furniture and woodworking sector. Growth of manufacturing in developing areas, excluding transitional economies, was powered by production of radios, televisions, communications equipment, and automobiles; however, the growth in furniture and woodworking was somewhat slower.
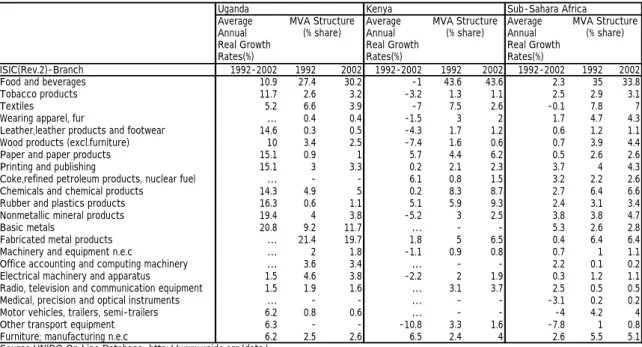
Nevertheless, the furniture and woodworking sector in East Africa also showed solid development, as shown in Table 4. Annual economic growth in the 1990s exceeded six percent in Uganda, and industrial production in Uganda exceeded the average growth rate for all manufacturing industries in Sub-Sahara Africa, except communications equipment. The growth of furniture production maintained a similar level. Similarly, the increase in production in the furniture and woodworking sector in Kenya was 2.5 times greater than the African average. Although manufacturing businesses stagnated in Kenya during this period, the furniture and woodworking industry showed the largest increase in production volume among all industries, with a 6.5 percent growth rate (Table 5).
In terms of trade volume, African countries in general are not in the top tier in worldwide exports, and South Africa ranks the highest, at 28th. However, these statistics include only a very limited number of business types. In the Ugandan Industrial Production Index, for example, data on the nation’s furniture sector was sourced from only seven companies, and so the data does not cover numerous SMEs that belong to Uganda’s aforementioned industrial agglomerations.
According to the Uganda Business Register, which includes SMEs, there are more than 3,000 business establishments in the furniture and woodworking sector in Uganda, including family-operated backyard businesses as well as small roadside workshops. The discrepancy between these two data sets indicates that most business establishments in the furniture and
Table 5: Average Annual Real Growth Rates per Industry Sector
Uganda Kenya Sub-Sahara Africa Average Annual Real Growth Rates(%) Average Annual Real Growth Rates(%) Average Annual Real Growth Rates(%) ISIC(Rev.2)-Branch 1992-2002 1992 2002 1992-2002 1992 2002 1992-2002 1992 2002 Food and beverages 10.9 27.4 30.2 -1 43.6 43.6 2.3 35 33.8 Tobacco products 11.7 2.6 3.2 -3.2 1.3 1.1 2.5 2.9 3.1 Textiles 5.2 6.6 3.9 -7 7.5 2.6 -0.1 7.8 7 Wearing apparel, fur … 0.4 0.4 -1.5 3 2 1.7 4.7 4.3 Leather,leather products and footwear 14.6 0.3 0.5 -4.3 1.7 1.2 0.6 1.2 1.1 Wood products (excl.furniture) 10 3.4 2.5 -7.4 1.6 0.6 0.7 3.9 4.4 Paper and paper products 15.1 0.9 1 5.7 4.4 6.2 0.5 2.6 2.6 Printing and publishing 15.1 3 3.3 0.2 2.1 2.3 3.7 4 4.3 Coke,refined petroleum products, nuclear fuel … - - 6.1 0.8 1.5 3.2 2.2 2.6 Chemicals and chemical products 14.3 4.9 5 0.2 8.3 8.7 2.7 6.4 6.6 Rubber and plastics products 16.3 0.6 1.1 5.1 5.9 9.3 2.4 3.1 3.4 Nonmetallic mineral products 19.4 4 3.8 -5.2 3 2.5 3.8 3.8 4.7 Basic metals 20.8 9.2 11.7 … - - 5.3 2.6 2.8 Fabricated metal products … 21.4 19.7 1.8 5 6.5 0.4 6.4 6.4 Machinery and equipment n.e.c … 2 1.8 -1.1 0.9 0.8 0.7 1 1.1 Office accounting and computing machinery … 3.6 3.4 … - - 2.2 0.1 0.2 Electrical machinery and apparatus 1.5 4.6 3.8 -2.2 2 1.9 0.3 1.2 1.1 Radio, television and communication equipment 1.5 1.9 1.6 … 3.1 3.7 2.5 0.5 0.5 Medical, precision and optical instruments … - - … - - -3.1 0.2 0.2 Motor vehicles, trailers, semi-trailers 6.2 0.8 0.6 … - - -4 4.2 4 Other transport equipment 6.3 - - -10.8 3.3 1.6 -7.8 1 0.8 Furniture; manufacturing n.e.c 6.2 2.5 2.6 6.5 2.4 4 2.6 5.5 5.1 Source UNIDO On Line Database http://www.unido.org/data/
MVA Structure (% share) MVA Structure (% share) MVA Structure (% share)
woodworking industry are SMEs that do not appear in the rosy international trade statistics of recent years.
3. Historical Overview of the Furniture and Woodworking Industry in Uganda
In the central part of Africa, the vast tropical rain forest spreads from the Congo Basin into Uganda, which is endowed with abundant forestry resources including mahogany, mvule, mgavu, and other hardwood species. Since there are also extensive forestry resources along the coast of Lake Victoria, Uganda has acted as a supply centre of railway sleepers and other components since the colonial period, ever since the colonial railway was laid between Kampala and Mombasa. Prior to Uganda’s independence in 1962, the domestic industry was mainly composed of colonial enterprises that farmed and processed traditional products including sugar, tea, and coffee. There was limited interest in the localization of manufacturing industries among colonial settlers, other than the above-mentioned industries for small local consumption markets, which were supplied by Indian immigrants. Craftspeople from South Asia played an important role in this early stage.
Compared with other former British African colonies, where there were restrictions on the residency of indigenous African people in the cities, Uganda‘s land system or tenure was unique in that the Buganda Kingdom was allotted a parcel of land by the colonial authority to administer autonomously. The city of Kampala, which was the capital city of Uganda Protectorate, and the city of Mengo, which was the capital city of the Buganda kingdom, overlapped to form a twin city much like Budapest. So, it was not impossible for Africans to secure the freedom to live in the city
if their residence was on the Buganda kingdom side. However, for Ugandan people, starting businesses was, in general, extremely difficult, as access to technical education as well as finance was extremely limited.
The scale of the woodworking industry sector in Uganda prior to independence was extremely limited compared to the scale of the plantation sector. The woodworking sector mainly produced the railway sleepers necessary for laying the rail of the Uganda Railways to connect the Indian Ocean and the inland plantations, The woodworking sector also covered the needs of the increased settler population; to meet the settlers’ needs, the woodcraft jati/caste from Gujarat, India, and a group of South Asian Muslim woodcrafters who settled in Uganda played an important role in importing woodworking skills and technology (Ministry of Information, Broadcasting and Tourism 1964).
After independence from the UK in 1962, restrictions on migration to, and employment in, cities affecting Ugandan people were eased, and the environment for business start-ups was dramatically changed; however, most of the woodworking technology and its management were still in the hands of the Indian immigrants. The problems associated with industry ownership by Indian immigrants after independence led to the idea that the Indians should hand over the means of production to the native people of Uganda, which consequently resulted in the forcible realization of the so-called Africanization of the economy in 1972. In August 1972, the Idi Amin regime ordered foreign expatriates, including Indians as well as anyone who carried a British passport, to leave the country within three months, resulting in the departure of Indian craftspeople and foreign owners from the woodworking industry and the abrupt devastation of the sector.
Even in the furniture and woodworking sector, large firms and small workshops were handed over to indigenous Ugandans. Some owners legitimately purchased their holdings from deported Indian immigrants, while others were given these as gifts by the dictatorial president, Idi Amin. A small number of remaining settlers and Ugandan craftspeople who formerly worked in the industry were forced to become independent craftspeople or spin off their own companies. However, the domestic economic environment, including the woodworking industry as well as the overall manufacturing sector, was plunged into long-term stagnation from 1972 onward, which persisted through the period of intermittent civil war between 1968 and 1986. A new industrial landscape did not arise, and agglomeration did not develop.
Since Yoweri Museveni, the president to date, assumed power and stabilized internal affairs in 1986, the economic environment for the manufacturing and woodworking industry has changed considerably. Development assistance funds began to flow in, and thereafter private investment increased gradually. Deported Indians began to return, spurred by the government's decision in 1992 to return the property and assets of deported former residents. This accelerated the inflow of private funds, which led to an increase in domestic investment as a whole.
The increased inflow of development assistance funds, supported by the stable government, helped expand the amount of investment funds flowing into the cities, initiating a boom in the housing and construction sector and in the promotion of business in general.
The business environment for SMEs in Uganda thus went through four basic stages:
1. The period of colonization, when the inflow of Ugandan people into cities was restricted and free business promotion was impossible;
2. The early period of civil war, when arguments over the ownership of production heightened and few spin-offs from Indian production facilities were possible;
3. The period of turmoil when the economy deteriorated, and business management as well as registration of business establishments were extremely regulated; and
4. The current period, in which the free movement of people and the conducting of private business have become largely possible.
4. Methodology
This chapter examines how the locational concentration of SME clusters has been transformed, using the Ugandan woodworking and furniture industry as an example. In order to make the historical transformation visible, this study employed the flowchart approach to industrial cluster transformation, which sets up a time series framework for analysing industrial cluster development (Kuchiki 2005).
In order to characterise how the concentration had been chosen by SMEs and how the stand-alone position had been selected by large firms, we conducted our own survey by collecting data from major furniture and woodworking firms as well as from SMEs in the agglomerated areas. For comparison purposes, data was collected from dispersed firms in small towns outside the market thresholds of the above-mentioned agglomerations.
This survey was conducted in the Bwaise area in the city of Kampala, the largest woodworking SME agglomeration, from January through August of 2002. At the same time, research was conducted on 30 workshops in the Natete Area, a smaller agglomeration in one of the suburban commercial centres of Kampala. For the purpose of comparison between agglomerated and dispersed firms, data was collected in 2004 on approximately the same number of companies in Kabale, a local town of 30,000 inhabitants and the district administration centre of one of Uganda’s 58 local districts.
This study collected data from firms in the woodworking and furniture industry districts where SMEs are concentrated. Moreover, data was separately collected from large firms which are located in a dispersed manner and are distant from these SME agglomerations. The above-mentioned two areas are easily recognisable along the major traffic route in Kampala, capital city of Uganda. More
contextual explanation of the examined areas will be provided below. This range of data allowed us to compare the characteristics of agglomerated firms and non-agglomerated ones.
Firms studied were engaged in actual woodworking processes, including machine work and manual work, and/or designing work. Firms excluded from the survey were those who supply timber, fabrics, and products other than furniture products for wholesale and retail. In-depth interviews were conducted in 2002 with the help of interpreters fluent in Luganda/Nyankore/Bakiga and English. Data was collected on the general characteristics of the firms, general locational preferences, investment motivation, and managerial problems faced by the firms.
Apart from the above-mentioned three SME cases, interview surveys were arranged with five large woodworking firms out of 13 firms in the Uganda Business Directory, all of which were located individually in different industrial zones. So, this study assumes that the data from the large firms does not reflect the character of the SME industry clusters.
5. Locational Preference among Woodworking and Furniture Firms
In this section, the decision-making process of large firms will be examined. Large-scale woodworking companies (hereinafter referred to as "major woodworking firms") in this case are member companies of the Uganda Chamber of Commerce (UCCI) or the Uganda Manufacturers' Association (UMA), or else they were selected based on their being listed in the Uganda Business Directory issued by Monitor News and being equipped with corporate landline phones (Monitor 2002).
Major woodworking companies are individually located in different industrial zones, including the Kampala Industrial Area, Kireka, Kawenpe, Bwaise, Nalukorongo, and Port Bell. These areas are all in the statutory zoned areas created under the Kampala Planning Act. In the Kampala metropolitan area, the land zoning concept is strictly applied and trade licenses are rarely granted outside of the designated zones; therefore, location other than in areas designated for an industry would be difficult (USAID Presto Project 1999).
In an attempt to compare the locational preferences of major companies, this study utilized the responses from five out of the 13 companies which cooperated with our interviews in Kampala. Four out of five of these companies were recipients of foreign direct investment (FDI). The history of each company’s investment is relatively short; the first company arrived in 1993, one year after the return of assets to Indians was publicized.
The results of our interviews indicated that the most important factors affecting location preference were the rent, price of plots, and the availability of skilled labour, followed by the costs of infrastructure, such as factory construction, utilities, etc. Other significant factors included road
priority Reason to choose current location 1 Cost of plot
Skilled labour in Kampala 2 Infrastructure/utility 3 Infrastructure/transport
Financial instituttion Local market
Local timber and other material suppliers Living conditions
4 Legal system Political stability 5 Traffic congestion 6 Investment incentives/tax
Local subcontracting partners source own survey
Table 6 : Locational Preference among Major Investers in Furniture and Woodworking Sector
infrastructure, access to financial institutions, and the existence of local consumer markets, in addition to access to suppliers of raw materials and good living environments.
Factors of minor importance included levels of corruption, personal influence, availability of unskilled labour, proximity to companies of similar origin, and availability of knowledge, information, and technology, etc. The access to export markets as well as subcontractors around Kampala was also of limited importance.
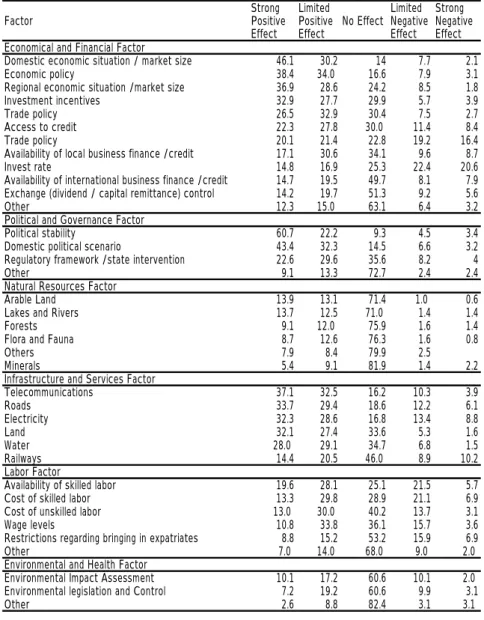
The availability of subcontractors is usually of high importance to non-vertically-integrated industries, but this matter was not given much attention in research conducted by the Uganda Investment Agency concerning domestic FDI companies' awareness of the Ugandan investment environment. In this Uganda Investment Authority study, the stabilization of political affairs was overwhelmingly mentioned as a motivating force for investment. Uganda’s period of civil war in the 1970s and 1980s resulted in withdrawal of investments and temporary abandonment of assets. Many returning Indian managers who actually experienced this period mentioned the critical condition of internal affairs during that time. Next in importance as an agglomeration factor was the size of the domestic market, followed by physical infrastructure, including telephone lines, roads, factory plots, and electricity (Uganda Investment Authority 2003).
In other research by UIA, power supply issues such as power outages, supply shortages, and unstable voltages were raised as issues for the management and administration of companies of all sizes. Lack of landline phones, maintenance delays, and poor roads were raised next as obstacles to development (Table 7). Based on the above results, stabilization of domestic politics was found to be the top priority for promotion of industrial development. However, once the political situation is stabilized, the availability of industrial sites becomes important for SMEs, and stable and inexpensive infrastructure becomes necessary for large firms. Thus, access to suitable industrial plots seems to be critical for firms of all sizes.
and large-firm investors in Uganda. A central question is: “Why is access to industrial plots raised as such an important item?”
Table 7: Most Important Factors that Determind Initial Decision to Invest in Uganda Factor Strong Positive Effect Limited Positive Effect No Effect Limited Negative Effect Strong Negative Effect Economical and Financial Factor
Domestic economic situation / market size 46.1 30.2 14 7.7 2.1 Economic policy 38.4 34.0 16.6 7.9 3.1 Regional economic situation /market size 36.9 28.6 24.2 8.5 1.8 Investment incentives 32.9 27.7 29.9 5.7 3.9 Trade policy 26.5 32.9 30.4 7.5 2.7 Access to credit 22.3 27.8 30.0 11.4 8.4 Trade policy 20.1 21.4 22.8 19.2 16.4 Availability of local business finance /credit 17.1 30.6 34.1 9.6 8.7 Invest rate 14.8 16.9 25.3 22.4 20.6 Availability of international business finance /credit 14.7 19.5 49.7 8.1 7.9 Exchange (dividend / capital remittance) control 14.2 19.7 51.3 9.2 5.6 Other 12.3 15.0 63.1 6.4 3.2 Political and Governance Factor
Political stability 60.7 22.2 9.3 4.5 3.4 Domestic political scenario 43.4 32.3 14.5 6.6 3.2 Regulatory framework /state intervention 22.6 29.6 35.6 8.2 4 Other 9.1 13.3 72.7 2.4 2.4 Natural Resources Factor
Arable Land 13.9 13.1 71.4 1.0 0.6 Lakes and Rivers 13.7 12.5 71.0 1.4 1.4 Forests 9.1 12.0 75.9 1.6 1.4 Flora and Fauna 8.7 12.6 76.3 1.6 0.8 Others 7.9 8.4 79.9 2.5 Minerals 5.4 9.1 81.9 1.4 2.2 Infrastructure and Services Factor
Telecommunications 37.1 32.5 16.2 10.3 3.9 Roads 33.7 29.4 18.6 12.2 6.1 Electricity 32.3 28.6 16.8 13.4 8.8 Land 32.1 27.4 33.6 5.3 1.6 Water 28.0 29.1 34.7 6.8 1.5 Railways 14.4 20.5 46.0 8.9 10.2 Labor Factor
Availability of skilled labor 19.6 28.1 25.1 21.5 5.7 Cost of skilled labor 13.3 29.8 28.9 21.1 6.9 Cost of unskilled labor 13.0 30.0 40.2 13.7 3.1 Wage levels 10.8 33.8 36.1 15.7 3.6 Restrictions regarding bringing in expatriates 8.8 15.2 53.2 15.9 6.9 Other 7.0 14.0 68.0 9.0 2.0 Environmental and Health Factor
Environmental Impact Assessment 10.1 17.2 60.6 10.1 2.0 Environmental legislation and Control 7.2 19.2 60.6 9.9 3.1 Other 2.6 8.8 82.4 3.1 3.1 source: Uganda Investment Authority (2003)
6. Woodworking and Furniture SMEs in Urban Industrial Districts and Local Towns
6.1 Characteristics of the Surveyed Areas
Uganda’s manufacturing industry is primarily concentrated in four sectors: metal processing, woodworking, leather processing, and food processing.1 These sectors, as seen in Tables 6 and 7, are dominated by SMEs. This implies that people can start these businesses with little initial capital, limited manual tools, and small workshop space. Among these sectors, the metal processing and woodworking businesses are known for their obvious agglomeration along major roads in Kampala (Tables 8 and 9).
Table 8: Number of Businesses in the Manufacturing Sector in 2001 number of business employment employment per establishment Wearing Apparel 3418 5667 1.7 Furniture 3088 10986 3.6
Grain mill products,starches 1747 6433 3.7
Fabricated metal 1659 6418 3.9
coffee processing 331 4653 14.1
publishing and printing 266 2504 9.4
bakery 200 2412 12.1
sawmilling and planing 154 807 5.2
non-metalic mineral products 138 1731 12.5 spirts, alcohol, wine and beer 131 1376 10.5 Source: UBR(2002) Uganda Business Register 2001/2002
Table 9: Number of Businesses according to employment (2001) number of business employment employment per establishment Tea Processing 31 19707 635.7 Furniture 3088 10986 3.6
grain mill products , starches 1747 6433 3.7
fabricated metal 1659 6418 3.9
wearing apparel 3418 5667 1.7
coffe processing 331 4653 14.1
publishing and printing 266 2504 9.4
suger 5 4253 850.6
textile 67 2398 35.8
chemical products 65 1983 30.5
Source: Uganda Business Register 2001/2002
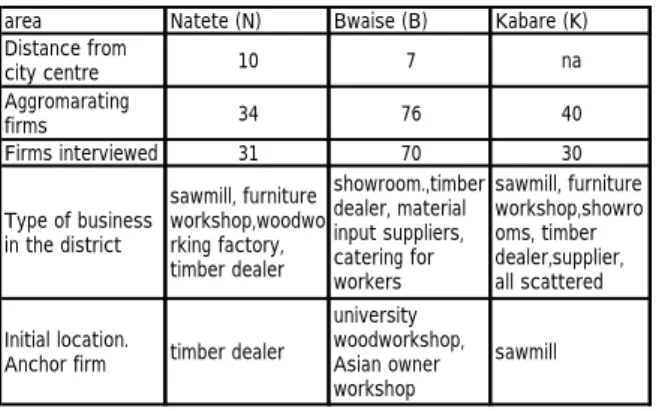
Through in-depth interviews and with paper questionnaires, the interviews were conducted in the largest agglomeration of furniture and woodworking firms in the country, in the Makerere-Kavule/Bwaise area, and in a smaller agglomeration in the Natete area chosen for comparison purposes. Also, an area of dispersed firms in the town of Kabare was covered for comparison purposes.
The characteristics of three areas are as follow.
Area B (Bwaise/Makerere-Kavule, Kawempe Division, Kampala City, Uganda) contains the
1 The formation of a stable administration in 1986 ushered in a period of free personal and residential movement and promotion
of private business, which carried vast consequences for Ugandan SMEs. Despite historically restrictive polices governing Ugandan SME start-up, structural adjustment policies from the late 1980s through the early 1990s resulted in a massive number of people leaving the public sector to start businesses, along with Ugandan returnees from Japan and western countries. These returning migrants’ remittances also encouraged those who received the funds to start SMEs. These tendencies are especially observable in the manufacturing sector.
largest number of woodworking firms in the entire Great Lakes region. Located between the city centre and the suburbs, it has become an un-zoned de facto industrial area for small and medium businesses, and the area also accommodates a university, primary schools, and churches and mosques. Firms and workshops are spread along the two major paved roads, which meet at a roundabout, with the heaviest concentration of firms observed in the space surrounding the roundabout. Seventy-five workshops are located in this area. The 70 that responded to our survey are clustered in a space of about two square kilometers. The study thus regards Area B as representing a large and concentrated industrial district.
Area N (Natete, Kampala City, Uganda) is located along the major national highway leading to the western region of the country and continuing into neighbouring Rwanda. The area accommodates about 40 workshops. The 31 of these that responded to us are clustered in a space of about four square kilometers. The study thus assumes that the firms in Area N represent a smaller-scale agglomeration.
Area K (Kabare Town, Kabare District, Uganda) accommodates about 40 workshops and firms in an area of 30 square kilometers. Thirty of these were successfully surveyed. These firms and workshops are spread out across the town, with some located in a group of several workshops and some standing alone. The study assumes that the firms in Area K represent dispersed (non-agglomerated) firms (Table 10).
Table 10: Woodworking industrial districts in Uganda, cases studied area Natete (N) Bwaise (B) Kabare (K) Distance from city centre 10 7 na Aggromarating firms 34 76 40 Firms interviewed 31 70 30 Type of business in the district sawmill, furniture workshop,woodwo rking factory, timber dealer showroom.,timber dealer, material input suppliers, catering for workers sawmill, furniture workshop,showro oms, timber dealer,supplier, all scattered Initial location.
Anchor firm timber dealer
university woodworkshop, Asian owner workshop
sawmill source: own survey
6.3 Site Selection Process during Agglomeration Formation
The survey indicated several main reasons why the woodworking SMEs chose the agglomeration sites as their locations.
The highly agglomerated Area B was selected by SMEs primarily because it lies along a major traffic road, allowing access to transportation and contact with customers (creating publicity for the firms). The next most common reason, cited by approximately one-third of the respondents, is that
there is already a permanent pool of customers in the area. A similar response was that that there is a market close to the commercial centre, implying that locating in the area creates high publicity for the firm. Taken together, these two responses represent the single most important factor in the firms’ decision to locate in the region. Other responses included ease of obtaining plots of land for industrial use (Table 11).
Table11: Location Preference Among Furniture/Woodworking Small Medium and Micro Enterprise workshop interviewed market (proximity to commercial centre) easy access to machine workshop easily available plot for sheds enough space for showroom along major traffic road input materials supplier proximity to home customer readily in the area name value of district other reason B 70 13 4 10 1 43 1 0 23 9 7 N 30 7 5 11 0 8 7 5 5 0 2 K 30 22 6 14 0 2 7 1 0 1 4 Source:own survey
In contrast, in Area N, there was no reason for agglomeration given by more than half of all firms surveyed. The ease of securing a location was cited by about one-third. As in Area B above, another reason was the presence of customers/market/publicity in the agglomeration site. Other reasons included the region’s location along a major intercity road as well as the ease of obtaining input goods.
In Area K which contains the dispersed firms, two-thirds listed the region’s proximity to a central commercial district as a reason for locating there, and low rent was cited by nearly half. Agglomeration-related reasons, such as the presence of a market, were not mentioned very often.
Judging from the responses given in these three areas, the availability of relatively inexpensive workshop plots seems to be a key issue. Since major traffic highways are cited as being more important than local road infrastructure, it seems that the publicity effect resulting from location along a major paved highway is critical for a small furniture workshop. Existence of a market or proximity to the centre of a commercial district also means that the area’s centrality attracts a general mass of shoppers to the area, who pass by the woodworking shops on the main roads.
The agglomerations discussed here were transformed substantially over the 1980s and 1990s. In the beginning, some series of trigger events induced gradual agglomeration of companies in the spaces, and various forces made this agglomeration self-reinforcing (discussed further below), leading to the expansion of the agglomerations. Companies which located in the region at the early stage of the agglomeration process (the “early group”) might perceive the area differently, and also may have utilized different decision-making factors regarding location preference, than those who located there after the agglomeration grew sizeable enough to be well-known by customers and producers outside the area (the “middle stage group” and “late group”).
managed by Asian/Indian crafters in Area B, and Asian owned sawmill and Asian timber wholesalers were located in Area N. It is likely that there were timber wholesalers and sawmills, or furniture plants owned by Indians in various parts of the city. This indicates that woodworking businesses were formerly dispersed throughout the city and that agglomeration was initiated by factors in the 1980s. In fact, one company in each area indicated in an open-ended response that they initially chose the area because there were fewer woodworking businesses there in earlier days and that they then preferred a dispersed location.
Companies in Area B’s early group, which located there at the earliest stage of agglomeration, state as their reasons both the area’s location along a highway and the existence of a market; however, the group of firms present in the area before 1986 (i.e., the group that located there prior to economic reconstruction) overwhelmingly chose only the area’s location along a major traffic zone (Table 12) (Ministry of Commerce, Industry and Tourism 1971).
In Area N, each group cited the availability of workshop space, and this was the case for the early group as well as the newcomers. On the other hand, the mid-stage and late groups also cited the publicity associated with locating in Area B, which was not a reason given by the early group. The middle stage group also mentioned the existence of customers in the vicinity, which was not mentioned by the early group either. In Area N, the middle stage group mentioned easy access to input goods and the existence of a market; however, there was no definite time-dependent trend in reasons given for location preference.
These results appear to indicate that firms in Area B seemingly valued the area’s proximity to CBD and the low cost of plots, along with the heavy traffic through the area. Moreover in recent years, the areas’ reputation as a furniture production centre has been established, and this has attracted SMEs looking for advantageous locations. In the case of the smaller agglomeration in Area N, it appears that the agglomeration has not grown enough to attract firms en masse to the area.
Groups arriving in the early stages of agglomeration were drawn by the areas’ proximity to the commercial centre and location along a major road. However, these conditions are met not only in these two places, but in a vast number of alternative locations. What, then, was the deciding factor that promoted agglomeration in these specific areas during the early stages?
Statistics on business establishments in 1969 indicate there were two furniture and wood workshops managed by Indians in Area B at that time. Also in Area B there was a wood workshop at Makerere University, which taught techniques for building and repairing, as well as a few timber wholesalers. The interviews proved that woodworking shops managed by Indian craftspeople played a significant role in technology transfer, as supported by the fact that all three of the oldest managers in the area obtained their skills from Indian craftspeople and then started independent businesses (in 1969, 1972, and 1974 respectively). Business promotion in the early stage of
Table 12 Locational Preference by the Locating Yearage B(n=70) numberos firms market (proximity to commercial centre) easy access to machine workshop easily available plot for sheds enough space for showroom along major traffic road input materials supplier proximity to home customer readily in the area name value of district other reason ∼1971 0 0 0 0 0 0 0 0 0 0 0 72∼85 4 3 0 1 0 3 0 0 0 0 0 86∼91 12 1 0 3 0 10 0 0 5 0 0 92∼95 11 3 1 1 1 7 1 0 2 0 1 96∼97 9 0 0 0 0 5 0 0 5 4 3 98∼99 13 4 1 1 0 5 0 0 5 3 0 00∼01 17 2 2 2 0 10 0 0 4 2 2 ∼2002 4 0 0 2 0 3 0 0 2 0 1 70 13 4 10 1 43 1 0 23 9 7 N (n=31) ∼1971 0 0 0 0 0 0 0 0 0 0 0 72∼85 2 0 0 2 0 1 0 0 0 0 0 86∼91 4 0 1 1 0 0 1 1 1 0 0 92∼95 7 4 0 2 0 3 3 1 1 0 1 (86-95) 11 4 1 3 0 3 4 2 2 0 1 96∼97 5 2 1 2 0 0 1 2 1 0 1 98∼99 5 1 1 1 0 2 1 1 1 0 0 (96-99) 10 3 2 3 0 2 2 3 2 0 1 00∼01 6 0 1 2 0 2 1 0 1 0 0 ∼2002 2 0 1 1 0 0 0 0 0 0 0 31 0 2 3 0 2 1 0 1 0 0 7 5 11 0 8 7 5 5 0 2 K (n=30) ∼1971 1 1 0 1 0 0 0 0 0 0 0 72∼85 0 0 0 0 0 0 0 0 0 0 0 86∼91 5 2 1 5 0 0 1 0 0 0 0 92∼95 4 3 0 2 0 0 2 1 0 1 1 96∼97 0 0 0 0 0 0 0 0 0 0 0 98∼99 4 3 0 3 0 0 0 0 0 0 1 00∼01 10 9 5 0 0 1 2 0 0 0 1 02∼03 6 4 0 3 0 1 2 0 0 0 1 30 22 6 14 0 2 7 1 0 1 4
Source Own survey
Table13: Outsourcing by Agglomerating Firms
N B K Firms with no outsourceing relations 1 8 6 Outsourced process in total 49 64 111 Average outsorced process per firm 1.58 1.92 3.7 source own survey
agglomeration in the Bwaise area seems to have been led by Indian craftspeople until the time of their deportation. Spin-offs from a small number of workshops owned by Indian craftspeople resulted in the sprouting of local agglomeration (Ministry of Commerce, Industry and Tourism 1971).
At the time of the spin-offs, however, managers who did not have plots would have had the option to remain or to shift to another area. Managers of some early-group companies – for example, 6 out of 13 companies that located in the Bwaise area prior to 1986 – actually owned land in the relevant area. In Area N as well, two members of the early group owned land in the area. In fact, according to the Kampala survey, there are several areas where around 10 workshops stand
side by side in addition to the above-mentioned two areas, but woodworking shops independently operating in an area other than agglomerated areas are extremely rare.
In terms of ownership of land and sheds by managers, all surveyed companies constructed sheds for their workshops at their own cost; however, only eight percent of the companies owned land, and members of the late group are overwhelmingly renting plots. There are only three landlords with signed rent contracts in the overall Bwaise area because many managers rent land from the same landlord. Woodcrafters who had woodworking skills and techniques or whose relatives owned land were thus given chances for business promotion and choice of location before the newcomers. This shows that infrastructure, i.e., existence of roads and access to land, was also essential in determining SME location preference (Figure 1) (Yoshida 2005).
Figure 1 Transformation of Woodworking SME Agglomeration in Uganda
DOMESTIC MARKET (mass consumer and working class market)
Small Anchor Firms Location (Timber dealers and sawn mills) ↓
Free Standing SME
(Asian craftmen and spin offs)
Regulation on small business eased to meet the demand in WWII period ↓
SME sector remained uninstitutionalised ↓
CIVIL WAR PERIOD/ Disinvestment/ Domestic economy shrunk ↓
Agglomerating SMEs
become Defacto Industrial Zone Utility insufficient/ await service provision SME surge in the economic boom but No SME support institution
↓
A few of SMEs graduate from agglomeration to industrial estate upgrade production environment
↓
Over agglomeration/congestion ↓
Agglomeration shrink and Drop-outs( Not spin-out) ↓
Networking deserved Clustering deserved
7. Institutional Endowment that Guided SME Cluster Formation
7.1. Land Administration Policies and Land Markets
When a small-scale manufacturer decides on a location for a workshop or factory in Uganda, it is necessary to obtain a trading license or a permit from the local authority, regardless of the enterprise’s scale. This means that land use acts and zoning regulations virtually institutionalize spatial patterns of industry location in the city, dictating what industry should be located where. Land zoning regulation is complex in Uganda, operating according to two basic concepts that operate in parallel: (1) the modern zoning concept, which is strictly applied to an area under the Kampala Planning Act, and (2) relatively loose traditional common law regarding land utilization. The former strict concept originated in the legacy of British-style zoning during colonial administration, which is based on the concept of dividing and categorizing areas depending on use and in which spaces for production and residence were supposed to be separated. Parallel with this concept, a very different land title system originating in the Buganda Kingdom, where land used to be leased or sold to private entities on the basis of permission, is still effective in the country (Mugambwa 2002a, 2002b).
Due to the coexistence of these systems, Kampala, a city with 1,200,000 inhabitants and about 380 square kilometers of built-up land, is divided by two different planning methods. The different land use regulations influence the location of woodworking businesses and agglomerations of SMEs. In reality, SME agglomeration has been formed according to the traditional land tenure system, or Mailo Land zones.
The urban land market in Uganda has been generally energized due to the economic reconstruction that has taken place since 1986. The property market, including the rental market, has been consistently expanding in transaction volume since the current government’s declaration in 1992 to return the foreign-owned assets from the pre-Amin period. Overall, however, information on land value and rent has been difficult to obtain in a market where bidding actions remain opportunistic and speculative transactions are prevalent.
Plots where major woodworking industries are located are usually transacted at a per-acre unit through an agent, with the involvement of the Uganda Investment Authority (UIA) and the former Uganda Development Corporation (a divested quasi-state investment authority). In these transactions, bidding price information is publicized and opportunistic trading or lease agreements are difficult. In contrast, rental markets for small plots of 20 to 30 square meters, where SMEs prefer to locate, are not open. Formal markets for smaller plots are difficult to establish, due in part to the Ugandan land act, created to conform to the British-era land policies.
Subdivision of a plot is only a matter of a rental agreement between the landlord and lessee. If there is no problem in terms of land utilization and there is no change in land ownership, then as long as these plots are subdivided and used under a verbal voluntary lease agreement, the use complies with the relevant land act, although the issue of building regulation still remains. Also, in the case of Mailo Land, compliance regarding the building code was not traditionally strictly enforced, so slum-type buildings have developed in this part of the city. Forcible eviction by the planning administration has not been vigorously pursued on Mailo Land, and so the planning administration is considered to have been very permissive in regard to subdivision and usage for the purpose of workshops on Mailo Land. This made it possible to legally obtain business permits for the formation of small workshops in an SME agglomerated area. Furthermore, zoning for land utilization was not strict in Mailo Land law; therefore, the lease market for small plots was tacitly accepted.
7.2. Land Market Information
Property markets in clustered areas, however, seem to create unfavourable conditions for workshop owners, as they preclude the common business practice such as the exchange of agreements or a basis for shed ownership. New entrants might anticipate risks at the time of the "contract," such as future rent hikes or requests for relocation. In Uganda, where the city land market is imperfect, information on small sized plots for workshop use is very limited, and it is difficult for managers of SMEs to collect rent plot information. As shown in Table 14, of the surveyed workshop owners, 16 obtained land through introduction by relatives or friends in Area N, and 5 companies utilize their own or relatives' land. In Area B, 23 workshops stated that they had previously known their landlords, and 32 workshops replied that they were introduced by relatives or friends. The absolute deficit of small plots in the city land market, as well as limited options in site selection in areas other than industrial agglomerated areas, are also factors in the selection of agglomerated areas.
In the land market in Uganda, business promotion and participation by SMEs is restricted due to zoning regulation. However, as groups of SMEs in the same industry began to spin off and the increased demand for workshops became obvious, intensive land utilization was enabled by subdividing and leasing sections in the same neighbourhood. Furthermore, as landlords recognized that local land authorities were receptive to land subdivision and utilization, workshop managers became preferred as tenants, and a citywide rent market began to form in which small plots sites circulated.
To gain such tenants, landlords in SME agglomerated areas pursued intensive land utilization that ignored the building code by subdividing and leasing land sections to groups of small
workshops. Agreements without written contracts or official registration are favourable to landlords, because eviction is easy when landlords want or need to shift land use. On the other hand, landlords have difficulty accessing information when seeking to verify the reliability of tenants, and there is a risk involved in exchanging verbal agreements with walk-in tenants. However, managers who have established their reputations as craftspeople in the community can build a reputation as reliable tenants. In the vicinity of agglomerated areas, where there exists a constant labour pool preparing to start businesses, craftspeople’s decision concerning whether or not to rent has become easier. Twenty-three firms in Area B replied that they had known their landlords before the contract, as they were mostly spin-offs from other firms in Area B and had met or contacted local landlords during their apprenticeships. Landlords' risks are thus reduced by selecting tenants based on their reputation as reputable craftspeople or managers, or on referral from well-known craftspeople or reliable relatives and acquaintances in the vicinity (Table 14).
Table 14: Rent Market Access by SMME
N B
Acquainted landlord 1 23
Through workmate 14 23
Through family 2 9
Family or relative's own property 5 3 Through local community leader 3
Property Agent 2 1
source own survey
8. Conclusion-What Policy is Needed for Upgrading Clustered SMEs?
The agglomerations of woodworking production in Kampala originated with the location of workshops of Asian craftsman along a major highway. These workshops played the role of small anchor firms. They gave others the information necessary to exploit the opportunities of those specific locations, resulting in SME clusters as shown in the flow chart in Figure2. Early entrants found these locations to be advantageous not only because of the proximity to the CBD, but also because publicity was available due to the heavy traffic through the areas. Early factors that encouraged agglomeration after this initial stage included the asymmetry of land market information for spun-off medium and small workshops. Access to cheap small plots for small-scale businesses was critical. Spatial expansion of the agglomerations resulted from the location preference expressed by medium and small companies as they attempted to reduce the risks of entry and take advantage of information asymmetry as well as of the large existing markets in the areas.
The locational behaviour of firms transformed the SME areas into de facto SME industrial zones without proper institutional recognition or infrastructure provision. These de facto zones localized necessary utilities and institutions such as micro finance lenders.
Cooperative relationships among firms in the agglomerated areas have been found to be active, but cooperation between these firms and the newly established major woodworking industries has not developed at all. In fact, with regard to vertical labour specialization with SMEs, some larger firms, including the one that graduated from the aforementioned SME Cluster B, responded that this was "impossible" because of differences in skill levels. The outsourcing ratio among the five larger companies surveyed was extremely small. Production is basically self-sufficient and vertically integrated, except where the timber processing is outsourced to mills. On the other hand, in the SME agglomerations, specialization of production processes among SMEs is active in Areas B and N, and cooperative frameworks other than labour specialization have also been established. In particular, tool sharing, labour pooling, and even money lending has developed among latecomers. SMEs also took advantage of the pool of idle skilled and unskilled labour craftspeople in agglomerated areas.
Among major woodworking industries, the issue of location preference in Kampala is strongly related to the issues of securing an experienced workforce and reasonably priced property. Large firm investors are unaware of the massive pool of skilled labour in the vicinity of local woodworking cluster. In this regard, there is a good possibility for the two sectors to develop a mutually cooperative framework through labour market integration. This interaction between two sectors, and movement of skilled labour between sectors, can develop if SMEs succeed in making technical upgrades (Figure 2).
However, the limited or non-existent cooperation between SMEs and large firms originates in the ways in which these two sectors emerged in the country. The government has not recognized the potential of this sub-sector and has always favoured large firms in its policy by offering investment incentives and tax holiday packages without any specific priority policy for the sub-sector or industrial space. SMEs have been ignored for long periods of time, and until recently lacked any incentives or proper financial schemes. Indivisible plots in industrial zones did not favour small-scale operation.
The market for these two sectors is also divided, as large firms aim mainly at upmarket clientele and SMEs aim for the middle and working class market. This dichotomy has created prejudices among the large firms, who distrust SMEs’ skills and competence, despite the proven fact that these smaller firms possess a variety of skill levels. SMEs often view large firms with disappointment and prejudice, because SMEs suspect that government officials always favour large firms due to collaboration and corruption.
Now, both sectors should recognize the doors of new opportunity opening for cooperation because regional market integration resumed in 2004 and the development of a long-awaited export processing zone is nearly complete. To maximize the emerging opportunity mentioned in the beginning of the paper in the global shift of production in the woodworking and furniture sector,
the state policy needs to institutionalise the existing SME clusters and incorporate the large firms into the network through, for example, co-bidding a government tender or exchange of technical expertise. As shown in Figure 3, we should draw, at the moment, two different flow charts to show the trajectory of SME cluster formation and the trajectory of the large firms’ sector formation in Uganda. It is vital to assist the integration of the two different flows and to assist the merger of the existing SME clusters with large firms in order to form a comprehensive woodworking industry cluster. However, without the provision of some kind of support to remove the bias and distrust toward SMEs’ technical capabilities in the minds of major woodworking companies who mostly consider vertical disintegration to be a sort of taboo, it will be difficult for the industry sector as a whole to develop as a comprehensive woodworking industry cluster. Uganda’s woodworking industry has the opportunity to rise as a leader from among the many other apparently stagnant Marshallian-type woodworking agglomerations in Sub-Saharan Africa by establishing a cooperative framework for industry clustering and meeting the technical needs of supplier-seeking global firms.
FIGURE 2: Dichotomous Development of Woodworking and Furniture Sector in Uganda
:::::::::::::::::::::::::::::::::::::::::::::::::::::::::::::::::::::::::::::::::::::::::::::::::::::::::::::::::::::::LARGE FIRM LOCATION::::::::::::::::::::::::::::::::::::::::::::::::::::::::::::::::::::::::::::::::::::::::::::::::::::::::::::::::::::: ::::::::::::::::::::::::::::::::::::::::::::::::::::::::::::::::::::::::::::::SMME LOCATION::::::::::::::::::::::::::::::::::::::::::::::::::::::::::::::: EXPORT MARKET (regional and other market) DOMESTIC MARKET (upper and upper-middle class market) year DOMESTIC MARKET (mass consumer and working class market)
Institutionalisation of Land Use/Zoning 1900-1910 Infrastructure/Utilities exclusively laid out through colonial administratio
↓ Small Anchor Firms Location (timber dealers and sawmills)
↓ Industrial Zoning and Plot Development Free standing SMMEs
non-existence physical divide
↓ Small business regulation eased to meet the demand in WWII
Regional market integration failed Major woodworking firms located in industrial zone. But plots unfilled ↓
(East African Community, 1972) ↓ 1968-1986 SME sector remained uninstitutionalised
Dual land system, Western and Traditional ↓
::CIVIL WAR PERIOD/ Disinvestment/ Domestic economy shrunk:::::: CIVIL WAR PERIOD/ Disinvestment/ Domestic economy shrunk :::::::::::::::::::::::CIVIL WAR PERIOD/ Disinvestment/ Domestic economy shrunk 1986- ↓
Industrial Area Development physical divide Agglomerating SMMEs
at Peri City Centre, Suburban estate, Local town estate, technical divide ( Defacto industrial zone)
↓ Utility insufficient/ Wait for service provision
Insitutionalisation of export/investment incentives SMME surge during the economic boom ↓ ↓ insufficient utilities, power cut, load shedding but no SME support institution
Export/Investment incentives (application based, any location) institutions unstable
EPZ not well understood compared with neighbouring Kenya and Tanzania human resources/limited local skill ↓ living conditions/ political risk/ limited amenity ↓
↓ ↓ Plots unfilled
Regional market integration resumed Industrial estate development (Old Namanve Estate) distrust bias A few SMEs graduate from agglomerations to industrial estates new East African Community, 2004 firm locates in old estates with incentives ←←←←←←←←←←←←←←←←←←←←upgrade production environment
↓ Plots unfilled ↓
Delayed export processing zone estate development, compared with neighbouring Kenya and Tanzania Local Market Shrinkage Over agglomeration/congestion
(New Namanve Estate) for both domestic and export market
2005- ↓
↓ Agglomeration shrink and Drop-outs( Not spin-out)
※Anchor firms not yet attracted (insufficient utility, political problem, market integration not enough) ↓
↓ ↓ ※Sectoral dichotomy remains Networking deserved
※Related firms lack access information on Uganda ※Local large firms not growing as anchor firms Clustering deserved
↓ ↓
※Clustering not anticipated ※Inter-firm network not developed source: prepared by author
Bibliography
Bank of Uganda, 2004, Private Sector Investment and Investor Perception in Uganda 2003 Report. Kampala: Bank of Uganda.
Kaplinsky, Raphael, Mike Morris and Jeff Readman, 2002, The Globalization of Product Markets and Immiserising Growth: Lessons from the South African Furniture Industry. Institute of Development Studies, University of Sussex: Brighton.
(http://www.ids.ac.uk/idS/global/pdfs/RKJRupgradingMarch%2004.pdf)
Kaplinsky, Raphael, Olga Memodovic, Mike Morris and Jeff Readman, 2003, The Global Wood Furniture Value Chain: What Prospects for Upgrading by Developing Countries, The Case of South Africa. Sectoral Studies Series, United Nations Industrial Development Organisation: Vienna.
(http://www.unido.org/file-storage/download/?file_id=11904)
Kaplinsky, Rafael and Jeff Readman, 2004, Globalization and Upgrading: What Can (And Cannot) Be Learnt From International Trade Statistics in the Wood Furniture Sector? Institute of Development Studies, University of Sussex: Brighton.
(http://www.ids.ac.uk/ids/global/pdfs/RKJRupgradingMarch%2004.pdf)
Kuchiki, Akifumi, 2005, Theory of a Flow Chart Approach to Industrial Cluster Policy, Institute of Developing Economies Discussion Paper Series: no36.
(http://www.ide.go.jp/Japanese/Publish/Dp/pdf/036_kuchiki.pdf)
Loebis, Lienda and Hubert Schmitz, 2005, Java Furniture Makers: Winners or Losers from Globalization? Institute of Development Studies, University of Sussex: Brighton.
(http://www.ids.ac.uk/ids/global/pdfs/RKJRupgradingMarch%2004.pdf)
Ministry of Commerce, Industry and Tourism, 1971, Manufacturing Industry of Uganda in Figures 1969 and 1970, Kampala, Uganda: Ministry of Commerce, Industry and Tourism.
Ministry of Economic Planning and Development, 1964, The Economic Development of the Kingdom of Buganda. Mengo, Uganda: Uganda Bookshop Printing Department.
Ministry of Finance and Economic Planning, 1993, Census of Business Establishments 1989 Manufacturing Sector Report. Entebbe, Uganda: Bureau of Statistics.
Ministry of Information, Broadcasting and Tourism, 1964, UGANDA 1964, Entebbe, Uganda: Uganda Government Printer.
Ministry of Planning and Economic Development, 1970, Index of Industrial Production. Entebbe, Uganda: Bureau of Statistics.
Monitor, 2002, The Monitor Business Directory, Kampala, Uganda: Monitor.
Mugambwa, John T., 2002, Source Book of Uganda’s Land Law, Kampala, Uganda: Fountain Publishers.
Mugambwa, John T.,2002, Principles of Land Law in Uganda. Kampala., Uganda: Fountain Publishers.
Uganda Bureau of Statistics, Statistical Abstract, Entebbe, Uganda.
Uganda Bureau of Statistics, 2003, A Report on the Uganda Business Register 2001/2002, Entebbe, Uganda: Bureau of Statistics.
Uganda Investment Authority, 2003, Private Sector Investment Survey 2003 Report in Uganda, Kampala, Uganda: UIA.
UMACIS, 1995, Uganda Private Enterprise Survey Report: World Bank Private Sector Development Department. Kampala, Uganda: Uganda Manufactures Association.
UNIDO, UNIDO Data Base: United Nations Industrial Development Organization. (http://www.unido.org/data)
United Nations Industrial Development Organisation, 2003, Africa Foreign Investor Survey 2003: Motivations, Operations, perceptions and Future Plans-Implications for Investment Promotion. Vienna: United Nations Industrial Development Organisation.
USAID Presto Project, 1999, The Business Real Estate Survey Uganda. Kampala: Presto.
Uganda Small Scale Industry Association (USSIA), 1999, USSIA Membership Staff and Investment.: Kampala: Uganda Small Scale Industry Association.
Yoshida, Eiichi. Industrial District as a Localised Incubation System in Developing Economies, Woodworking Industrial District in Uganda. Bonn: 11th General Conference, European Association of Development Research and Training Institute.