Proposal of quantitative identification method of a
small-type OSL dosimeter: Conditions that the dosimeter is not
identified in the medical image
Poster No.: C-0010
Congress: ECR 2016
Type: Scientific Exhibit
Authors: K. Takegami1
, H. Hayashi1, H. Okino1, N. Kimoto1, I. Maehata1, Y. Kanazawa1, T. Okazaki2, T. HASHIZUME3, I. Kobayashi2;
1
Tokushima/JP, 2Tsukuba, Ibaraki/JP, 3Tsukuba/JP
Keywords: Kv imaging, Image verification, Radiation safety, Dosimetry,
Experimental, Radioprotection / Radiation dose, Radiation physics
DOI: 10.1594/ecr2016/C-0010
Any information contained in this pdf file is automatically generated from digital material submitted to EPOS by third parties in the form of scientific presentations. References to any names, marks, products, or services of third parties or hypertext links to third-party sites or information are provided solely as a convenience to you and do not in any way constitute or imply ECR's endorsement, sponsorship or recommendation of the third party, information, product or service. ECR is not responsible for the content of these pages and does not make any representations regarding the content or accuracy of material in this file.
As per copyright regulations, any unauthorised use of the material or parts thereof as well as commercial reproduction or multiple distribution by any traditional or electronically based reproduction/publication method ist strictly prohibited.
You agree to defend, indemnify, and hold ECR harmless from and against any and all claims, damages, costs, and expenses, including attorneys' fees, arising from or related to your use of these pages.
Please note: Links to movies, ppt slideshows and any other multimedia files are not available in the pdf version of presentations.
Page 2 of 18
Aims and objectives
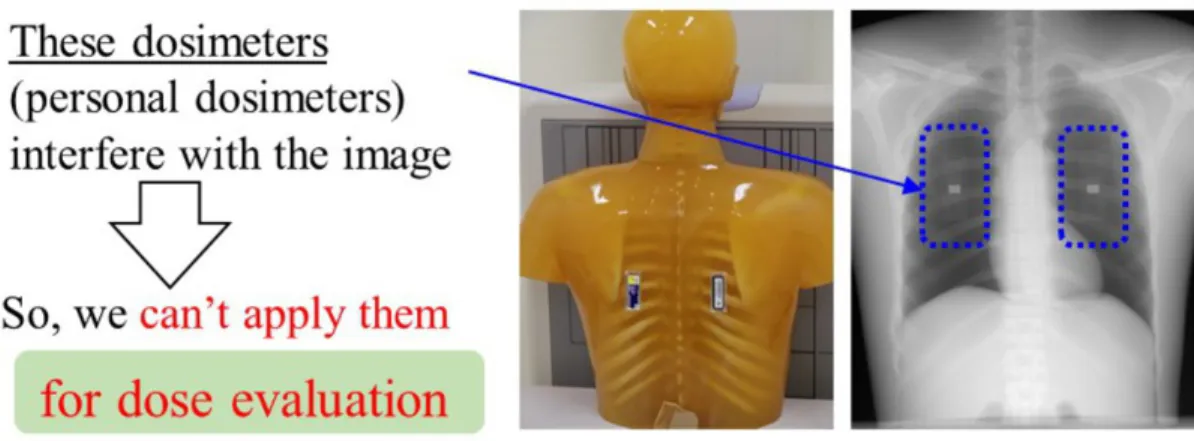
To examine human body for abnormalities, X-ray examination is widely used in the world. At a sufficient dose a high quality medical image can be derived, and will result in the early identification of illness or disease. As a result, exposure dose to patients has increased according to irradiation of intensity X-rays [1]. The exposure may be the cause of various cancers, therefore a proper balance between the image quality and exposure to the patient (patient exposure) should be considered [2]. Therefore, it is important to manage the exposure dose caused by X-ray examination. In the case of medical staff such as medical doctor and radiological technologist, the exposure dose is generally measured with personal dosimeters [3-5] worn on the human body. On the other hand, measurement of the patient exposure is difficult because these dosimeters interfere with the radiographic image as shown in Fig.1. Consequently, the patient exposure is estimated based on an air-kerma measurement and/or phantom study. We plan to measure a patient exposure using a newly developed dosimeter.
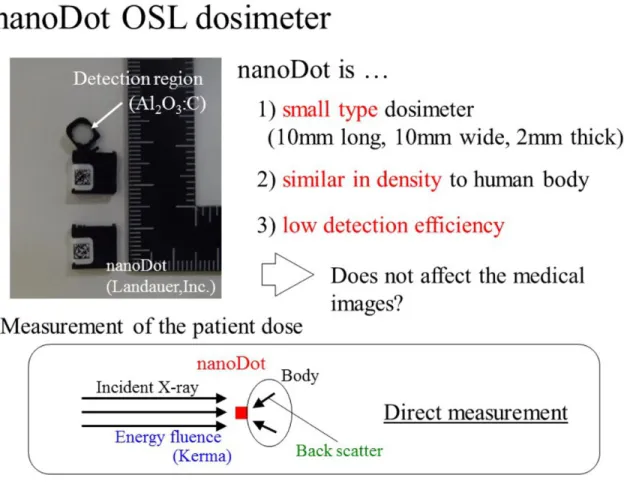
Recently, a small-type optically stimulated luminescence (OSL) dosimeter named "nanoDot" was newly developed by Landauer, Inc., as represented in Fig.2. The nanoDot OSL dosimeter has the following characteristics; the first being it is a small type dosimeter, 10 mm long, 10 mm wide and 2 mm thick, the second being it is similar in density to the human body, and the third, is to have a low detection efficiency. From these facts, we consider that the nanoDot OSL dosimeter can directly measure the patient exposure without affecting the medical image when patients wear the dosimeters on their bodies.
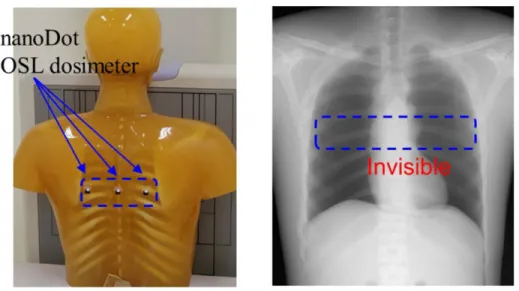
An overview of our study for clinical application of the nanoDot OSL dosimeter is represented in Fig.3; up to now, we have reported about three meaningful categories. First, we developed an annealing device [6] to initialize the nanoDot OSL dosimeter irradiated with X-rays. The annealing device is useful to use nanoDot OSL dosimeter repeatedly. We also estimated the error caused by the reading of the nanoDot OSL dosimeter [7]. Second, we measured basic characteristics of the nanoDot OSL dosimeter such as angular [8,9] and energy dependences in the diagnostic X-ray region. The errors caused by the energy and angular dependences were estimated in these reports. These results will help to analyze the patient dose measured with the nanoDot OSL dosimeter. Finally, for measurement of the patient dose, we derived a relationship between the counts (measured value) of the nanoDot OSL dosimeter and the entrance-skin dose estimated by an ionization chamber [10,11]. Here, it is required to verify that the nanoDot OSL dosimeter will not interfere with medical images. Figure 4 demonstrates the use of the nanoDot OSL dosimeter in a phantom study. The left image shows a photograph in which three nanoDot OSL dosimeters are attached to the back. Right image shows the X-ray image of a chest radiography, in which we can't observe the OSL dosimeters. This means that the dosimeter does not interfere with chest radiography. There are few reports to demonstrate no interference with medical images [7,11], but the quantitative
verification has never been studied. In this study, we proposed a new quantitative method to identify the dosimeter from the view point of substance identification based on X-ray spectrum measurement.
Images for this section:
Fig. 1: Management of the exposure dose. For medical staff, personal dosimeters are
generally used. For patients, the dose is estimated by air-kerma measurement because personal dosimeters interfere with the medical image.
Page 4 of 18 Fig. 2: Three characteristics of the small type nanoDot OSL dosimeter commercialized
by Landauer, Inc. For these characteristics, it is expected that this dosimeter can directly measure the dose without affecting the medical image.
Fig. 3: Overview of our study for clinical use of the nanoDot OSL dosimeter. Up to now,
we reported about various basic research of this dosimeter. Based on the present study, a clinical study will be performed.
Page 6 of 18 Fig. 4: Demonstration of the use of nanoDot OSL dosimeter in chest radiography. In
the X-ray image, we cannot visually find the dosimeter. On the other hand, quantitative evaluations have not been reported.
Methods and materials
In our experiment, we used a soft-tissue equivalent phantom (Kyoto Kagaku Co.,
Ltd., Kyoto, Japan) instead of the human body. X-rays generated by diagnostic X-ray
equipment (TOSHIBA Medical Systems Corporation, Nasu, Japan) were detected with a CdTe detector (EMF Japan Co., Ltd., Osaka, Japan). We measured the spectra under two experimental conditions as shown in Fig. 5; (a) indicated that X-rays penetrate both the phantom and nanoDot OSL dosimeter (Landauer Corporation, Illinois, USA) attached to the front of the phantom, (b) is phantom only. The analysis based on the spectra will be described in a later paragraph.
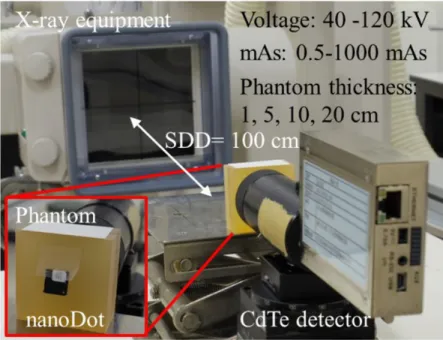
Figure 6 shows the experimental setup. In the case of the experiment in Fig. 5 (a),
the nanoDot OSL dosimeter was attached to the front and center of the phantom as shown in a close-up view of Fig. 6. X-rays penetrating the phantom and the nanoDot OSL dosimeter were detected by CdTe detector, which was located at the distance of 100 cm from the X-ray source. The detailed irradiation conditions are also presented in the figure; the tube voltages are 40, 60, 80, 120 kV and the tube current-time products are 0.5 to 1000 mAs. The currents were varied so to obtain a proper counting rate (less than 10 kilo-counts per second) for the CdTe detector in order to establish the sufficiently reduced effects of pile-up and dead time [13-15]. The spectra measured with CdTe detector were corrected by response functions derived by the Monte-Carlo simulation code (electron gamma shower ver. 5: EGS5) [16,17]. Using the phantoms with thickness of 1, 5, 10, 20 cm, each boundary condition that are described later was determined.
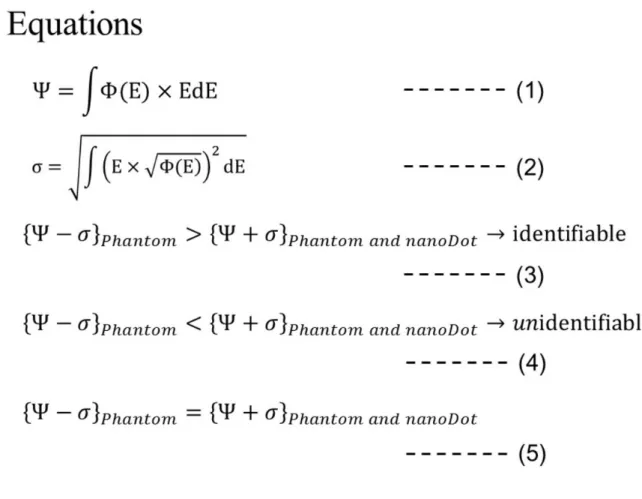
From the experimentally measured spectra, the energy fluence "Y" can be calculated using the equation (1) in Fig.7, where F(E) [cm-2] and E [keV] are a fluence and energy, respectively. Here, F(E) has fluctuation of square root of F(E) which is predicted by the Poisson distribution [12]. Using the error propagation formula [12], the error "s" of the energy fluence "Y" can be derived by considering both the above mentioned fluctuation and a weight factor of E. Then equation (2) in Fig.7 was formulated.
Now, we explain the determination of the identification conditions in which the nanoDot OSL dosimeter does not interfere with the medical image. The energy fluence of the experiment (a) in Fig. 5, YPhantom and nanoDot, takes a smaller value than that of the
experiment (b), YPhantom, because the nanoDot OSL dosimeter was used as an additional
absorber in the experiment (a). Therefore, we compared the relationship between {Y-s}Phantom and {Y+s}Phantom and nanoDot. Then, we evaluated whether the nanoDot OSL
dosimeter can be identified using the equations (3) and (4) in Fig. 7. As exposure dose increases, the absolute values of Y and s becomes larger, and the relative value of Y/ s becomes smaller. Basically, the nanoDot OSL dosimeter is detected with use of a
Page 8 of 18
high exposure dose, which depends on the tube current-time products. We can uniquely determine the boundary condition, mAs value, with equation (5) in Fig. 7. Using irradiation conditions lower than that derived by equation (5), the nanoDot OSL dosimeter cannot be identified in the medical image.
In the actual case in our analysis, we obtained the tube current-time product corresponding to the boundary condition of equation (5). The measured data of Y are affected by statistical fluctuation. In order to exclude the effect of the statistical fluctuation from the Y, the most provable value of Y was assumed. Namely, using all of experimental data for each examination setup, plots of Y versus mAs value were made, and a linear function was fitted. In this fitting, the least square method where weights of 1/s2 were applied [12]. Then, we used Y derived from the fitted function for equation (5) instead of the experimental value.
Fig. 5: Proposal of the quantitative identification method. X-ray spectra were measured
in the two experiments, and the energy fluence and the error were calculated, and identification conditions were determined based on our definition.
© - Tokushima/JP
Fig. 6: Experimental setting and conditions. The distance between X-ray source and
CdTe detector is 100 [cm]. The nanoDot OSL dosimeter was attached to the front of the soft-tissue equivalent phantom.
Page 10 of 18 Fig. 7: The equations for our analysis. The equations (1) and (2) show the energy fluence
and error, respectively. Equations (3), (4) and (5) show the definitions to judge whether the nanoDot OSL dosimeter is identified.
Results
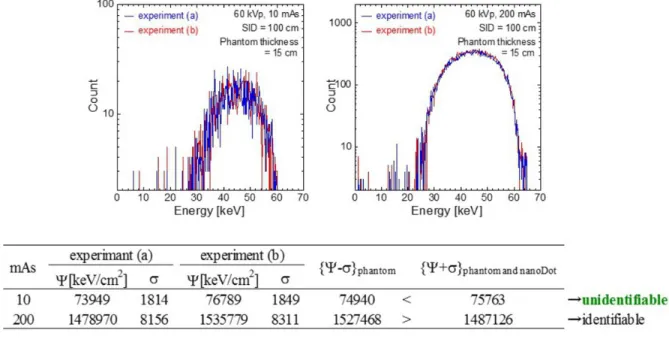
In Fig.8, upper figures show the example of obtained spectra which were measured under the following irradiation conditions: the tube voltage is 60 kV, the phantom thickness is 12 cm and the tube current-time products are 10 and 200 mAs. The horizontal axis shows the photon energy, and the vertical axis shows the number of photons. The spectra indicated by blue and red lines are obtained by experiments (a) and (b) in Fig.5, respectively. Here, our analyzing method was applied to these spectra, and results are listed in the table of Fig.8. The energy fluence and the errors are represented in the table. As a result of evaluations based on the equations in Fig.7, it was found that 10 mAs X-rays cannot identify the nanoDot OSL dosimeter. In the same manner, all of the measured spectra were analyzed using our method.
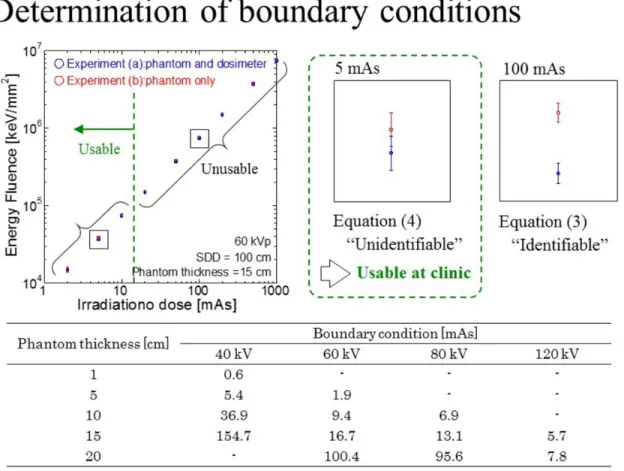
Figure 9 represents the typical results of our experiments. The relationship between
"mAs value" and "the energy fluence Y" calculated by the equation (1) are presented. In the case of this condition (60 kV, Phantom thickness = 15 cm), it was found that the irradiation dose with 2, 5, 10 mAs cannot identify the nanoDot OSL dosimeter. On the other hand, it is also clarified that irradiation doses larger than 20 mAs can identify the nanoDot OSL dosimeter. Close-up views of Fig. 9 shows two typical results; using 5 mAs X-rays the error bars overlap, and in contrast 100 mAs X-rays are not. Here, the boundary conditions were determined based on this analysis method and they are summarized in the table of Fig. 9. Using the mAs values which are lower than the boundary conditions, the nanoDot OSL dosimeter does not interfere with the medical image.
Figure 10 shows a two dimensional map of boundary conditions. Horizontal axis shows
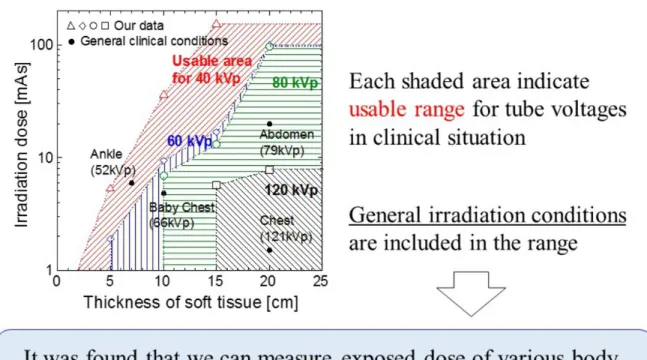
the phantom thickness and vertical axis shows the irradiation dose, mAs value. Red, blue, green and black data indicate the boundary conditions for tube voltages of 40, 60, 80 and 120 kV, respectively. The shaded portion represents usable conditions (nanoDot OSL in which the dosimeter does not interfere with the medical image), and that out of the shaded portion of upper side and lower side show unusable and usable areas, respectively; for example, we can use the nanoDot OSL dosimeter for the condition of {15 cm, 10 mAs} with tube voltages of 40 kV, 60 kV and 80 kV, but can't use at 120 kV.
Moreover, the irradiation conditions derived by our experiment and analysis were compared with general irradiation conditions [18] which are used as general exposure guidelines in Japan. The reference report represents the averaged values; tube voltage, tube current-time products, X-ray source to image distance and body thickness. In the present study, the following four conditions were compared with our results; chest, abdomen, ankle joint and chest of a baby. For comparison of the different data of distance, the actual mAs values were calculated based on the method in which intensity of X-ray is inversely proportional to the square of the distance. As a result, it was clearly found that
Page 12 of 18
the all of general irradiation conditions could be applied to measure the patient entrance skin dose without having an affect on the medical image.
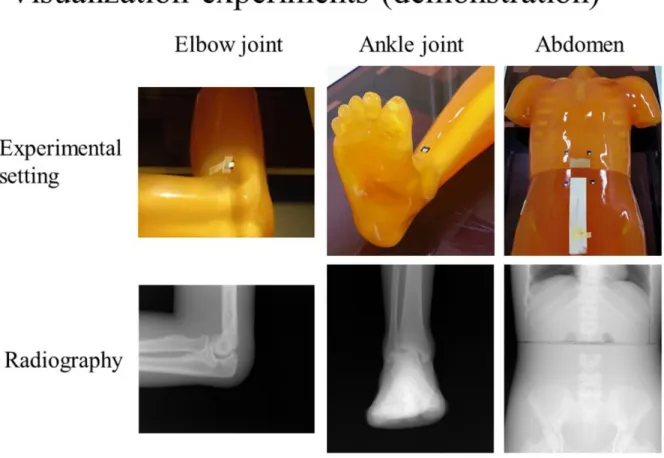
Finally, an experiment to demonstrate medical images with use of a nanoDot OSL dosimeter was also carried out as shown in Fig. 11. Upper images show a photograph of experimental settings. The nanoDot OSL dosimeters are attached on the phantom
(Kyoto Kagaku Co., Ltd., Kyoto, Japan). Lower pictures show radiographies obtained
by the computed radiography system (RP-4S, Konica Minolta Healthcare Ltd., Tokyo,
Japan). Here, general irradiations [18] were applied to these experiments. As a result,
the nanoDot OSL dosimeter cannot be identified in the visual images of the radiograph. In fact, our quantitative identification method is in good agreement with these visualization results. It is said that our method is valuable.
Images for this section:
Fig. 8: The obtained spectra for our analysis. Results of calculation using the spectra, 10
mAs X-rays cannot identify the nanoDot OSL dosimeter at this experimental condition.
Fig. 9: An example of experimental results and analysis, and the boundary irradiation
conditions. The mAs value lower than the conditions cannot identify the nanoDot OSL dosimeter on the medical image.
Page 14 of 18 Fig. 10: Adaptation range of use in the clinical situation based on our experimental
results. The general irradiation conditions are lower than the boundary irradiation conditions.
Fig. 11: Demonstration of the phantom studies using the nanoDot OSL dosimeter using
the CR system. Based on the clinically-adopted X-ray exposures, these experiments were performed. In the experimental settings of upper pictures, the nanoDot OSL dosimeter does not interfere with the radiographies of lower pictures.
Page 16 of 18
Conclusion
In the present study, we newly proposed a quantitative identification method to determine whether the nanoDot OSL dosimeter can be identified on the medical image. In this method, an X-ray spectrum was measured with a CdTe detector, and the analysis was performed from the perspective of substance identification. Then, we verified the identification limit of the nanoDot OSL dosimeter for the clinical application. As a result, we found that the nanoDot OSL dosimeter can't be identified under certain irradiation conditions. Moreover, the general irradiation conditions used in clinical situations in Japan were compared with the result, and then we summarized that we can use the nanoDot OSL dosimeter to measure entrance skin dose; namely, our results indicated that the nanoDot OSL dosimeter can be applied to estimate patient dose without interfering with medical images. Clinical research will be carried out accordingly to present quantitative evidence. The nanoDot OSL dosimeter is further expected to be a convenient detector for managing the patient exposure dose based on our previous and present research.
Personal information
References
[1] Uffmann M, Prokop CS. Digital radiography: The balance between image quality and required radiation dose. European Journal of radiology. 2009;72:202-208.
[2] Uffmann M, Prokop CS. Digital radiography: The balance between image quality and required radiation dose. European Journal of Radiology. 2009;72:202-208.
[3] Komiya I, Shirasaka T, Umezu Y, Tachibana M, Izumi. Patient Dose Measurement with Fluorescent Glass Dosimeter: Characteristics Evaluation and Patient Skin Dose Measurement in Abdominal Interventional Radiology. Japanese Journal of Radiological Technology. 2003;60(2):270-277 (in Japanese).
[4] Shortt CP, Malone L, Thornton J, Brennan P, Lee MJ. Radiation protection to the eye and thyroid suring diagnostic cerebral angiogralhy: A phantom study. Journal of Mesical Imaging and Radiation Oncology. 2008;52:365-369.
[5] Matsunaga Y, Kawaguchi A, Kobayashi K, Asada Y, Takikawa Y, Yamada M, Suzuki S. Dose Estimation for Exposure Conditions of Diagnostic Radiology Acquired by a 2011 Questionnaire in a Phantom Study. Japanese Journal of Radiological Technology. 2013;69(12):1372-1378 (in Japanese).
[6] Nakagawa K, Hayashi H, Okino H, Takegami K, Okazaki T, Kobayashi I. Fabrication of Annealing Equipment for Optically Stimulated Luminescence (OSL) Dosimeter. Japanese Journal of Radiological Technology. 2014;70(10):1135-1142 (in Japanese).
[7] Hayashi H, Nakagawa K, Okino H, Takegami K, Okazaki T, Kobayashi I. High accuracy measurements by consecutive readings of OSL dosimeter. Medical Imaging and Information Sciences. 2014;31(2):28-34 (in Japanese).
[8] Hayashi H, Takegami K, Okino H, Nakagawa K, Okazaki T, Kobayashi I. Procedure to measure angular dependences of personal dosimeters by means of diagnostic X-ray equipment. Medical Imaging and Information Sciences. 2015;32(1):8-14
[9] Okazaki T, Hayashi H, Takegami K, Okino H, Nakagawa K. Evaluation of angular dependence of nanoDot OSL dosimeters toward direct measurement of entrance skin dose. European Congress of Radiology (EPOS). 2015; DOI: 10.1594/ecr2015/C-0721
[10] Takegami K, Hayashi H, Okino H, Kimoto N, Maehata I, Kanazawa Y, Tohru O, Kobayashi I. Practical calibration curve of small-type optically stimulated luminescence (OSL) dosimeter for evaluation of entrance-skin dose in the diagnostic X-ray. Radiological Physics and Technology. 2015.
[11] Takegami K, Hayashi H, Nakagawa K, Okino H, Okazaki T, Kobayashi I. Measurement method of an exposed dose using the nanoDot dosimeter. European Congress of Radiology (EPOS). 2015; DOI:10.1594/ecr2015/C-0218
[12] Knoll GF. Radiation Detection and Measurement. New York: Jhon Willy and Sons, Inc. 2000.
[13] Debertin K, Schötzig U. Limitations of the pulser method for pile-up corrections in Ge(Li)-spectrometry. Nuclear Instruments and Methods. 1977;140(2):337-340.
[14] Then SS, Geurink FDP, Bode P, et al. A pulse generator simulating Ge-detector signals for dead-time and pile-up correction in gamma-ray spectrometry in INAA without distortion of the detector spectrum. Journal of Radioanalytical and Nuclear Chemistry. 1997;215(2):249-252.
[15] Cano-Ott D, Tain JL, Gadea A. Pulse pileup correction of large NaI(Tl) total absorption spectra using the true pulse shape. Nuclear Instruments and Methods in Physics Research A. 1999;430:488-497.
[16] Hirayama H, Namito Y, Bielajew AF, et al. The EGS5 code system, SLAC Report number: SLAC-R-730, KEK Report number: 2005-8.
[17] Okino H, Hayashi H, Nakagawa K, et al. Measurement of Response Function of CdTe Detector Using Diagnostic X-ray Equipment and Evaluation of Monte Carlo Simulation
Page 18 of 18
Code. Japanese Journal of Radiological Technology. 2014;70(12):1381-1391(in Japanese).
[18] Asada Y, Syoichi S, Kenichi K, et al. Summary of Results of the Patient Exposures in Diagnostic Radiography in 2011 Questionnaire-Focus on Radiographic Conditions-. Japanese Journal of Radiological Technology. 2012;68(9):1261-1268(in Japanese).