Article
Characteristics of Volcanic Activity at Sakurajima Volcanoʼs
Showa Crater During the Period 2006 to 2011
Masato I
GUCHI, Takeshi T
AMEGURI*, Yusaku O
HTA**, Sadato U
EKI**and Shigeru N
AKAO*** (Received September 27, 2011; Accepted January 8, 2013)Eruptive activity at the Showa crater of the Sakurajima volcano has steadily increased since it resumed in June 2006, and 2718 vulcanian eruptions occurred during the period from 2008 to 2011. In this paper, we clarify the characteristics of vulcanian eruptions at the Showa crater based mainly on ground deformation. Along-term extension of the ground of the Aira caldera and Sakurajima, repeating quasi-annual cycles of minor inflation-deflation, were obtained by GPS, tilt and strain observations. The inflation event that started in October 2009 was the largest. Major pressure source was estimated to be located at a depth of 12 km beneath the Aira caldera for the inflation and a minor source was obtained a depth of 5 km at the northern flank of Kitadake in addition to a source beneath Minamidake which has been know by previous studies. The magma plumbing system is composed of a major magma reservoir at a depth of ≈10 km beneath the Aira caldera and additional magma reservoirs at depths of around 5 km beneath the summit area from the north flank of Kitadake to Minamidake. Strain changes which indicate inflation were detected prior to explosions and the inflation strain lasted mostly 1 h. The strain changes were caused by a shallow pressure source less than 1.5 km. The inflation occasionally continued for more than 7 h with an addition of inflation of a deep source (4 km), which corresponds to the magma reservoir beneath Minamidake. The conduit to the Showa crater may be branched from the magma reservoir beneath Minamidake or from the major conduit connected to it. When inflationary ground deformation progressed at a high rate, the eruptive activity reached a peak from December 2009 to March 2010. This suggests that the accumulation of magma beneath the central cones of the Sakurajima volcano progressed simultaneously to a discharge of magma. The simultaneous progress of the accumulation and discharge of magma and the frequent occurrence of small vulcanian eruptions may be related to the small open conduit.
Key words: Sakurajima volcano, Showa crater, Minamidake crater, ground deformation, magma supply, vulcanian
eruption
1.Introduction
Sakurajima is a post-caldera volcano formed at the southern rim of the Aira caldera. The central cones are Kitadake, Nakadake and Minamidake. Kitadake is the oldest cone. All the eruptions since the 8thcentury have
occurred at the summit area of Minamidake and its flanks, including the sea area.
Eruptive activity has taken place continuously at the Minamidake crater since 1955. The eruptive activity is characterized by frequent activities of a vulcanian type, and the crater was quite active during the period from 1972 to 1992, with 4919 vulcanian eruptions and 2.4×10⁸tons
of volcanic ash being emitted. Of particular note, 498 vulcanian eruptions occurred in 1974, 415 in 1983 and 452 in 1985. The mechanisms of the vulcanian eruptions have been studied mainly by seismological and geodetic
obser-vations. Tameguri et al. (2002) analyzed the explosion earthquakes associated with the vulcanian eruptions and proposed a four-source model with moment tensors to explain the waveforms of the explosion earthquakes. However, this seismological method cannot cover the entire process of vulcanian eruptions due to the insufficient frequency range of even the most broadband seismometer. Ishihara (1990) detected inflation of the ground prior to the vulcanian eruptions and the deflation associated with them by using water-tube tiltmeters and extensometers sited in an underground tunnel, and interpreted the inflation and deflation as being caused by magma intrusion at a depth of 2-6 km and by ejection of the magma product, respec-tively. Iguchi et al. (2008c) proposed a model for the process of vulcanian eruptions in which an explosive eruption is triggered by minor deflation, which is induced
GraduateSchool of Science and Engineering, Kagoshima Univ., 1-21-24, Korimoto, Kagoshima 890-8580, Japan. Corresponding author: Masato Iguchi
e-mail: [email protected] ***
Sakurajima Volcano Research Center, DPRI, Kyoto Univ., 1722-19, Sakurajima-Yokoyama, Kagoshima 891-1419, Japan.
GraduateSchool of Science, TohokuUniv., 6-3 Aramaki-aza Aoba, Aoba-ku, Sendai 980-8578, Japan.
*
by a decrease in pressure in a conduit as the result of a sudden outgassing of water-saturated magma deep in the conduit and the ensuing cap failure at the top of the conduit.
After 1993, explosive activity at the Minamidake crater gradually decreased and the annual number of vulcanian eruptions fell below 10 from 2003 onward. In contrast to the declining eruptive activity at the Minamidake crater, eruptive activity resumed at the Showa crater on June 4, 2006. The Showa crater is located at an elevation of around ≈ 800 m on the eastern flank of Minamidake. Previous eruptive activity at the crater was initiated by explosive eruptions with pyroclastic flows in October and November 1939 (Tsuya and Minakami, 1940). After an increase in eruptive activity in January and February 1946, lava effused from the crater in March and the lava flow reached the east and south coasts in one month (Hagiwara
et al., 1946). The total amount of effused lava was
esti-mated to be 0.18 km3(Ishihara et al., 1981). The Showa
crater was dormant during the violent eruptive period of the Minamidake crater that started in 1955, and the eruptive activity in 2006 at the Showa crater marked a resumption after 58 years of dormancy following minor eruptions in 1948.
The eruptive activity at the Showa crater was of a phreatic type in 2006 and 2007 (Miyagi et al., 2011), then vulcanian eruptions began to occur on February 3, 2008. The number of vulcanian eruptions increased rapidly in October 2009, and the annual numbers in 2010 and 2011 were almost twice those at the peaks of vulcanian erup-tions at the Minamidake crater. However, the scale of the vulcanian eruptions at the Showa crater was one to two orders of magnitude smaller than the eruptions at the Minamidake crater - from the viewpoints of explosion earthquakes, infrasonic waves, ground deformation and amounts of volcanic ash ejected (Iguchi et al., 2010). The eruptive activity at the Showa crater up to 2011 was characterized by more frequent occurrences of smaller vulcanian eruptions than the eruptivity at the Minamidake crater.
Following a decline in eruptivity at the Minamidake crater that started in 1993, the magma reservoir 10 km beneath the Aira caldera has become inflated, as revealed by precise leveling (Eto et al., 1997; 1998a; Yamamoto et
al., 2008), EDM (Eto et al., 1998b) and GPS observations
(Kriswati and Iguchi, 2003; Iguchi et al., 2008b) con-ducted since 1995, and the amount of magma accumulated in the reservoir was estimated to be 8×10⁷m3during the
period from 1996 to 2007 (Iguchi et al., 2008b). During the process of inflation, eruptive activity at the Showa crater resumed in 2006 and has continued to increase since then (Iguchi et al., 2010). Considering inflationary pro-cesses at the Aira caldera prior to the 1946 eruption at the Showa crater (Sassa, 1956), and prior to the frequent occurrence of vulcanian eruptions at the Minamidake
crater starting in 1972, it can be forecast that the current eruptivity at the Showa crater will continue to increase.
Typically, abrupt starts of eruptions of the magmatic type are immediately preceded by an increase in the seismicity of volcano-tectonic earthquakes, see: 1977-1982 Usu (Suzuki et al., 1980), 1983 Miyakejima (Uhira et al., 1984), 1986 flank eruption at Izu-Oshima (Yamaoka et al., 1988), 1991-1995 Fugendake at Unzen (Umakoshi et al., 2001), and 2000 Miyakejima eruptions (Sakai et al., 2001). During the eruptive period at Minamidake, an increase in A-type earthquakes (volcano-tectonic) and a migration of their hypocenters prior to the occurrence of frequent vulcanian eruptions was reported (Kamo, 1978). In addi-tion, swarms of B-type earthquakes occurred a few days prior to an increase in vulcanian eruptions (Nishi, 1984). In contrast to these eruptive activities, a gradual increase in eruptive activity at the Showa crater had not hitherto been accompanied by remarkable increases in seismicity, but by ground deformation.
By analyzing ground deformation data, the long-term processes giving rise to the gradual increase in eruptive activity are clarified, and the characteristics of individual vulcanian eruptions at the Showa crater are examined. Finally, the mechanisms of such a slow increase in erup-tive activity are discussed from the points of view of the short-term and long-term processes of ground deformation. In this study, we refer to a “vulcanian eruption” at the Sakurajima volcano simply as an “explosion.”
2.Observations
The Sakurajima Volcanological Observatory (SVO, Volcano Research Center; now the SVRC) operated by the Disaster Prevention Research Institute (DPRI) of Kyoto University has observed Sakurajima since 1960. The loca-tions of measuring instruments are shown in Fig. 1. Short-period (1 Hz) 3-component seismometers have been instal-led at 10 seismic stations (8 in boreholes, 2 on the ground surface) around the summit cones, 5 of which are equipped with broadband seismometers (STS-2: Streckeisen, JCP-1: Akashi, Trillium 120 PA: Nanometrics; frequency range 0. 0083-50 Hz). Of the 8 borehole stations, 6 are equipped with borehole tiltmeters (Akashi, JTS-23). The seismo-meters for the horizontal components and the tiltseismo-meters in the boreholes are oriented to the direction of the center of the Minamidake crater (radial component) and to the direction rotated clockwise by 90° from it (tangential com-ponent). Aset of 2-component (radial and tangential) water-tube tiltmeters and 3-component (radial, tangential and oblique) extensometers is installed over a length of 28 m in two underground tunnels respectively. One is located at Harutayama (HVOT) 3.4 km from the Showa crater, and the other at Arimura (AVOT) 2. 1 km from the crater, operated by the Osumi Office of River and National Highway, Ministry of Land, Infrastructure, Transport and Tourism (MLIT). Infrasonic microphones (type 7144:
ACO) are installed at four sites. The microphone at AVOT is used to detect explosions at the Showa crater. The seismic and infrasonic signals are sampled at a rate of 200 Hz at a 24-bit resolution using an analog-digital con-verter (LF-2000 or LS7000-XT: Hakusan) at all relevant sites. The signals from the borehole and water-tube tiltmeters and extensometers are sampled at 1 Hz using an analog-digital converter of the same type. The digitized data are transferred to the SVO data center via an ISDN or ADSL network and by radio-frequency wireless connec-tions. Continuous and online GPS instruments are instal-led at 8 stations at and around Sakurajima. GPS data are sampled at 1 Hz by a dual-frequency receiver (GRX1200 or GMX902: Leica Geosystems). The GPS data are trans-ferred by TCP/IP connection to SVO and analyzed auto-matically using Spider software (Leica Geosystems). Campaign observations by GPS have been repeated at Sakurajima and around the Aira caldera at least once a year.
3.Precursors to the resumption of eruptive activity in 2006
Although no drastic change, such as a sudden prelimi-nary increase in seismicity, was detected prior to the resumption of eruptive activity of the Showa crater on June 4, 2006, three precursory phenomena were noted: a slight increase in A-type earthquakes, an inflation of the
Sakura-jima and Aira caldera areas, and an increase in geothermal activity around the crater.
The monthly numbers of A-type, B-type and explosion earthquakes during the period from 1991 to 2011 are shown in Fig. 2. Explosion earthquakes after 2008 were associated mainly with explosions at the Showa crater -except for 6 Minamidake events. The seismicity of the A-type earthquakes was low during the active period of eruptivity at the Minamidake crater, i.e., before 2000. The seismicity increased during the period from November 2003 to January 2004 and during December 2004. Fig. 3 shows the hypocenter distribution of A-type earthquakes, assuming a half space with 5 layers for the velocity of P-waves based on Hidayati et al. (2007). The hypocenters of the A-type earthquakes were concentrated in the summit area. In addition, A-type earthquakes occurred at depths of 6-9 km in the southwestern part of Sakurajima and at depths of 4-10 km below the northeastern rim of the Aira caldera. The seismicity in November 2003 was located southwest of Sakurajima. It was reported that A-type earthquakes sometimes occurred in the same area in 1976-78, accompanying the migration of the hypocenters from a deep depth to a shallow one beneath the southwest of Minamidake prior to an increase in explosive activity, typically in May 1976 (Kamo, 1978). As lower seismicity was recorded in the 1980s and 1990s, the seismicity in the southwest of Minamidake became active in November
Fig. 1. Location of observation sites at Sakurajima. Dots indicate seismic stations. Stations HAR, KOM, ARI, KUR, SHN and OKO are equipped with borehole tiltmeters. Open circles are GPS observation sites. The campaign sites are shown by smaller circles. Gray triangles are underground tunnels, HVOT and AVOT, where water-tube tiltmeters and extensometers are installed. Infrasonic microphones are installed at sites shown by diamonds. Inverted triangles are tide gauges. At Station KUR, the concentrations of CO2and H2at a hot spring are measured. The letters “M,” “K” and “S” indicate craters Minamidake, Kitadake and Showa, respectively.
2003 for the first time in more than 20 years. From January 2004, the seismicity at the summit area increased after the occurrence of earthquakes southwest of the volcano and northeast of the caldera. The seismicity of B-type earthquakes increased from February 2006 relative to the seismicity in 2001 to 2005. However, the increase in the seismicity of B-type earthquakes was much lower than that in the eruptive period of Minamidake in the 1990s.
Asecond precursor is inflation ground deformation. Fig. 4 shows the temporal change in the horizontal distance of baselines in the north-south (FUT-ARI) and east-west (SVO-KUR) directions. The number of explosion earth-quakes reached a peak in December 1999, with 104 explosions at the Minamidake crater (Fig. 2). Prior to the increase in explosive activity, extensions of the horizontal baseline lengths of 6 cm and 4 cm were detected in the north-south and east-west directions, respectively, during the period from November 1997 to October 1999. Although a slight extension in the east-west direction and a contraction in the north-south direction were noted after 2000, the deformation rates were low. The baselines ex-tended again, starting in October 2004, as shown by the arrows in Fig. 4. The extensional deformation corres-ponded to an increase in seismicity of A-type earthquakes at the summit area in December 2004 (Figs. 2 and 3). The extensions of the baselines had reached 8 cm and 9 cm in the north-south and east-west directions, respectively,
from 1995 to 2006. Eto et al. (1998a; 1998b) showed that ground of Sakurajima and the Aira caldera turned inflation in 1993. Extension of baselines detected by GPS (Fig. 4) is a part of the inflation and the inflation had continued with variety of deformation rate and the eruptive activity commenced at the Showa crater in 2006.
An increase in geothermal activity is a third precursor. An increase in fumarolic activity around the Showa crater was observed visually in January 2006, and the increase was confirmed by geothermal measurement using an infrared scanner in March 2006 (Yokoo et al., 2007). The geothermal temperatures around the Showa crater meas-ured by infrared scanners decreased during the eruptive period at Minamidake (Kamo et al., 1995); however, the temperature in March 2006 was higher by 15-20℃ than the last observation, made in 1992.
4.Eruptive activity at the Showa crater from 2006 to 2011
Eruptive activity at the Showa crater commenced with an emission of volcanic ash around 10 : 00 to 11 : 00 on June 4, 2006. The first eruptive activity in June 2006 continued only for two weeks, accompanying a weak emission of volcanic ash; while a second bout of activity in May 2007 continued for three weeks (Iguchi et al., 2008a). The eruptive activities were of the phreatic type (Miyagi et
al., 2010). The eruptions did not accompany explosion Fig. 2. Monthly number of A-type, B-type and explosion earthquakes during the period from 1991 to 2011. All the
explosion earthquakes prior to January 2008 were accompanied by explosions at the Minamidake crater. Most of the explosion earthquakes after February 2008 were related to events at the Showa crater and there were only 6 events at the Minamidake crater.
earthquakes, and the strength of the infrasonic waves accompanying the eruptions was <3 Pa at Station AVOT. The style of eruption changed to a vulcanian type on February 3, 2008, when eruptive activity restarted after eight months of dormancy. An eruption at 10 : 17 on February 3 was accompanied by an explosion earthquake and a clear infrasonic wave (16 Pa at Station AVOT). We
counted the number of explosions based on the intensity of infrasonic waves of ≥10 Pa at Station AVOT. An explo-sion occurred at 15 : 54 on the same day, accompanied by a pyroclastic flow having a flow distance of 1. 1 km. A pyroclastic flow was similarly produced by an explosion at 11 : 25 on February 6.
The temporal change in eruptive activity from 2008 to 2011 is shown in Fig. 5 by the amplitude of infrasonic waves, the monthly number of explosions, and the monthly weight of volcanic ash ejected from the Showa crater. The monthly weight of volcanic ash is estimated from the sum of the patterns of decrease in volcanic ash weight ac-cording to distance from the crater, approximated by an exponentially decaying curve, along 8 directions (Ishikawa
et al., 1981). The decrease patterns are determined by
measurements at 58 points, which have been operated by the Kagoshima Prefectural government since 1978.
In 2008, 18 explosions occurred from February 3 to July 28. No volcanic eruptions occurred after August, however, gas emissions from the surrounding areas of the crater were quite intensive, sometimes reaching a height of 1 km above the crater.
On February 1, 2009, explosive activity resumed. During the period from February to April 2009, eruptive and dormant periods were alternatively repeated at a time interval of around two weeks. Activity, consisting of explo-sions, gradually increased from July 2009 onward. On October 3, an explosion occurred at the Minamidake crater. The volcanic ash cloud reached 3000 m above the summit
Fig. 3. Hypocenter distributions of A-type earthquakes during the period 1997 to 2011. The epicenter distribution is shown at the upper left graph. Hypocenters on vertical cross-sections in the directions north-south and east-west are shown in the upper middle and lower left graphs, respectively. The upper right graph shows temporal changes in north-south locations during the period 2001 to 2011. The Minamidake crater and the Wakamiko submarine volcano are indicated by “M” and “W,” respectively.
Fig. 4. Temporal change in horizontal distance of base-lines in the north-south and east-west directions meas-ured by GPS during the period from 1995 to 2011. Arrows indicate the beginning of extensions. See Fig. 1 for location of stations. Note that fluctuation of data plot became small after replacement of GPS receivers and antennas in June 2005.
and the amplitude of the infrasonic waves was >200 Pa at Station AVOT and 837 Pa at Station HAR. The scale of the explosion was classified as “large” relative to most explosions at the Minamidake crater. After the explosion, eruptive activity at the Showa crater increased, reaching a peak during the period from December 2009 to March 2010, when more than 130 explosions occurred per month. The monthly weight of volcanic ash exceeded 1×10⁶tons
during the period from January to March 2010. After May 2010, explosive activity declined -except for July 2010-and the activity fell to a low level in October 2010, when only 15 explosions occurred and the monthly weight of volcanic ash decreased to 0.07×10⁶tons.
From the end of November 2010 explosive activity increased again, exceeding 90 explosions per month during the period from January to April 2011. Associated with the increase in the number of explosions, the weight of volcanic ash ejected from the crater increased to 0.4〜0.7 ×10⁶ton/month. Eruptive activity from November 2010
was smaller than that from October 2009 in terms of the numbers of explosions and the volume of volcanic ash ejected, and eruptive activity declined again in June and July 2011.
Both the monthly number of explosions and the volume of volcanic ash began to increase from August 2011, and this tendency continued until the end of December 2011. The intensity of infrasonic waves generated by the explosions correlated well with the number of explosions.
The number of explosions gradually increased from July 2009, reaching a peak during the period from December 2009 to March 2010, and decreased toward October 2010. The amplitude of the infrasonic waves exceeded 200 Pa for 8 explosions and 150 Pa for 39 explosions during the active period. Acorrespondence between the large ampli-tudes of infrasonic waves and the frequent occurrence of explosions appeared during the period from January to May 2011 and in the last quarter of 2011. In contrast, the amplitudes of infrasonic waves were less than 40 Pa in October 2010 and June 2011, when the monthly number of explosions was only 15 and 27, respectively.
5.Long-term ground deformation in 2006-2011
The transience in eruptive activity at the Showa crater correlates to ground deformation. In order to clarify the ground deformation related to the eruptive activity during the period from 2006 to 2011, we examined the baselines measured by GPS as well as the changes in tilt and strain. Characteristic ground deformation was observed associ-ated with an increase and decrease in eruptive activity.
5-1 Temporal changes in ground deformation
Fig. 6 shows the temporal change in the horizontal lengths of the baselines measured by GPS during the period from 2006 to 2011. No significant co-eruptive ground de-formation was detected with the resumption of eruptive activity of Showa crater in June 2006, while a minimal change continued until September 2009.
Significant ground deformation began in October 2009 when the number of explosions and the ejected weight of volcanic ash increased. The horizontal distances of the baselines in the north-south direction showed an extension during the period from October 2009 to April 2010. When more than 130 explosions occurred during the period from December 2009 to March 2010, the extension of baseline
Fig. 5. Temporal change in eruptive activity during the period from 2008 to 2011. Top: Amplitudes of in-frasonic waves generated by explosions. The infrason-ic waves are observed at the station AVOT. Middle: Monthly number of explosions. Bottom: Monthly weight of volcanic ash ejected from the Showa crater.
Fig. 6. Temporal change in horizontal distance of base-lines in the north-south and east-west directions meas-ured by GPS during the period 2006 to 2011. Monthly numbers of explosions and monthly weights of vol-canic ash ejected from the craters of Sakurajima are included in the upper and lower graphs, respectively.
in the east-west direction became clear. The east-west baseline showed an extension of 1 cm and the baseline in the north-south direction was extended by 2 cm during the period from October 2009 to April 2010. The east-west baseline showed a disturbance of up to 1 cm after April 2010, while the north-south baseline repeated a cycle of contractions and extensions. This turned into a contraction in May 2010 and showed a clear extension in November 2010. The extension turned into a contraction again in April 2011, followed by a restart of an extension in August 2011. The change in baseline ranged from 1 to 2 cm for both the extension and contraction episodes. When exten-sion of the north-south baseline was observed during the periods from November 2010 to April 2011 and from August to October 2011, the monthly number of explo-sions and the ejection of volcanic ash showed a tendency to increase or stayed at a high level (Fig. 6). In contrast, contractions in the north-south baseline corresponded to a
decrease in or low-level activity during the periods from April to July 2010 and from April to July 2011.
An extension-contraction pattern similar to the change in the baseline in the north-south direction was noted in strain records at Station HVOT, as shown in Fig. 7. It can be seen that the extensions and contractions repeated alternatively. The extension-contraction events are summa-rized in Table 1. The cycle of repeated extensions and contractions lasted about 12 months. The extension-contraction event during the period from September 2009 to October 2010 was the largest among the 5 events. The change in inflationary strain was 1.2×10⁻⁶in the radial
component and 0.7×10⁻⁶in the tangential component.
The second-largest event, from November 2010 to August 2011, had large contraction strains of −0.9×10⁻⁶in the
radial and tangential components. These two events corresponded to the extension-contraction episodes in the north-south baselines measured by GPS. Rapid extension strains were observed during the period from December 2009 to March 2010 when more than 130 explosions occurred, while a rapid contraction strain from August to October 2010 corresponded to a decrease in eruptive activity.
In the rest of this section, we describe in more detail the largest extension-contraction event, which took place during the period September 2009 to October 2010. Fig. 8 shows the tilt changes at Stations AVOT, HVOT, HAR and KOM and the strain changes at Station HVOT. The trend com-ponents are reduced by using long-term records (Iguchi et
al., 2011). An upward tilt of the crater side began on
September 12, 2009 (Inf1 in Fig. 8) and the rate of the upward tilt became rapid at 08 : 00 on September 30, 2009 (Inf2 in Fig. 8). The rapid tilt change continued until the occurrence of an explosion at the Minamidake crater at 16: 45 on October 3, 2009. The scale of the explosion was evaluated as being rather large for explosions at the Minamidake crater, because the volcanic ash cloud reached 3000 m above the crater and the amplitude of the air shock was 837 Pa at Station HAR. However, only one explosion at Minamidake occurred during the extension-contraction
Table 1. Extension-contraction events during Showa crater activity.
Fig. 7. Temporal change in strain in the Harutayama underground tunnel (HVOT). EX-R and EX-T indicate strain changes in the radial direction from the crater and tangential to it, respectively. The strains are compared with temporal change of monthly numbers (middle) and monthly weight of volcanic ash (bottom).
event, and the occurrence of the Minamidake event seemed to have triggered the subsequent continuous upward tilt.
Achronology of tilt changes is presented below based on tilt changes at Station AVOT. After the explosion, a change in upward tilt continued at a rate of 6 × 10⁻⁹
rad/day and the tilt rate increased to 9 × 10⁻⁹ rad/day
during the period from December 2009 to March 2010. After a period of stable tilt from April to June 8, 2010 and a short-term rapid change in tilt upward from June 9 to 13, 2010, the tilt turned downward at the crater side on June 15, 2010. The downward tilt was quite rapid from 21 : 00 to 8 : 00 on the next day and it attained −210×10−9rad
(Def1 in Fig. 8). From the middle of July 2010, the tilt showed a long-term trend downward on the crater side (Def2 in Fig. 8). The downward tilt rate was rapid (−51 ×10−9rad/day) during the period from 17 to 29 July and
decreased stepwise (−13×10−9 rad/day in the period
July 29 to September 17 and −5.4×10⁻⁹rad/day in the
period September 29 to November 15).
Similar patterns were observed in the strain records at Station HVOT and for tilt changes at Stations HVOT, HAR and KOM (Fig. 8). The extension strain at Station HVOT and the upward tilt of the crater side at Stations HVOT, HAR and KOM started in September 2009, and the contraction strain and the downward tilt finished in October or November 2010, although the termination of deflation was not clear due to the gradual decrease in the deformation rates. Ahigher rate of deformation was noted in almost the same period as the tilt record at Station AVOT. The strain rate was large (6.7×10⁻⁹/day) from
December 2009 to March 2010 in the radial component at Station HVOT. Short-term changes can be noted in all the records, such as the inflation event from 08: 00 September 30, 2009 to 16 : 00 on October 3 followed by an explosion at Minamidake and a rapid deflation event from 21 : 00 on June 15, 2010 to 08 : 00 on June 16. The transition from the inflation to the deflation stage was a little different. The downward tilt of the crater side became significant in the middle of July 2010 at Station AVOT (Def2 in Fig. 8); however, the contraction strain and the downward tilt clearly started in the middle of June 2010 at Stations HVOT, HAR and KOM (Def1 in Fig. 8), one month earlier than at Station AVOT.
5-2 Location and volume change of pressure sources
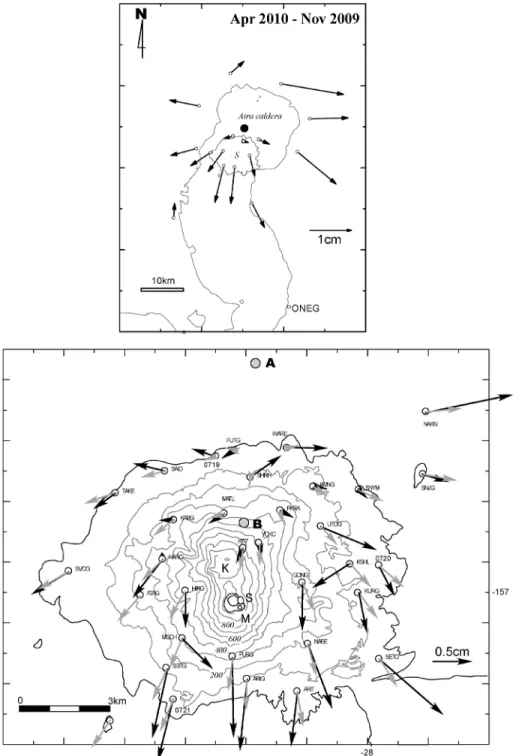
To estimate the location of the pressure sources inducing the largest ground deformation during the period from September/October 2009 to October 2010, horizontal dis-placements as measured by GPS were analyzed. The spatial distribution of the horizontal displacements in the inflation stage is shown in Fig. 9. The displacements are based on continuous GPS observations and differences in the two campaigns at the end of November 2009 (Iguchi et al., 2010) and early April 2010. The horizontal displacements obtained are from Station ONEG (39 km southeast from Minamidake) on the Osumi Peninsula. Takayama and Yoshida (2007) estimated background maximum strain rate in South Kyushu to be 8.1×10⁻⁸strain/year to the
direction of N147° E. Taking relative locations of Station ONEG and Sakurajima into account, influence of back-ground extension is inferred to be 〜1 mm between the two
Fig. 8. Temporal changes in tilt at Stations AVOT, HVOT, HAR and KOM. The bottom graph shows strain changes at HVOT. Extensions “-R” and “-T” indicate tilt or strain changes in the radial direction to the crater and tangential to it, respectively. (b) En-largement of tilt and strain changes at Station AVOT around Inf2 in (a). Radial tilt is indicated by “WT-R,” “EX-R” and “EX-T” show strain changes in the radial direction from the crater and tangential to it, respec-tively. Downward arrows indicate explosions (black: Minamidake event, grey: Showa crater event). Upward arrow indicates start of inflation. Disturbance imme-diately before was caused by the earthquake at Samoa Islands.
Fig. 9. Vectors of horizontal displacement around the Aira caldera (top) and at Sakurajima (bottom). Horizontal displacement vectors are shown by arrows, relative to Station ONEG. Top: Central cones of Sakurajima are indicated by “S.” The dot indicates pressure source. Bottom: Black arrows are observed horizontal displacements and gray ones are obtained by assuming two pressure source “A” and “B.” Letters “M,” “K” and “S” indicate craters Minamidake, Kitadake and Showa, respectively.
campaigns. The horizontal displacement vectors show an outward radial pattern from the center of the Aira caldera. At Sakurajima, a characteristic pattern can be observed. Displacements at the northern part are <0.5 cm and the displacements become larger at the southern part, showing clear southward vectors. The movements in the eastern and western parts show southeast the southwest directions, respectively. The pattern of horizontal displacements can be approximated by an inflation source in the Aira caldera and beneath Sakurajima. Adual-source model was applied to the inflation stage prior to activity peaking at Minami-dake (Yoshikawa, 1961) and to the deflation stage in the 1980s (Eto, 1988). Assuming two sources of the Mogi type (Mogi, 1958), the locations and changes in volume of the two sources were determined by applying a grid search method. The major source was obtained at a depth of 12 km beneath the center of the Aira caldera (Source A in Fig. 9) and the increase in volume of the source was estimated to be 8×10⁶m3during the period from November 2009 to
April 2010. The additional source with increase in volume of 4×10⁵m3was obtained at a depth of 5 km beneath the
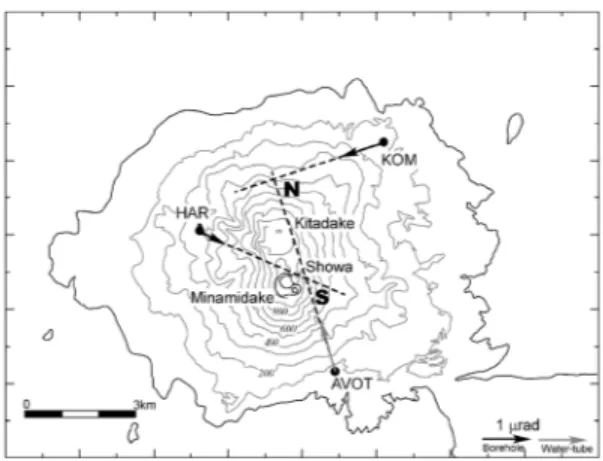
north flank of Kitadake, as indicated by Source B in Fig. 9. The location of Source B as obtained by GPS obser-vation is supported by the tilt vectors on the flanks of the volcano. The tilt vectors at Stations AVOT, HAR and KOM during the same inflation stage are shown in Fig. 10. Awater-tube tiltmeter in the underground tunnel (HVOT) was not operated well during the period (Fig. 8). It can be seen that the tilt vectors intersect each other at the summit area of the Minamidake crater (S in Fig. 10) and the northern flank of Kitadake (N). The intersect S coincides the pressure source beneath Minamidake, which has been previously known and correspond to a magma reservoir at depths 3-6 km (Ishihara, 1988; 1990). Source B obtained by GPS observation corresponds to the intersect N of the tilt vectors.
Amount of the tilt changes at these stations induced by Source B are examined based on Mogi model (Mogi, 1958). According to Ishihara (1990), the tilt change (d) at a horizontal distance r caused by a spherical pressure source a radius (a) at depth D is expressed as follows:
δ=k 3Dr
p2+r252, (1)
where the parameter k is written in terms of Lameʼs constants, λ and μ, and the pressure change Δp,
k=λ+2μa2μλ+μ .3Δp (2) Based on the Mogi model, volume increase of Source B by 4×10⁵m3induces tilt changes of 1.1, 0.4 and 1.0×
10−6rad at Stations KOM, AVOT and HAR, respectively.
Observed tilt change at Station KOM during the period (0.9×10⁻⁶rad) is almost same to our estimation while the
observed tilt changes at Stations AVOT and HAR, 1.1 and
0.5×10⁻⁶rad are twice and half of the calculated values,
respectively. The difference at Station AVOT may be affected by another pressure source at the intersect S in Fig. 10.
6.Ground deformation associated with individual ex-plosions
Each explosion at the Showa crater was associated with strain changes and sometimes with tilt changes, similar to the explosions at Minamidake, which showed an upward tilt of the crater side and extensions in both radial and tangential strain 10 min to 7 h prior to the start of the explosions, and the deflationary tilt and strain associated with them (Kamo and Ishihara, 1989). However, the ground deformations associated with the explosions at the Showa crater are different from those of Minamidakeʼs origin in their time series and source locations. Similarities to and differences from the ground deformation associated with the Minamidake events are useful in extracting characteris-tics of eruptive activity at the Showa crater in addition to long-term changes.
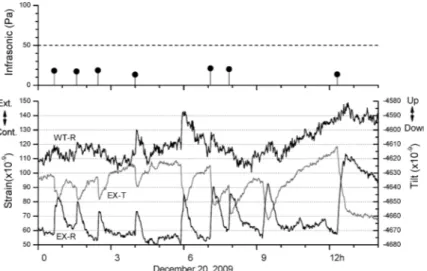
Fig. 11 shows an example of the records of tilt and strain changes at Station AVOT on December 20, 2009. The Sakurajima volcano is surrounded by the sea, and thus the tilt and strain records are strongly affected by ocean tides. At the largest, the strain changes caused by the tidal level change attain a value of 7×10⁻⁷in the radial component
at Station AVOT. We corrected the strain recordsby re-moving the effects of ocean tide by using the hybrid method of BAYTAP-G (Tamura et al., 1991) and the ob-served tidal level (Fig. 11). The hybrid method is effective in removing unexpected changes in tidal levels, such as secondary undulation, tsunami, and high tidal levels resulting from typhoons.
Fig. 10. Tilt vectors in the deflation period from June to November 2010. “N” and “S” are points where the tilt vectors intersect each other.
6-1 Typical inflation
Prior to an explosion, the contraction and extension strains are recorded in the radial and tangential compo-nents of the extensometers, respectively (Fig. 11). When an explosion occurs, the changes in strain are extensions and contractions in the radial and tangential components, respectively. Among 578 explosions in 2009 at the Showa crater, radial strain changes with amplitude of larger than 10×10−9were detected prior to 340 explosions at Station
AVOT. Such strain changes prior to the explosions lasted for less than 1 h for 209 events, and durations of 1-2 h were recorded for 71 events and 2-3 h for 27 events. On the other hand, precursory tilt changes with amplitudes larger than 20 × 10−9 rad were detected only for 31
explosions including the last event in Fig. 11.
The inverted polarities between the radial and tangential components of strain and the smaller change in the tilt are likely caused by the shallowness of the pressure source. Based on Mogiʼs model (Mogi, 1958), the radial strain (εr)
and the tangential strain (εt) at the horizontal distance r,
caused by the pressure change (Δp) of a small sphere with a radius (a) at depth D are written as follows (Ishihara, 1990): εr=k p 2−2r2 p2+r252 εt=k 1 p2+r232 . (3)
As estimated from Eqs. (1) to (3), the radial and tangential strains induced by a source at depth zero are −2kr3 and kr3, respectively, otherwise the tilt change
becomes zero. Defining β as the ratio of the radial to tangential strain, it is written in terms of horizontal
distance and source depth as:
β≡εr εt=
p2−2r2
p2+r2. (4)
Then, the source depth is obtained as follows:
p=
2+β1−β r. (5)Applying Eq. (5) to the strain changes associated with 340 explosions at the Showa crater in 2009, possible source depths and volume changes derived from the parameter k are obtained as shown in Fig. 12. The source
Fig. 11. An example of tilt and strain records associated with explosions at the Showa crater. Top: Amplitude of air shock to indicate occurrence of explosions. Bottom: Tilt and strain changes at Station AVOT. Radial tilt is indicated by “WT-R,” “EX-R” and “EX-T” show strain changes in the radial direction from the crater and tangential to it, respectively.
Fig. 12. Deflation volumes and depths of pressure sources. Gray and white circles indicate explosions at the Showa and Minamidake craters, respectively.
depths are obtained at a range from 0 to 1.5 km and the values of the parameter k are less than 105m3. Although
the estimated values contain large uncertainties due to unknown source size compared with the source depth and complexity of volcanic topography, especially near the crater, the contraction in the radial strain and extension in the tangential strain indicate a shallow depth for the pressure source associated with explosions at the Showa crater. For inconsistent polarities between the radial and tangential components, the source depth should be shal-lower than2 r (approximately 3 km for the threshold at Station AVOT), considering Eq. (3) under the assumption of a sufficiently small source. In many explosions, no significant changes were detected by the sensors at Station HVOT at a further distance (3.4 km) from the crater. The pressure sources associated with explosions at Minami-dake were obtained at depths of 2-6 km (Ishihara, 1990) and 4 km (Tateo and Iguchi, 2009) beneath the crater, where consistent-polarity strain changes in both the radial and tangential components were observed (Ishihara, 1990). In addition, significant tilt changes were observed prior to explosions at Minamidake (Ishihara, 1990). However, only trivial tilt changes are detected prior to the most events at the Showa crater. These facts indicate a shal-lower depth for the pressure source associated with explosions at the Showa crater than those at the Minami-dake crater.
6-2 Longer and larger inflation
Inflation deformation prior to the explosions at the Showa crater sometimes continued longer than Minami-dakeʼs explosions, which were preceded by inflation with a duration of up to 7 h (Kamo and Ishihara, 1989). The explosions in May 2008 had precursory inflations with durations from several to 20 h (Fig. 13a). Despite small number (9 events among 340 in 2009) of explosions, inflations with a long duration of >7 h were followed by larger explosions than usual ones at the Showa crater. Tilt and strain changes are also different from the usual ones: long duration makes a large strain changes, as the amplitude of Station AVOT attained more than 40×10−9.
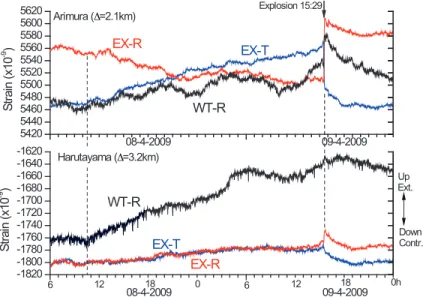
In addition, upward tilts of the crater side were observed at Station AVOT, and tilt and strain changes were also detected at Station HVOT. Fig. 14 shows a typical ex-ample of tilt and strain records associated with such an explosion with long duration and large amplitude. The explosion started at 15 : 29 on April 9, 2009, producing a pyroclastic flow up to distance of 1.1 km, and an ash cloud rose 4000 m above the crater. The radial tilt at Station AVOT began to show a crater-side-up motion at 10 : 00 on April 8, 29 hours prior to the explosion, and contraction and extension strains started simultaneously in the radial and tangential components, respectively. The inverted polarities between the radial and tangential components indicate that the inflation was induced at a shallow depth beneath the crater. The tiltmeters showed a crater side up
motion, and extensions appeared in both the radial and tangential strains simultaneously at Station HVOT. How-ever, the consistent extensional polarity between the radial and tangential stains cannot be explained by the shallow source. The source generating consistent polarities of radial and tangential strains must be deeper than2 r from Eq. (3). It was inferred that the strains recorded at Station AVOT were caused by a shallow source, and that the deformations at Station HVOT and the tilt at Station AVOT were mainly induced by a source deeper than 2 r . This indicates that the ground deformation prior to such a large explosion was induced by the shallow and deep sources. The smaller change in the radial strain than tangential one at AVOT may be due to an addition of a deep extension source to a shallow contraction one. Otherwise, tangential strain was enhanced by an addition of extensions at both a deep and a shallow depth.
Next, a dual-Mogi source was applied to the tilt and
Fig. 13. Tilt and strain records associated with explosions at the Showa crater. The records were obtained at Station AVOT. Dashed vertical lines indicate occur-rences of explosive eruptions. Temporal change in radial tilt is indicated by “WT-R.” R” and “EX-T” show strain changes in the radial direction from the crater and tangential to it, respectively.
strain data at Station AVOT and Station HVOT shown in Fig. 14 to obtain the temporal changes of parameters k of the two sources. It is difficult to adequately constrain the depths of the sources in each time interval. Hence, we fixed a deep source at a depth of 4.8 km from the ratio of the areal strain to tilt changes observed at Station HVOT from the beginning of inflation to the explosion, and a shallow one at a depth of 1. 0 km from the records at Station AVOT from Eq. (5). Hourly changes of the source volumes were estimated by minimizing the residuals between the theoretical tilt and strain changes calculated from the dual-Mogi sources and the observed values of 6 components: 2 tilts, 2 radial, and 2 tangential strains at Stations AVOT and HVOT. The results are shown in Fig. 15. An increase in volume at the deep source started at 10 : 00 to 11 : 00, and the volume increase in the shallow source started 3 h later. However, the rate declined on April 9. In contrast, the increase in the volume rate for the deep source increased stepwise. In particular, the rate increased rapidly immediately prior to the explosion. The volume change for the modeled deep source was 40 times larger than that for the shallow source. Small explosions are related to only shallow sources, however, larger explosions are contributed to by deep sources with large volume changes, in addition to shallow ones.
6-3 Time-series patterns of inflation
The time-series patterns of inflation associated with explosions at Showa crater are different from those at the Minamidake crater, where the inflation rates are nearly constant (Ishihara, 1990; Tateo and Iguchi, 2009). The inflation rate of explosions at the Showa crater seems to
Fig. 14. Tilt and strain records before and after the explosion at 15: 29 on April 9, 2009. Top: AVOT, bottom: HVOT. Radial tilt is indicated by “WT-R.” “EX-R” and “EX-T” show strain changes in the radial direction from the crater and tangential to it, respectively.
Fig. 15. Temporal change in estimated volume of deep and shallow sources. Calculated hourly tilt and strain changes are compared with observation (bottom).
decrease near the onset of an explosion, and inflation sometimes ceases as shown in Fig. 13b. Among 340 ex-plosions in 2009, 209 events were preceded by inflation with such decreasing rates. Otherwise, deformations of constant inflation rates were observed for 124 events and accelerating patterns were only 16. The decreasing pattern of the inflation rate or the suspension of inflation and a longer duration of precursory inflation are similar to those prior to non-explosive eruptions at the Minamidake crater (Ishihara, 1990) or inflation prior to swarms of BL-type earthquakes (Tateo and Iguchi, 2009).
Iguchi et al. (2008c) detected minor deflations immedi-ately prior to the occurrence of explosions at Sakurajima, Suwanosejima and Semeru volcanoes. Aminor deflation appears as a contraction in the strain record at Station HVOT 1-2 minutes prior to an explosion at the Minami-dake crater. Some explosions at the Showa crater also occur immediately after minor contractions. Among 209 explo-sions of which precursory inflation rate decreased ap-proaching onset of explosions, 143 events were preceded by minor contraction 1 to 15 minutes before. Fig. 16a shows an enlargement of strain records prior to the occurrence of two explosions at the Showa crater. An extension of strain started at 17 : 00 on November 17, 2009 and an explosion occurred at 21 : 14. The tangential strain began to show
contraction at 20 : 59, 15 minutes prior to the explosion. The radial strain showed a slight extension later. This indicates that the deflation source immediately prior to the explosion is located at a shallow depth (maybe <1 km). A second example is shown in Fig. 16b. Although the event at 04 : 23 on November 13, 2009 is not defined as an explosion based on the definition in this study because the amplitude of the infrasonic wave was only 6 Pa, it was accompanied by fairly large ground deformation. The extensional strain became a minor contraction at 04: 12, 11 minutes prior to the occurrence of the eruption, and the strain changes were <5×10⁻⁹. The duration of minor
contraction was longer than that for Minamidake (1-2 min; Iguchi et al., 2008c).
6-4Upward tilt after explosion
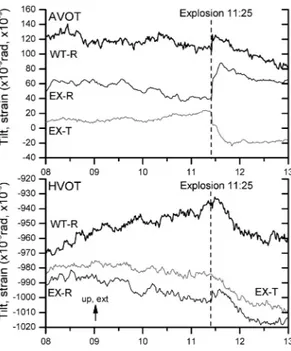
Some explosions show an upward tilt of the crater side immediately after their onset. Among 340 explosions in 2009, 135 events were followed by such upward tilts. Fig. 17 shows tilt and strain records before and after an explosion at 11 : 25 on February 6, 2008. The explosion accompanied a pyroclastic flow that flowed downhill eastward, reaching a distance of 1.3 km. Prior to the oc-currence of the explosion, records at Station AVOT show an upward tilt of the crater side, a contraction strain in the radial component, and an extension strain in the tangential
Fig. 16. Strain records associated with explosions at the Showa crater. The records were obtained at Station AVOT. Beginning of explosion (a) and eruption (b) are indicated by “E.” “MC” indicates the start of minor contraction prior to the eruption. “EX-R” and “EX-T” show strain changes in the radial direction from the crater and tangential to it, respectively.
Fig. 17. Tilt and strain records before and after the ex-plosion at 11: 25 on February 6, 2008. Top: AVOT, bottom: HVOT. Radial tilt is indicated by “WT-R.” “EX-R” and “EX-T” show strain changes in the radial direction from the crater and tangential to it, respec-tively.
component. An upward tilt prior to the explosion also was observed at Station HVOT. After the beginning of the explosion, the upward tilt accelerated, in contrast to the downward tilt associated with explosions at the Minami-dake crater (Ishihara, 1990). The upward tilt turned down-ward 10 minutes after the beginning of the explosion. The observed simultaneous extension in radial strain and the contraction in tangential strain after the beginning of the explosion were caused by a deflation of a Mogi source in a shallow area beneath the crater. However, the upward tilt of the crater side was induced by inflation alone - inde-pendent of source depth.
The inconsistent ground deformation between tilt and strain can be explained by a dual-Mogi source; that is, it is composed of shallow deflation and deeper inflation sources. Shallow source contributes to strain mainly, whereas a deeper source influences tilt, as inferred from Eqs. (1)-(3). Adual source possibly is applied to the tilts and strain data at Stations HVOT and AVOT. Shallow deflation and deep inflation sources could be obtained at depths of 60 m and 640 m, respectively, for the explosion on February 6, 2008. The shallow source is constrained at shallower than 200 m, however the deep source has a larger range of ambiguity from 150 m to 1650 m.
7.Discussion
Associated with eruptive activity at the Show crater since 2006, quasi-annual cycles of inflation-deflation were observed. The inflation ground deformation during the period from October 2009 to March 2010, the largest event, is caused by a dual-source located at the center of the Aira caldera and the northern flank of Kitadake. Ground deformation associated with individual explosions is caused by shallow sources. Durations of inflations prior to the explosions are mostly less than 1 h, but sometimes are much longer than those of Minamidake event. Temporal changes of inflation strain show decelerating patterns with time and inflationary tilt immediately after explosions. We will discuss the characteristics of the long-term and short-term deformations with relation to the magma supply system and eruptive activity.
7-1 Magma plumbing system from the Aira caldera to Sakurajima
Previous studies mainly based on seismic and ground deformation observations (Mogi, 1958; Yoshikawa, 1961; Kamo, 1988; Ishihara, 1988; 1990; Eto et al., 1997; Hidayati et al., 2007) show that magma plumbing system of the Sakurajima mainly consists of the main magma reservoir located at a depth of 10 km beneath the center of the Aira caldera, the minor magma reservoir located at a depth of from 3 to 6 km beneath Minamidake and the conduit connecting the minor reservoir to the crater bottom of Minamidake.
The inflation that started in September/October 2009 was the largest ground deformation since the beginning of
eruptive activity at Showa crater in June 2006. Horizontal displacements detected by GPS observations showed that the deformation was mainly caused by inflation of the pressure source at a depth of 〜10 km beneath the Aira caldera. The pressure source occupies almost the same location as those during the inflation stage of the Aira caldera (Yoshikawa, 1961), during the pre-eruptive period of the violent activity at the Minamidake crater before 1974 (Ishihara and Eto, 1978) and before the eruptive activity beginning from 2006 at the Showa crater (Eto et
al., 1997; 1998a; Iguchi et al., 2008b; Yamamoto et al.,
2008). This consistency suggests that the magma has been accumulated at the same position for the period when the Minamidake was active and after the eruptive activity that started at the Showa crater.
An additional pressure source in the northern part of Sakurajima was obtained by the GPS observation (Fig. 9), which is supported by tilt vectors (Fig. 10). Inflation produced by a similar source in the northern part was detected by precise leveling and tide gauge observation prior to the increase in explosive activity at the Minami-dake crater in 1974 during which 489 explosions occurred (Ishihara and Eto, 1978). Although the source was supported only by the leveling survey near the north coast at the time of Ishihara and Eto (1978), the inflation sources were detected at the northern part prior to the increase in violent eruptive activity at Minamidake and associated with increase in the eruptivity during the period from October 2009 to March 2010. Kitadake and its sur-roundings are known to be anomalous zones of atte-nuation of seismic waves in addition to the Minamidake area (Kamo et al., 1980; Suzuki, 1999). It is possible that the northern part of Sakurajima serves as a temporary storage area for magma when the magma migrates from the Aira caldera to Sakurajima. The magma supply system from the Aira caldera to a site beneath the central cones has not, to date, been changed by the current eruptive activity at the Showa crater. Therefore, two magma storages beneath the central cones -Kitadake and Minami-dake- are inferred.
7-2 Reservoir-conduit system for eruptions at Showa crater
The deformation associated with explosions at the Showa crater can be explained by a dual source: a shallow source at a depth <1.5 km, and a deep one at a depth of around 4 km. The sources are related with a reservoir-conduit model beneath the Minamidake summit crater proposed by Ishihara (1988; 1990). The magma reservoir occupies a region at depths of 3-6 km and the reservoir is connected to the crater bottom of Minamidake by the conduit with the diameter of 0.3-0.5 km at a depth of 2 km and 40-60 m in the uppermost part. The depths of the deep sources inducing larger pre-eruptive deformation of the Showa crater are almost the same as the depths of pressure sources inducing ground deformation associated with explosions at
the Minamidake crater (Ishihara, 1990; Tateo and Iguchi, 2009). This indicates that a deep reservoir is used for the eruptive activities at both the Minamidake and the Showa craters. It is inferred that the conduit that connects to the Showa crater extends from a reservoir independently of the major conduit to Minamidake, or it may branch from the major conduit at a depth. The shallow source for ground deformation related to explosions at the Showa crater may be located in the branched conduit. The change in strain at Station AVOT induced by the shallow source is 4 times larger than that at Station HVOT. Considering the difference in distances (HVOT: 3.2 km, AVOT: 2.1 km from the Showa crater, HVOT: 2.7 km, AVOT: 2.4 km from the Minamidake crater), it is more reasonable to infer that the shallow source is located in the branched conduit beneath the Showa crater rather than in the major conduit below Minamidake. The hypocenter of the explosion
earthquake on February 3, 2008 was located 2 km beneath the Minamidake crater. It is, therefore, inferred that the conduit connected to the Showa crater branches at a depth of 1-2 km from the major conduit to Minamidake (Fig. 18).
7-3 Magma intrusion rate and a smaller conduit to Showa crater
If magma migrated to the Showa crater by the same supply system during the eruptive activities at Minami-dake -from the Aira caldera to MinamiMinami-dake through Kitadake- a more frequent occurrence of smaller explo-sions at the Showa crater might result from the branched conduit from the magma reservoir beneath the Minami-dake crater or in the middle of the major conduit to the crater. The difference of the branched conduit to the Showa crater from the major conduit to the Minamidake crater can be discussed in the relation of long-term ground
Fig. 18. Schematic figure of the conduit system for eruptive activity of the Showa crater. a) Eruptive period at the Minamidake crater, b) Eruptive period at the Showa crater since 2006. Hypocenters of A-type earthquakes are indicated by asterisks, BH-type by dots, BL-type by open circles and the zone of explosion earthquake by the dashed rectangle.
deformation.
After the beginning of the eruptive activity in 2006, the strain data show quasi-annual cycles of extension and contraction (Table 1 and Fig. 7). Although annual cycles of strain changes have been discussed with precipitation and temperature change in underground tunnels (Teraishi
et al., 2009) and atmospheric pressure and ocean tides
could affect crustal deformation (Ohtake and Nakahara, 1999; Tsuruoka et al., 1995), the inflation-deflation process during the period from October 2009 to October 2010 was inferred to be directly caused by the intrusion and discharge of magma for the following reasons: (1) The strain change was larger than the previous annual cycles and attained a sufficiently high level to be detected by the baseline changes measured by GPS (Fig. 6). (2) After the start of extension strain in October 2009, the number of explosions and the weight of volcanic ash emitted increased (Fig. 7).
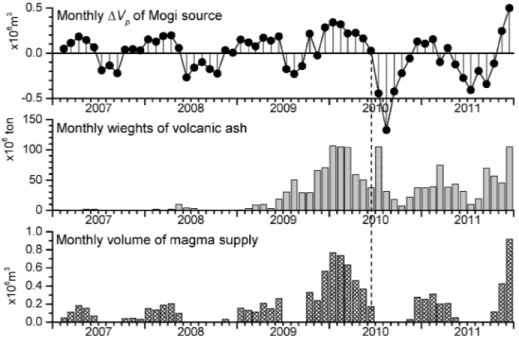
In order to discuss the relationship of ground deforma-tion with eruptive activity more quantitatively, the monthly change in the volume of the pressure source was compared with the monthly amount of volcanic ash ejected from Sakurajima. The volume change at the ground surface (ΔV) was obtained by integrating the vertical displace-ment for distance from zero to infinity. Using the expres-sion of radial strain in Eq. (1), it is described as follows:
ΔV=2πεrp2+r2
52
p2−2r2 . (6)
Considering the relation of volume change between the ground surface and at the source (Delaney and McTigue, 1994), the volume change of the pressure source is represented by:
ΔVp= πεrp 2+r252
1−νp2−2r2, (7)
where ν is Poissonʼs ratio. Here, a pressure source is assumed to be located at a depth of 4 km beneath Minami-dake. In addition, we estimate the intrusion volume of magma in the reservoir by adding the eruption volume of magma to the inflation volume of the pressure source at that depth. It is necessary to consider the volatility of the magma in order to estimate the volume of erupted magma; however it is difficult to see the contribution of this vola-tility and estimate the influence on the bulk modulus of internal magma. Therefore, we suppose that the weight of volcanic ash is directly related to the magma volume at the depth of the reservoir by a DRE (Dense Rock Equivalent) density of 2500 kg/m3. Obtained monthly volumes of
intrusion magma are shown in Fig. 19 with volume of the pressure source and amount of volcanic ash.
It was observed that eruptive activity and pressure source volume increased when the magma intruded at a higher rate, and the eruptive activity and source volume decreased when the intrusion rate became low or negative. The monthly changes in volume became positive (2×10⁵
m3/month) in October 2009 and the positive volume
changes continued until May 2010 except November 2009.
Fig. 19. Relation of monthly change in volume of pressure source to volcanic ash ejected. Top: monthly change in volume of pressure source estimated from radial strain change at HVOT. Middle: monthly weight in volcanic ash ejected from the crater. Bottom: monthly volume of magma supply.
When the volume changes were positive values, volcanic ash of more than 5×10⁵ton/month was ejected. During
the high eruptivity and inflation period, the monthly intrusion rate increased, exceeding 6×10⁵m3/month
(De-cember 2009 to March 2010). In contrast, the monthly volume change became negative during the period from July to November 2010, and this deflation period corresponded to the ejection of smaller amounts of volcanic ash (<5×10⁵ton/month̶except for July 2010).
The negative volume change implies a decrease in the magma in the reservoir. Considering the flux balance in the reservoir between intrusion and discharge, the dis-charge overcomes the intrusion. The intrusion rate be-came negative during the period from July to October 2010. The monthly weight of volcanic ash as an indicator of magma discharge was smaller during the deflation period. This indicates that the intrusion rates in the deflation period were much less than those in the inflation period̶possibly almost stopped̶and that the magma accumulated in the inflation stage was ejected.
Accumulations and discharges of the magma simultane-ously progressed beneath Sakurajima during the inflation stages from October 2009 to May 2010, December 2010 to February 2011 and after November 2011. Such a simul-taneous occurrence of an accumulation of magma and a discharge may be caused by a small open conduit con-nected to the Showa crater and a slightly larger intrusion of magma. Intruded magma is mostly accumulated in reservoirs due to the completely closed conduit during the dormant phase with inflation of volcanoes; however a part of the magma that intruded into the reservoir is discharged by eruptions at volcanoes with partially open conduits. Aperture ratio for the reservoir in the eruptive activity at the Showa crater may be much smaller than that at the Minamidake crater. During the high eruptivity of Minami-dake from 1972 to 1992, the northern part of Sakurajima continued to subside, resulting in a deflation of the volcano (Eto et al., 1998a). The vulcanian eruptions at Minami-dake were large, and 2.4×10⁸tons of volcanic ash were
ejected during the period. The diameter of the major conduit connected to the bottom of the Minamidake crater is estimated to be 0.3-0.5 km at a depth of 2 km, and it is 40-60 m in the uppermost part from the size of the red-hot portion of a lava dome at the bottom of the crater (Ishihara, 1990). Aconduit of this size could discharge a large amount of volcanic ash. On the other hand, the size of the uppermost part of the conduit connected to the Showa crater is estimated to be only 5-10 m, based on aerial photographs taken on May 31, 2011 by the Kagoshima Local Meteorological Observatory of the Japan Meteoro-logical Agency. Conduit size may control the balance of intrusion and discharge of magma. The smaller size of the conduit of the Showa crater is related to the characteristics of ground deformation differently than from the explosions at Minamidake. One is a slow, long-duration inflation
prior to explosions, while the inflation duration prior to explosions at Minamidake is less than 7 h (Kamo and Ishihara, 1989). Inflation strain prior to explosions at the Showa crater sometimes continues for more than 20 hours. The explosion on April 9, 2009 was preceded by inflation for 29 hours (Fig. 14). The tilt and areal strain rates prior to the explosion were only 4×10⁻⁹rad/h and 2×10⁻⁹/h
at Station HVOT, respectively, which is much smaller than the tilt rate (20-90×10−9rad/h) and areal strain rates
(10-50 × 10−9/h) at the same station prior to the
explosions at Minamidake (Tateo and Iguchi, 2009). The longer durations of minor contraction immediately prior to explosions are noted, as shown in Fig. 16. Some explo-sions at the Showa crater are accompanied by a temporary upward tilt of the crater side immediately after the onset of the explosions, as shown in Fig. 17. The explosions at Minamidake have never resulted in a temporary upward tilt after the onset of the explosions, and they are accom-panied by a downward tilt only. To explain this, the inflation source needs to be located at a depth that is deeper than the deflation source, as mentioned in Section 6-4. Apressure decrease caused by the collapse of a gas pocket in the uppermost conduit induces a sudden de-gassing in the magma below, and this sudden dede-gassing causes a volume increase at depths in the conduit. The volume increase in a large conduit may be observed as an instantaneous expansion, such as an isotropic expansion of 2 km deep generating P-wave first motions of explosion earthquakes at Minamidake (Tameguri et al., 2002), and the expansion is rapidly eliminated by an upward moving of fluid through the large conduit. In the smaller conduit connected to the Showa crater, it takes a longer time to release the temporary expansion.
8.Conclusions and remarks
The major magma reservoir beneath the center of the Aira caldera has continued to inflate since 1993. Eruptive activity at the Showa crater of the Sakurajima volcano resumed in June 2006 during a caldera-inflation stage. The magma moves from the Aira caldera, passing through an initial storage space below Kitadake and its northern flank, and reaches the magma reservoir beneath Minami-dake. The Showa crater is a vent of a small conduit branched from the reservoir or from the major conduit to Minamidake. The ground deformation associated with explosions at the Showa crater is mainly induced by a shallow source in the branched conduit in addition to a deep source corresponding to the magma reservoir below Minamidake.
Tilt and strain showed a rapid inflation in September 2009, exceeding the previous annual cycles, and the in-flation, which continued until May 2010, was accom-panied by the increase in eruptive activity at the crater. An accumulation of magma beneath the central cones of the Sakurajima progressed simultaneously with the discharge
of magma. The simultaneous progress of accumulation and discharge of magma and the frequent occurrence of small explosions may be related to the small open conduit, which is inferred from the characteristic patterns of ground deformation.
However, the conclusions mentioned above are only relevant factors during the period from 2006 to 2011, and may not be essential to the overall activity of the Showa crater, which can only be evaluated after termination of the activity, because the activity is still ongoing and has not culminated yet, suggesting that a drastic change of activity in the near future is possible.
Acknowledgements
Volcano observations at Sakurajima volcano are main-tained by staffers of SVRC, DPRI of Kyoto University. The study is supported by the Project of Earthquakes and Volcanic Eruption Prediction from MEXT. The seismic, geodetic and infrasonic data at Station AVOT are provided by the Osumi Office of River and National Highway, Kyushu Regional Development Bureau, MLIT. The comments from two anonymous reviewers and Prof. Nishimura as a guest editor for this Special Issue were very helpful in revising the manuscript.
References
Delaney, P.T, and McTigue, D.F. (1994) Volume of magma accumulation or withdrawal estimated from surface uplift or subsidence, with application to the 1960 collapse of Kilauea Volcano. Bull. Volcanol., 56, 417-424.
Eto, T. (1988) Ground deformation around Sakurajima volcano -1982〜1985-. In Report on 6th joint observation
of Sakurajima volcano, 15-19 (in Japanese).
Eto, T., Takayama, T., Yamamoto, K., Hendrasto, M., Miki, D., Sonoda, T., Matsushima, K., Uchida, K., Yakiwara, H., Wan, Y., Kimata, F., Miyajima, R. and Kobayashi, K. (1997) Re-upheaval of the ground surface at the Aira caldera -December 1991〜October 1996-. Ann. Disast.
Prev. Res. Inst., Kyoto Univ., 40B-1, 49-60 (in Japanese
with English abstract).
Eto, T., Takayama, T., Yamamoto, K., Hendrasto, M., Miki, D., Sonoda, T., Matsushima, K., Uchida, K., Yakiwara, H., Wan, Y., Kimata, F., Miyajima, R. and Kobayashi, K. (1998a) Result of precise leveling around Sakurajima vol-cano -December 1991〜October 1996-. In Report on 9th
joint observation of Sakurajima volcano, 15-29 (in
Japanese).
Eto, T., Takayama, T., Sonoda, T. and Yamamoto, K. (1998b) Result of EDM around Sakurajima volcano -January 1992〜December 1996-. In Report on 9th joint observation
of Sakurajima volcano, 31-37 (in Japanese).
Hagiwara, T., Omote, S., Murauchi, S., Akashi, K. and Yamada Z. (1948) The eruption of Mt. Sakura-Zima in 1946. Bull. Earthq. Res. Inst., Univ. Tokyo, 24, 143-159 (in Japanese with English abstract).
Hidayati, S., Ishihara, K. and Iguchi, M. (2007)
Volcano-tectonic earthquakes during the stage of magma accumu-lation at the Aira caldera, southern Kyushu, Japan. Bull.
Volcanol. Soc. Japan, 52, 289-309.
Hirabayashi, J., Ossaka, J. and Ozawa, T. (1986) Geochemical study on volcanic gases at Sakurajima volcano, Japan. Jour.
Geophys. Res., 91, B12, 12167-12176.
Hirabayashi, J., Nogami, K., Kakuage, Y., Iguchi, M. and Miki, D. (2008) Volcanic activity of Sakurajima, com-position of volcanic gas and discharge of carbon dioxide from soil. In Report on 10th joint observation of Sakurajima
volcano, 149-163 (in Japanese).
Iguchi, M., Tameguri, T. and Yokoo, A. (2008a) Volcanic activity of Sakurajima during the period from 1997 to 2007. In Report on 10th joint observation of Sakurajima volcano, 1-18 (in Japanese).
Iguchi, M., Takayama, T., Yamazaki, T., Tada, M., Suzuki, A., Ueki, S., Ohta, Y. and Nakao, S. (2008b) Movement of Magma at Sakurajima Volcano Revealed by GPS Obser-vation. Ann. Disast. Prev. Res. Inst., Kyoto Univ., 51B, 241-246 (in Japanese with English abstract).
Iguchi, M., Yakiwara, H., Tameguri, T., Hendrasto, M. and Hirabayashi, J. (2008c) Mechanism of explosive eruption revealed by geophysical observations at the Sakurajima, Suwanosejima and Semeru volcanoes. Jour. Volcanol.
Geo-therm. Res., 178, 1-9.
Iguchi, M., Yokoo, A. and Tameguri, T. (2010) Intensity of volcanic explosions at Showa crater of Sakurajima volcano.
Ann. Disast. Prev. Res. Inst., Kyoto Univ., 53B, 233-240 (in
Japanese with English abstract).
Iguchi, M., Ohta, Y., Ueki, S., Tameguri, T. (2011) Volcanic activity of Showa crater in 2011. Ann. Disast. Prev. Res.
Inst., Kyoto Univ., 54B (submitted, in Japanese with English
abstract).
Ishihara, K. (1988) Geophysical evidences on the existence of magma reservoir and conduit at Sakurajima volcano, Japan.
Ann. Disast. Prev. Res. Inst., Kyoto Univ., 31B-1, 59-73 (in
Japanese with English abstract).
Ishihara, K. (1990) Pressure Sources and Induced Ground Deformation associated with Explosive Eruptions at an Andesitic Volcano: Sakurajima Volcano, Japan, In Magma
transport and storage (Ed. M. P. Ryan), John Wiley and
Sons, 335-356.
Ishihara, K. and Eto, T. (1978) Surface deformation associated with the eruptive activity at the summit crater of Sakurajima volcano. Ann. Disast. Prev. Res. Inst., Kyoto Univ., 21B-1, 152-162 (in Japanese with English abstract).
Ishihara, K., Takayama, T., Tanaka, Y. and Hirabayashi, J. (1981) Lava flows at Sakurajima volcano (I) Volume of the historical lava flows. Ann. Disast. Prev. Res. Inst., Kyoto
Univ., 24-1, 1-10 (in Japanese with English abstract).
Ishikawa, H., Eto, T., Tanaka, Y. and Ueki, S. (1981) Chronology of eruptive activity of Sakurajima volcano. In Report on Grant-Aid No.A-56-1, 153-179 (in Japanese). Kamo, K. (1978) Some phenomena before the summit
erup-tions at Sakura-zima volcano. Bull. Volcanol. Soc. Japan,
23, 53-64 (in Japanese with English abstract).