2021
年 2 月
JOURNAL OF SOUTHWEST JIAOTONG UNIVERSITY
Feb. 2021
ISSN: 0258-2724 DOI:10.35741/issn.0258-2724.56.1.31
Research articleEngineering
T
HRESHOLD
V
OLTAGE FOR
D
IGITAL
R
ESIDUAL
C
URRENT
C
IRCUIT
B
REAKER
B
ASED ON
T
ENSOR
F
LOW
基于张量流的数字剩余电流断路器的阈值电压
Erwin Sutanto a, *, Hammam Abror Ali b, Yhosep Gita Yhun Yhuwana c, Muhammad Aziz daBiomedical Engineering, Universitas Airlangga
Kampus C Unair, Surabaya, 60115 Indonesia, [email protected]
b Department of Enginnering, Faculty of Vocational, Universitas Airlangga
Kampus Unair, Surabaya 60286 Indonesia
c Department of Physics, Universitas Airlangga
Kampus C Unair, Surabaya 60115 Indonesia
d Institute of Industrial Science, The University of Tokyo
Tokyo 153-8550, Japan
Received: November 16, 2020 ▪ Review: December 12, 2020 ▪ Accepted: January 17, 2021
This article is an open-access article distributed under the terms and conditions of the Creative Commons Attribution License (http://creativecommons.org/licenses/by/4.0)
Abstract
The article describes a new way to define the threshold voltage for Machine Learning-based Digital Residual Current Circuit Breaker (RCCB), enabling the right cut-off point. Using the described methods, the authors obtained a gap to common mid voltage being around 0.5 V. The proposed technique is illustrated with three different loads of 3W, 5W, and 9W as the scope of this work. The authors try to apply it in Residual Current Circuit Breaker (RCCB). It could be useful in a hospital with a limited number of technicians to maintain various machines quickly. This work tries to realize a machine that could find out the best condition to cut off the electricity when there is any leakage current but keep the supply if it is still under tolerance. This allows improving the mistake of the midpoint about 16.97% over its wide range. The effectiveness of Python libraries usage realized the Artificial Neural Network (ANN) implementation as one of machine-learning algorithms. The learning process is applied to the measured leakage current data set. It goes with input preprocessing, training, testing, and data analysis. From all of those steps, it is possible to determine the induction voltage threshold at 1.080 from 3.3V as its maximum value with a negligible loss value of 0.0006. By comparing the value with a reference, it can be concluded that this method could be used in a real situation.
Keywords: Machine Learning, Threshold Voltage, Artificial Neural Network, IoT Application, Tensor Flow
摘要 本文介绍了一种新方法,可以为基于机器学习的数字式剩余电流断路器(农行)定义阈值电
技术以 3W,5W 和 9W 的三种不同负载为例进行说明。作者尝试将其应用在漏电断路器(农行) 中。在技术人员数量有限的医院中,快速维护各种机器可能很有用。这项工作试图实现一种机器 ,该机器可以找到最佳条件,以在有任何泄漏电流时切断电源,但如果仍在容差范围内,则可以 保持供电。这可以在整个范围内将中点的错误率提高大约 16.97%。Python 库使用的有效性实现 了人工神经网络(人工神经网络)作为机器学习算法之一的实现。学习过程将应用于测得的泄漏 电流数据集。它包含输入预处理,培训,测试和数据分析。从所有这些步骤中,可以将 3.3 伏特 的感应电压阈值确定为 1.080 的最大值,而其损失值可以忽略不计 0.0006。通过将该值与参考值 进行比较,可以得出结论,该方法可以在实际情况下使用。 关键词: 机器学习,阈值电压,人工神经网络,物联网应用,张量流
I. I
NTRODUCTIONThe use of electricity for medical devices in hospitals has been increased either in number. That is the reason why the Department of Health tries to improve regulations relating to the procurement of that medical equipment. Especially in Indonesia, among others requires that every medical device purchased and used must pass the test conducted by the Health Facility Safety Center, BPFK. One of the concerns is to protect patients against the leakage current [1]. This might due to medical devices may not have this protection in many field cases. Some cases might have happened because the device itself came without it as the manufacture leaves the responsibility to the hospital. It may also due to additional costs by providing those secondary fittings. As the simple way to do it is by having the Residual Current Device (RCD) detect the residual current and activate the circuit breaker. Furthermore, the effect might not be easy to see also. There might be electrical shocks [2] that can cause death [3] but might not be considered too many.
From previous research to detect the leakage current using RCD, a specific threshold voltage to define the cut-off point has been defined for its operation using capacitor [4]. It is shown that there was a gap around 1 V on its DC output between the condition without leakage current and the one with leakage current. This study is to utilize machine learning to define the best threshold voltage.
In this research, the authors use the Python language to realize it, and an Artificial Neural Network (ANN) is one of the common methods to do machine learning [5]. It was created by imitating the network of neurons in the human brain with the aim that the machine can learn similarly to the human brain. This algorithm
might be the best fit to find the threshold voltage as part of building an AI system to think about the leakage current. This work also relies on an IoT system that will collect the data [6]. Once the data is collected, the data will be used for training and predicting the best threshold value [7].
This complementary medical instrumentation will be connected to RCD similar to a common Residual Current Circuit Breaker (RCCB) to measure the leakage current problem. The only difference is it will compare it to a specific value before deciding to cut off the electricity. It might improve the accuracy in case of false alarm conditions [8] as disturbing trips [9]. It is also investigated in high frequencies [10]. The detection should be no longer based on the direct analog circuit, but it could be based on this digital microcontroller, an IoT device, as in many smart tools [11]. It will also be recording the value, which could be used for monitoring that leakage current. Meanwhile, the common RCCB in the market could not read this value.
Machine learning could be seen as a kind of technology in computer science for an automation tool, allowing machines to work without being explicitly programmed. It is very useful in remote hospitals that may not have enough technicians. With the fast-paced technology for a huge volume of information known as big data, a machine should learn on its own without always being controlled every time. Machine learning is also one of the sciences that must be learned today because this system is needed in the automation process as described. The use of machine learning has been widely used in research for the medical world.
II. M
ETHODSThere are important things to define the threshold voltage [12]. The first is on how to use
this threshold value and where is the position for the machine learning. The second thing is the leakage current itself. It is about how to measure it with RCD. Finally, it is machine learning on how to get the threshold voltage.
A. Central Monitoring
This system would allow the machine as leakage current data source to be placed remotely. It will be using IoT devices as a communication framework while also doing simple comparison activities. Therefore, an IoT device and a server are utilized for soil moisture monitoring [13]. Both IoT and server will be collecting the data to a server. Then, the received data collection will be used as a dataset. For the IoT device and communication server, we use WeMos D1 R2 and Blynk server, respectively [14]. Then, we use python to collect data from the Blynk server and utilize the python library for machine learning at the server.
Figure 1. Central monitoring
Figure 1 shows the possibility of application from the system. This monitoring system is serving many utilities inside the hospital. Started from X-Ray Imaging, the baby incubator, ECG (Electrocardiography), until MRI (Magnetic Resonance Imaging), those electrical utilities could be monitored using a central Python server as in the analysis of building maintenance [15]. Using the server, the leakage current value which has been monitored could be learned using the common machine learning method of Artificial Neural Network (ANN). It will copy the neuron’s network in the human brain to learn the data similarly to the human brain.
𝜀 = −𝑑ϕB 𝑑𝑡 = −𝐴 𝑑 𝑑𝑡𝐵 cos(𝜔𝑡) = −𝐴 𝑑 𝑑𝑡 𝜇𝑟𝑁 𝜃.𝑟 𝐼𝑙𝑒𝑎𝑘𝑎𝑔𝑒cos(𝜔𝑡) (1) The designed system measures the leakage current as proofed in physics equations [16]. It can be utilized by using IoT technology. Existing hardware will be communicated with the Blynk framework, which functions to retrieve data from hospital tools. At a glance, how the IoT-based electricity leakage current detection system
works will initialize the Auth Key, Id WiFi, password WiFi dan IP server to be connected to the Blynk server. Meanwhile, the reading process in this system will still be done by the WeMos D1-R2 microcontroller as in [17]. In this case, the test is carried out; there are 2 conditions the same as the hardware made [4]. Normal conditions happened when the incoming and outgoing flow of electric current is going through the RCD. In other cases, the leakage current condition will be simulated by bypassing the outgoing path. It will generate a magnetic flux that could be read as an induction voltage value. During this condition, its value will reach its maximum point. In general, the resulting voltage value usually exceeds 1 Volt. This value can be used as a temporary indication of any leakage current. On the other side, an induction voltage with a value less than 1 Volt can be indicated as a normal condition. We can use this threshold value of 1 Volt intuitively by looking at the distribution of the two groups of values from the measurement results as in [4]. From the whole data, it can be managed to be used as training data and test data to find the right value.
B. Induction Voltage Training
It is expected that by monitoring the leakage current, we can find out the best threshold of leakage current when it is still in normal condition, or it is already in leakage current condition. In making the machine learning model, the data set from the recorded leakage currents will be used in training. From there, it will utilize machine learning in its ability to predict the best value for the classification's threshold. It makes a learning cycle. Started from the retrieval data of the electric leakage current, it is then utilized again for learning of the system. After that, it is used against the system for the same device with the same RCD.
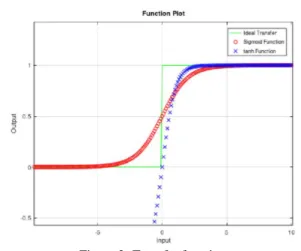
It is possible by taking the input variable as a form of induced Voltage. By using machine learning, it is then necessary to do output classification. In this case, the normal condition will be classified as 0, and then the leakage current condition with 1. After that, we should define the architecture for the Artificial Neuron Network (ANN) method. The method should be chosen carefully based on the application. Since our application is kind of pattern recognition, the best function should be kind of Fig. 2.
Figure 2.Transfer function
If possible, the cut-off between the normal condition and leakage current condition should be like the ideal transfer. The threshold point would be on the value of transition. This might cut off the electrical system as in real application. To have it, the activation function of machine learning could use either the sigmoid function or tanh function, which would allow similarly.
𝑓(𝑥) = 1
1+𝑒−𝑧 (2)
The sigmoid function is only started at positive input. This is different from the tanh function, which already had values from the negative values. It is all with x as an input of induced voltage and f(x) as the category of leakage current condition.
𝑓(𝑥) = tanh 𝑥 =𝑒𝑥−𝑒−𝑥
𝑒𝑥+𝑒−𝑥 (3)
The dataset being used should be large enough; this might be achieved by recording the leakage current for more than one day. It will provide convergence for big numbers of data. It may be then be used to find patterns of each category. Conversely, if the data is too little, it will cause the system not to study the variation. Preparation of the dataset would be created with the same process of testing data. This makes it a cycle between making a model using the ANN method and using it to predict the real data. We have to divide data into training data and test data in creating independent and dependent variables from the dataset. With the ANN training model, we can build it with three types of layers. They are input, output, and hidden layers. With those layers, we can incorporate the machine learning function with earlier activation functions.
𝑓(𝑥) = 𝐾(∑ 𝑤𝑖 𝑖𝑔𝑖(𝑥)) (4) The input layer is the layer that you will pass through your dataset features. No calculations occur at this layer. This serves to forward the
feature to the hidden layer. The hidden layer is usually the layer between the input layer and the output layer. It can have more than one. These layers perform calculations and pass information to the output layer. Finally, the output layer is the layer of the neural network that will give results. With the correct training of our model, we can get the best threshold voltage for our digital RCCB.
C. Tensor Flow
TensorFlow is an open-source library (open source) for data flow and differentiated programming across various tasks [18]. It could become an interface to express machine learning algorithms and to execute commands using information held about these objects. Tensors are inherently related to vector spaces and their multiple spaces. They can take several different forms, for example, scalar, vector, multiple vectors at a point, or a multi-linear map between vector spaces [19]. This is suitable for applying our model in basic physics and engineering as a kind of a simple tensor [20].
𝑇 = [𝑇(𝑒1) 𝑇(𝑒2) 𝑇(𝑒3)] = [ 𝜎11 𝜎12 𝜎13 𝜎21 𝜎22 𝜎23 𝜎31 𝜎32 𝜎33 ] (5)
Column T is a vector of stresses respectively acting in a cube center corresponding to the orthogonal planes to e1, e2, and e3. Thus, Tensor vector T is formed from each column vector. The application itself could be used with its library, Keras. It will make the program easy to apply using different activation functions in the training phase, as discussed. Once it is trained, the program would be tested. The test itself will try to determine whether the system can recognize the data. The more accurately the system recognizes the target at the testing stage, the more accurate the predicted results. In this study, testing of the electrical leakage current measurement dataset will be performed to see the accuracy of the predictions. The testing phase of the program could use a dataset test part of the data source. In this case, 20% of the entire dataset could be used for testing, and the rest 80% for the training. Along with the training and testing, evaluating the training data results will be done at the data analysis stage. The best probability is to get the threshold point for digital RCCB using this Artificial Neural Network (ANN).
III. R
ESULT ANDD
ISCUSSIONThe application of this machine learning is based on advanced python libraries. Simply by
importing those Libraries, the implementation uses the method or package along with the python programming syntax so that the commands would cover up all difficult mathematical calculations [21]. For example, Panda can consider data suitable for analysis [22]. Then, Numpy has the use of vector and matrix operations. Matpotlib is a python library for creating graphics and plots [23]. Seaborn data visualization is for further data classification based on matplotlib. Python modules help us to do data training with Tensorflow as a framework to help create machine learning.
Figure 3.Hardware
Machine learning applications for IoT-based electric leakage detection can check electric leakage currents that can be known and controlled via smartphones. This tool consists of an RCD circuit that can receive leakage current, connected to a toggle switch as a converter for normal currents and leakage currents. Additionally, this tool is also equipped with a rectifier circuit to read the current value generated by the sensor and the WeMos D1-R2 module. Three Led Lamps have been used for the test. They are 3W, 5W, 9 W.
A. Data Distribution
Total data is 6,040 number of Induced Voltage recorded at the server. The data has been classified into two categories based on its voltage which has been varied between 0.013 - 2.719. The normal condition is with a value closer to zero. Leakage current condition is based on a value closer to the maximum value of 3.3V, limited by the WeMos analog input capability. The data distribution that was carried out in this study was shown in Fig. 4.
Figure 4.Data distribution
The figure shows a wide gap of the distribution between ones close to zero and close to 3.3V. These values, it was then divided into a training dataset and a testing dataset. The training is with a big portion of 80%, which is 4832 from 6040 data. A testing dataset is at 20% of the total, which is 1208. Looking at the voltage range and the watt of Led lamps, it is still possible to visualize all of the data into its categories as in Fig. 5. It is classified with the Load wattage, its residual current classification (either Normal or Leakage Current). The data show further details over Fig. 4.
Figure 5.Data classification
The gap between normal condition and leakage current condition is still dominant. However, the data from the leakage current condition showed that there was a difference between loads. The voltage value was increasing as the wattage of loads increased. They were becoming the maximum value of each load category. Meanwhile, the minimum value from the normal condition has not much difference from each load. From this dataset, we could also find out its middle point’s value. It might be the half difference between the maximum and minimum range. This may be necessary if we saw the probability of its categories intuitively might be ended at the middle point. The normal condition began at 0 and ended at mid-point, and the leakage current condition started from mid-point and ended at maximum voltage as in normal distribution.
Table 1. Statistical data Load (W) Minimum (V) MidPoint (V) Maximum (V) 3 W 0.010 1.095 2.200 5 W 0.024 1.500 3.024 9 W 0.039 1.562 3.162
From the table, we can see once again that values in each category are following the power loads. The increasing load is followed by increased maximum, minimum, and middle values of induction voltage read by our digital RCCB. The mid-point values for all loads from 3W to 9W were all above 1 Volt. Meanwhile, the increments between loads were about 0.23 Volt on average. This could be compared later on with one from machine learning.
B. Threshold Point
The training results can be seen in Fig. 6 as a graph of the loss value from the training and the metric using accuracy, with the limits being loss and accuracy. In the data fitting, we used a batch size of 10 and epochs of 150. Both of them seem to do the same thing for dividing the dataset. The number of epochs is shown at the x-axis of Fig. 6, which controls the number of complete paths for the training dataset.
(a) Loss
(b) Accuracy Figure 6.Learning process
As expected, the loss history showed a degradation during the fitting and went down until 0.0006, negligible. The other way around, for accuracy, it can reach 1 started from zero. This achievement might be possible as the dataset is given a gap between each classification. The range value of the Normal condition and Leakage current were separated with enough gap. Then, the model was tested with 20% of the dataset, which had the same range from a real measurement. There was no artificial measurement used inside the data set. This limitation was intentionally defined in our process of building artificial neural networks for this leakage current value. The gap was the range where we would like to predict using this machine learning. It was possible after getting the trained model from that real dataset.
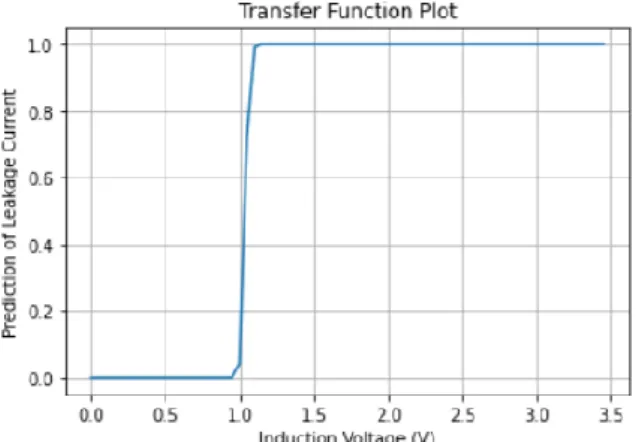
The next step was to use the trained model for classified Normal and Leakage current conditions for untested voltages. Here was where we try to show up the score for all possible input from 0V to 3.5V as the maximum range was 3.3 V. After getting the prediction results of all the input range, it could be seen that the model has an ideal step function as discussed before at Fig. 2. The plot is shown in Fig. 7.
Figure 7.Prediction plot from machine learning model
This curve might be the best approach from a real case. The curve was not perpendicular to the x-axis. A slope in the curve that started from 0.8V with a score of 0.000015 went to score 1 at 1.48V. In other words, it takes about 100% within only a little voltage difference, ?V of 0.68V. The curve showed us the total probability of all conditions, as following:
𝑃 = 𝑃(𝑁𝑜𝑟𝑚𝑎𝑙) + 𝑃(𝑁𝑜𝑟𝑚𝑎𝑙 ∩
𝐿𝑒𝑎𝑘𝑎𝑔𝑒) + 𝑃(𝐿𝑒𝑎𝑘𝑎𝑔𝑒) (6) The conditions might not be only Normal and Leakage Current conditions. In real cases, there was a possibility of the area where the value could be both, Normal or Leakage current condition. However, we want to minimize this
range as it might confuse the system to cut off the electricity. There should be a point where we definitely should classify it as Leakage current condition and immediately shut down the power. C. Cut-Off Comparison
Before comparing the cut-off point, it was necessary to get the idea of the previous real application. To define a specific cut-off point, it is necessary to determine the solution to the uncertainty area. The resolution for the previous intersection of Normal and Leakage Current conditions should be limited to zero. It could be simplified by assuming the occurrence of uncertainty close to zero, as following:
𝑃𝑖𝑑𝑒𝑎𝑙(∆𝑉)−→ lim
∆𝑉→0𝑃 (𝑁𝑜𝑟𝑚𝑎𝑙 ∩
𝐿𝑒𝑎𝑘𝑎𝑔𝑒| ∆𝑉) + 𝑃(𝐿𝑒𝑎𝑘𝑎𝑔𝑒) (7) That probability could go to zero if we follow the normal distribution where the maximum normally was at the midpoint. The machine learning process result could be seen in Fig. 7, but it was shifting a bit following the load. By looking at the limit value from each prediction curve, we could define it similarly as above with a score limit to 50% as in mid-point as in Table 1. There a threshold voltage as a cut-off point could be then defined as follows:
𝑉𝑇ℎ𝑟𝑒𝑠ℎ𝑜𝑙𝑑 ↔ lim
𝑠𝑐𝑜𝑟𝑒→50%+𝑓𝑠𝑐𝑜𝑟𝑒(𝑉) (8) The fscore would be from the machine learning
process. Then, by following the prediction from the trained model, it was possible to get the score for the threshold voltage. The previous data with three different loads were used to find out all threshold points from each load. Table 2 showed the value for each different load from our test. The threshold values of this table were compared to Mid Point values of Table 1. The differences were listed as gap values.
Table 2. Result statistics
Load Threshold Score Gap
3 W 0.981 V 50.09 % 0.11 V
5 W 0.996 V 50.01 % 0.50 V
9 W 1.032 V 50.00 % 0.53 V
Looking at the table, we could see that the threshold was increasing to follow the loads. The description was showing the brand and type of led lamps which has been used for the test. We used random lamps from the market with a specification of the wattage. From this result, we could see that the threshold was not always at midpoints, as already carefully noted in Table 1. There was a little bit of shift for each load as the
scope of this work. The maximum value of the gap was at 0.53 V. This is around 16.97% compared with its range from Min to Max values. Then, for the increments between load, there was only about 0.025 Volt on average. It showed us that the limit should be better on using machine learning, and it is accidentally similar to the gap measurement of 1V as in [4].
IV. C
ONCLUSIONThe machine learning process was used for this possible digital RCCB. The value of the threshold point was found around 1V. In a comparison of the mid-point from the measured voltage range, which was 0.013-2.719V. The result has a gap around 0.5V to possible its middle voltage around 1.5 V. Looking at the probability of real cases, the machine learning model had shown the better transfer function as scientific novelty where there was a possibility of the intersection of Normal and Leakage current conditions. However, to define the threshold point to cut off electricity, we should limit its probability. Here, this machine learning technique showed us the possibility to fit with different loads.
A
CKNOWLEDGMENTThis work was funded by Universitas Airlangga under a research fund of Riset Kolaborasi Mitra Luar Negeri (RKLMN) 2020. The research was started by Hammam Abror Ali under the supervision of Erwin Sutanto in Universitas Airlangga. This article was then finalized and written by Erwin and supported by Yhosep Gita Yhun Yhuwana. Finally, the overall system was reviewed and supervised by Muhammad Aziz as an expert from the University of Tokyo.
R
EFERENCES[1]
INTERNATIONAL
ELECTRICAL
COMMISSION. (2005) IEC 60364-4-41.
Low Voltage Electrical Installations. Part
4-41: Protection for safety protection against
electric shock. International Standard.
[2]
DWARKA PRASAD, A. K. S. and
SHARMA, H. (2010) Electric shock and
human body. International Journal of
Electrical and Power Engineering, 4(3), pp.
177–181.
[3]
WEBSTER,
J.
(2009)
Medical
instrumentation: application and design. John
[4]
SUTANTO, E., AIN, K., AZIZ, M. and
ESCRIVA´-ESCRIVA´, G. (2019) A study
on dc limit parameters in rcd operation using
capacitor. Journal of Engineering Science
and Technology Review, 12(4), pp. 7–14.
[5]
KROGH, A. (2008) What are artificial
neural networks. Nature Biotechnology,
26(2), pp. 195–197.
[6]
ASHTON, K. et al. (2009) That
“Internet of Things” thing. RFID Journal,
22(7), pp. 97–114.
[7]
SHANTHAMALLU, U. S., SPANIAS,
A.
TEPEDELENLIOGLU,
C.
and
STANLEY, M. (2017) A brief survey of
machine learning methods and their sensor
and iot applications. In: Proceedings of the
8th International Conference on Information,
Intelligence, Systems & Applications (IISA),
Larnaca,
Cyprus,
2017,
pp.
1-8,
https://doi.org/10.1109/IISA.2017.8316459.
[8]
ESCRIVA´-ESCRIVA´, G., PORTA, C.
R. and DE JONG, E. C. (2016) Nuisance
tripping of residual current circuit breakers in
circuits supplying electronic loads. Electric
Power Systems Research, 131, pp. 139–146.
https://doi.org/10.1016/j.epsr.2015.10.012
[9]LIEW, A. (1990) Nuisance trippings of
residual current circuit breakers or ground
fault protectors of power sources connected
to computer and electronic loads. Electric
power systems research, 20(1), pp. 23– 30.
[10]
SHOPOV,
Y.
FILIPOVA-PETRAKIEVA, S. and BOYCHEV, B.
(2018) Investigation of residual current
devices in high frequencies. Proceedings of
the 10th Electrical Engineering Faculty
Conference (BulEF), Sozopol, Bulgaria,
2018,
pp.
1-3,
https://doi.org/10.1109/BULEF.2018.864694
5.
[11]
DURANI, H. SHETH, M. VAGHASIA,
M. and KOTECH, S. (2018) Smart
automated home application using iot with
blynk app. Proceedings of the Second Inter-
national
Conference
on
Inventive
Communication
and
Computational
Technologies (ICICCT), pp. 393–397, IEEE.
[12]
DABOUL, S., HELD, S., VYGEN, J.,
and WITTKE, S. (2018) An approximation
algorithm for threshold voltage optimization.
ACM Transactions on Design Automation of
Electronic Systems (TODAES), 23(6), pp.
1-16.
[13]
PERDANA, D., RENALDI, L., and
ALINURSAFA, I. (2020) Performance
Analysis of Soil Moisture Monitoring based
on
Internet
of
Things
with
LoRA
Communications. Journal of Southwest
Jiaotong
University,
55(5),
pp.
1-9,
https://doi.org/10.35741/issn.0258-2724.55.5.31
[14]
SENEVIRATNE, P. (2018) Hands-On
Internet of Things with Blynk: Build on the
power of Blynk to configure smart devices
and build exciting IOT projects. Packt
Publishing Ltd.
[15]
RILATUPA, J., & MANGANI, K. S.
(2020) Forensic Analysis
of Cultural
Heritage building Maintenance. Journal of
Southwest Jiaotong University, 55(4), pp. 1-9,
https://doi.org/10.35741/issn.0258-2724.55.4.42
[16]
SUTANTO, E., SUPADI, A., and
RUSYDI, F. (2017) Permeability analysis of
fe2o3 magnetic core. Proceedings of the 5th
International Conference on Instrumentation,
Communications, Information Technology,
and Biomedical Engineering (ICICI-BME),
Bandung,
Indonesia,
pp.
81-84,
https://doi.org/10.1109/ICICI-BME.2017.8537737.
[17]
KODALI, R. K., and SAHU, A. (2016)
An IoT based weather information prototype
using wemos. Proceedings of the 2nd
International Conference on Contemporary
Computing and Informatics (IC3I), Noida,
2016,
pp.
612-616,
https://doi.org/10.1109/IC3I.2016.7918036.
[18]SHUKLA, N. (2018) Machine learning
with TensorFlow. Manning Publications Co.
[19]GE´RON, A. (2019) Hands-on machine
learning with Scikit-Learn, Keras, and
TensorFlow: Concepts, tools, and techniques
to build intelligent systems. O’Reilly Media.
[20]ABADI, M., BARHAM, P., CHEN, J.,
CHEN, Z., et al. (2016) Tensorflow: A
system for large-scale machine learning.
Proceedings of the 12th USENIX symposium
on
operating
systems
design
and
implementation (OSDI 16), Savannah, GA,
USA, pp. 265-283.
[21]
NELLI,
F.
(2018)
Python
data
analytics:
with
pandas,
numpy,
and
matplotlib. Apress.
[22]
MCKINNEY, W., et al. (2011) Pandas:
a foundational python library for data
analysis and statistics. Python for High
Performance and Scientific Computing,
14(9).
https://www.dlr.de/sc/en/Portaldata/15/Resou
rces/dokumente/pyhpc2011/submissions/pyh
pc2011_submission_9.pdf
[23]