One-dimensional migration of interstitial
clusters in SUS316L and its model alloys under
electron irradiation
著者
Satoh Y., Abe H., Kim S.
journal or
publication title
Philosophical Magazine
volume
92
number
9
page range
1129-1148
year
2012-01-03
URL
http://hdl.handle.net/10097/63879
doi: 10.1080/14786435.2011.642318This is an Accepted Manuscript of an article published by Taylor & Francis Group in Philosophical Magazine on 03/01/2012, available online:
http://www.tandfonline.com/10.1080/14786435.2011.642318.
Philosophical Magazine, 92 (2012) pp.1129–1148
One-dimensional migration of interstitial clusters in SUS316L and its model alloys under electron irradiation
Y. Satoh, H. Abe, S. Kim
Institute for Materials Research, Tohoku University, Sendai, Japan
Abstract
The one-dimensional (1D) migration of interstitial clusters in austenitic stainless steel SUS316L and its model alloys, namely, Fe-18Cr-13Ni, Fe-18Cr-13Ni-0.012C, and Fe-18Cr-13Ni-1.7Mn (mass %), was examined using in situ observation by high-voltage electron microscopy. Such 1D migration was confirmed to occur along the <110> direction at irregular intervals in all these alloys under 1250 kV electron irradiation at room temperature. The frequency of 1D migration was found proportional to electron beam intensity, and was about 1/10 that in high-purity iron under the same irradiation intensity. The distance of 1D migration in the four alloys was less than 10 nm, which was much shorter than that in high-purity iron. No clear difference in the frequency or distance of 1D migration was observed among the four alloys, suggesting that minor solute/impurity elements have no apparent effect on 1D migration in SUS316L.
1. Introduction
Recent theoretical and experimental studies have shown that interstitial clusters migrate one-dimensionally along the Burgers vector with low activation energy in pure metals [1-11]. This one-dimensional (1D) migration has been suggested to affect defect structural development induced by irradiation with high-energy particles
[5,12-14]. Therefore, this phenomenon is considered to be practically important for developing materials for nuclear power applications. 1D migration of interstitial clusters is often observed under electron irradiation, as determined using in situ observation by high-voltage electron microscopy (HVEM) [5,6,10,11,15-17]. HVEM is an efficient experimental technique for investigating basic 1D migration processes. However, the electron irradiation conditions do not correspond to the environmental conditions in which nuclear materials are used.
Impurity atoms are considered to play a vital role in 1D migration processes in iron under electron irradiation [10,11]. In more detail, 1) interstitial clusters are fundamentally mobile at low activation energy, but are usually in a stationary state, being trapped as a result of elastic interactions with impurity atoms. After detrapping from the impurity atoms, they induce free 1D migration until they are trapped again by other impurity atoms. 2) The distance of 1D migration corresponds to the free path of interstitial clusters migrating through randomly distributed impurity atoms, suggesting that certain impurity atoms act as obstacles to the 1D migration of interstitial clusters. 3) The frequency of 1D migration is proportional to electron beam intensity, suggesting that irradiation with fast electrons sets clusters free from impurity atoms and initiates 1D migration.
The 1D migration process of interstitial clusters in practical alloys containing both substitutional and interstitial solute/impurity elements at high concentration is of technical and fundamental importance. Considering the suppression of 1D migration due to trace impurity atoms in iron [10,11], one might expect that 1D migration hardly occurs in concentrated alloys. However, in situ observation by HVEM has already shown that 1D migration occurs in V-Ti alloy [6], Fe-Cr alloy [15], Fe-Cu and Fe-Si alloys [17], and A533B steel [16] used for pressure vessels in nuclear power reactors. The physical significance of the frequency and distance of the 1D migration observed in these alloys are not well understood. Further experimental examination of 1D migration in concentrated alloys under systematically varied conditions is expected to contribute to
understanding of basic 1D migration processes.
The present study surveyed the 1D migration process in austenitic stainless steel SUS316L and its model alloys using in situ observation by HVEM. The primary motivation for this work was to compare 1D migration processes in concentrated alloys directly with those in iron by using the same experimental analysis. The selection of SUS316L had two considerations: the technical importance of this material owing to its wide application in nuclear power plants, and the limited experimental results that have been reported on 1D migration processes in fcc metals. In fcc metals, self-interstitial atoms aggregate to form perfect dislocation loops (b=a/2<110>) or faulted dislocation loops (b=a/3<111>). The latter have stacking faults on the loop plane, which prohibit the glide motion of interstitial clusters; the former induce 1D migration along the Burgers vector, namely, the <110> direction [5].
In this paper, the dynamic behavior of interstitial clusters under high-energy electron irradiation was described first, followed by a detailed examination of the features of 1D migration processes in SUS316L: the orientation of 1D migration, the irradiation intensity dependence of 1D migration distance and frequency, and the cluster size dependence of 1D migration. Finally, 1D migration processes were compared
among SUS316L and its model alloys, namely, Fe-Cr-Ni, Fe-Cr-Ni-C, and Fe-Cr-Ni-Mn, to examine the effects of interstitial and substitutional solute atoms on 1D migration processes in SUS316L.
The aim of this study was to contribute to the elucidation and modeling of 1D migration processes of interstitial clusters in practical alloys. The findings of this study are expected to contribute to a more precise understanding of microstructural evolution upon energetic particle irradiation.
2. Experimental procedure
The specimens used in the present experiments were commercially obtained SUS316L (Nilaco Co.) and its model alloys, namely, Fe-18Cr-13Ni,
Fe-18Cr-13Ni-0.012C, and Fe-18Cr-13Ni-1.7Mn (mass %). The solute concentration of each model alloy was chosen so as to correspond to that of SUS316L. Because 1D migration in iron strongly depends on the impurity level of the specimen [10, 11], attention was paid to impurities in the present experiments. The model alloys were prepared by arc-melting of constituents having nominal purities exceeding 99.99%.
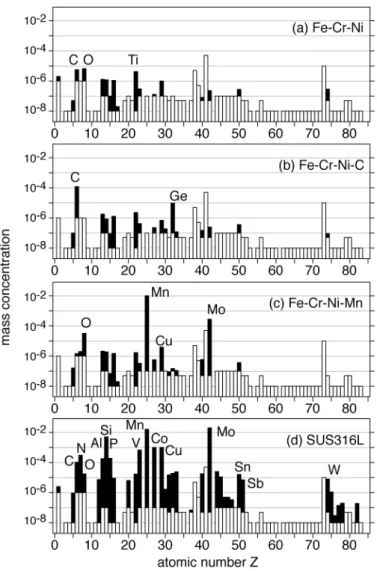
Figure 1 shows the results of the solute/impurity analysis of the specimens. The white bars show the lower detection limits, and the shaded bars on the white bars show the analytical results. The amounts of carbon and oxygen were determined by the infrared absorption method, and those of hydrogen and nitrogen by the thermal
conductivity method. The other elements shown in Figure 1 were analyzed by glow discharge mass spectrometry (GDMS).
The Fe-18Cr-13Ni alloy with lower impurity concentration was prepared as follows. The arc-melting of iron, chromium, and nickel of about 30 g in total resulted in Fe-18Cr-13Ni containing ~35 ppm oxygen by mass and ~2 ppm carbon. The addition of a small amount of the base alloy Fe-3.9C (mass %) to the three constituents during arc-melting reduced the oxygen concentration, as is shown in Figure 2. As the amount of the base alloy was increased, the oxygen concentration decreased to less than 10 mass ppm and then the carbon concentration increased. Carbon and oxygen atoms were thought to react with each other and to be eliminated from the specimen during the arc-melting. The addition of appropriate amount of Fe-3.9C minimized the
concentrations of both oxygen and carbon in Fe-18Cr-13Ni. There was no impurity element exceeding 10 mass ppm in this alloy, as shown in Figure 1.
Specimens for HVEM were prepared as follows. Block specimens were cut from button-shaped model alloys prepared by arc-melting, and then cold-rolled to 0.12 mm thickness. The as-received specimen of the SUS316L sheet was 0.12 mm thick. Disc specimens of 3 mm in diameter were punched from these sheets. Each disc specimen was wrapped in tantalum foil and annealed in a quartz glass tube for 3 h at 1327 K in a vacuum of about 10-4 Pa.
Thin foil specimens for electron microscopy were prepared by
electropolishing in two steps: twin-jet polishing in a solution of CH3COOH:HClO4 (19:1) at room temperature at a voltage of 50V, and final polishing in H2O:H2SO4:H3PO4 (3:3:4) at room temperature at a voltage of 7V.
The electron irradiation and in situ observation were performed with an HVEM JEMARM-1250 (JEOL Ltd.) at Tohoku University. The acceleration voltage was 1250 kV and the maximum beam intensity was 15 x 1024
e m-2 s-1
. The electron beam current was measured by a Faraday cup before and after individual experimental runs. The maximum damage rate was about 0.03 dpa s-1
, determined using the atomic scattering cross section for iron and 40 eV as the threshold energy for atomic
displacement (Ed). The irradiation and observation were performed at room temperature. The in situ observation was made using bright-field images with exciting 002 systematic reflections. The direction of observation was 5-15 deg from <110> to <100> unless specifically noted otherwise. Irradiation and observation were performed on
wedge-shaped specimens of about 50-100 nm in thickness. Images on the fluorescent screen were recorded using a CCD camera through the viewing window of the HVEM at 30 frames per second. The recorded area was 267 nm x 137 nm at a magnification factor of 1 x 10⁵
; the pixel size was 0.37 nm. The behavior of individual defect clusters was analyzed frame by frame after irradiation. The smallest limit of the interstitial clusters observed was 2-3 nm under the present experimental conditions. Defect clusters were also observed by conventional 200 kV TEM (JEM-2010, JEOL Ltd.) after electron irradiation. The number density of defect clusters was estimated from the specimen thickness that was determined by equal thickness fringes. Extinction distances for 002 reflection were 52.6 nm and 38.5 nm with 1250 kV and 200 kV electrons, respectively.
3. Experimental results
3.1. Defect clusters induced by electron irradiation
The number density of interstitial clusters in all the alloys increased with irradiation time in an early stage of electron irradiation and then saturated on the order of 1023
m-3
, which is consistent with a previous report [18]. In situ observation started with the start of electron irradiation and ended when it became difficult to detect individual 1D migration processes because of the mutual overlapping of defect images. The period of the in situ observation ranged from 100 s to 800 s depending on irradiation intensity, and all the results presented in the following sections were within the early stage of irradiation where the number density of clusters increased with irradiation time.
Electron irradiation of metals often induces vacancy clusters in addition to interstitial clusters. At relatively low temperatures where the thermal migration of vacancies is not very extensive, vacancies are continuously accumlated with the
irradiation time, resulting in the formation of stacking fault tetrahedra (SFTs) in various fcc metals [19-21]. In the present experiments, in addition to interstitial clusters, small defect clusters were observed by the weak-beam dark-field technique using 200 kV TEM after electron irradiation, as shown in Figure 3. In the model alloys, most of these
small fraction had a triangular contrast in SUS316L. It is intersting to note that SFTs are hardly observed in commercial stainless steels also under cascade damage conditions [22,23]. The number density of these small defect clusters was several times that of interstitial clusters and almost reached 1024
m-3
. Note that images of small grains of the oxide layer covering the specimen surfaces [24] and those of surface contaminants sometimes resembled images of very small defect clusters. In the following sections, 1D migration processes were examined on bright-field images under dynamical condition. In the early stage of electron irradiation, small vacancy clusters shown in Figure 3 were not visible under dynamical condition; we regarded all the clusters appeared with clear contrast to be of interstitial type.
3.2. Dynamic behavior of interstitial clusters
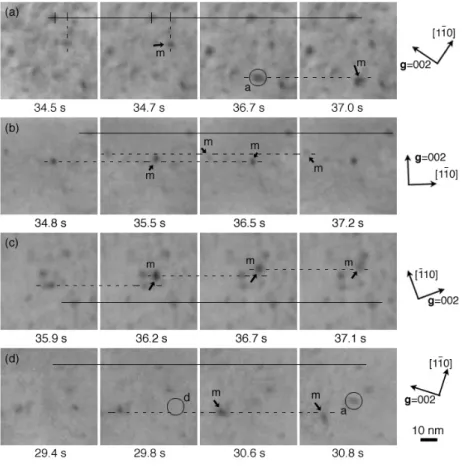
Figure 4 shows the typical dynamic behavior of interstitial clusters in SUS316L and the model alloys under electron irradiation. Interstitial clusters were confirmed to induce intermittent 1D migration at irregular timings in all the specimens examined. In the figure, the clusters that induced 1D migration are labeled “m”, with arrows indicating the direction of migration. The additional lines in the figure are helpful because the distance of most of the 1D migration processes is short and comparable to the size of cluster images; the solid and broken lines are respectively for stationary clusters and clusters inducing 1D migration.
A typical 1D migration was stepwise positional changes that completed almost within the time interval of the video frames, which was also observed in iron and referred to as “1D jumps” in previous reports [10,11]. In addition, we observed a rather slow migration in which the trajectory of the clusters can be traced at the present time resolution; the total time spent for each slow migration was less than a few seconds in most cases. In this paper, a single 1D migration event was defined as a sequence from one stationary state to another through 1D migration, irrespective of the time spent for the 1D migration. Similarly, 1D migration distance was defined as the distance between two stationary points. Successive 1D migration processes, namely, a set of 1D migration processes occurring at intervals of a few seconds in the same or opposite directions, were frequently observed, as shown in Figures 4c and 4b, respectively.
Another dynamic behavior that we frequently observed was the sudden appearance and disappearance of cluster images, respectively indicated as “a” and “d” in
the figure. This sudden appearance and disappearance are also observed in iron [10]. The sudden disappearance in iron was attributed to (1) the 1D migration of clusters from the recording area to a point outside this area, (2) the 1D migration or growth of clusters reaching the specimen surface for annihilation, (3) 1D migration into a place where the cluster is hidden by geometrical overlapping with other clusters, and (4) changes in the Burgers vector of clusters from a condition visible by TEM to an invisible condition (i.e.,
g · b = 0). The reversed processes of these respective items, except the second item, are considered to be responsible for the sudden appearance of cluster images.
In the present alloys, however, the first and second items listed above were not considered as major mechanisms for the sudden disappearance of cluster images because the 1D migration distance was much less than the specimen thickness. Instead, changes in the nature of clusters (e.g., the fourth item) were considered responsible for the sudden appearance and disappearance for the following reasons: (1) close
observation sometimes revealed that a certain faint contrast remained at the same position after the sudden disappearance of the cluster, and vice versa. (2) Sometimes cluster images changed their contrast drastically without disappearing. (3) Clusters could change the direction of 1D migration under observation, though in very rare cases.
In the following sections, the sudden appearance and disappearance of cluster images were not counted as a 1D migration event. Also, this paper did not go into the details of the sudden appearance or disappearance, which will be the subject of further study. Finally, note that the dynamic behavior of interstitial clusters described above showed no substantial difference among the four specimens examined.
3.3. Orientation of 1D migration
To examine the crystallographic orientation of the direction of 1D migration, the center of mass of a cluster image was identified by the naked eye, and its position was measured before and after the 1D migration. Figure 5 shows a plot of the
displacement due to 1D migration of clusters that were observed along two typical directions, near <110> and <100> directions. The broken lines in the figure show the projection of the <110> direction. The measured displacements are thought to have considerable errors especially when the 1D migration distance is less than the cluster image size. However, the figure shows a relatively long 1D migration along the <110> direction, the closest packing orientation of atoms. Moreover, it shows no 1D migration
along the <110> direction perpendicular to the diffraction vector g. This is because the clusters have the Burgers vector b perpendicular to g, resulting in them being out of contrast in TEM. In the following sections, 1D migration distances were converted from the projected displacements, assuming that all the 1D migration processes are along the <110> direction.
Further investigation with application of the g · b= 0 invisibility criterion is needed to determine the nature of these small interstitial clusters after electron
irradiation. This will be related to the possibility of dynamic changes in the Burgers vectors suggested in Sec. 3.2.
3.4. Variation in 1D migration frequency with irradiation intensity
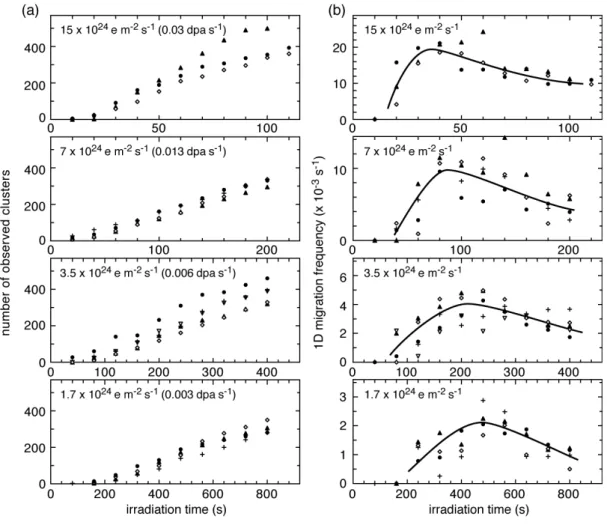
As a measure of the incidence of 1D migration, 1D migration frequency was defined as the average number of 1D migration events observed per single cluster during a unit time. 1D migration frequency was estimated from the total count of 1D migration events during a certain period (i.e., 10-80 s) and the number of defect clusters observed at the central time of the period. Figure 6a shows the variations in the number of observed defect clusters and the frequency of 1D migration as functions of irradiation time under four different irradiation intensities. During the in situ observation under respective irradiation intensities, the number of observed clusters continued to increase with irradiation time. Note that the difference in the number of observed clusters among the experimental runs performed at the same irradiation intensity partly resulted from the difference in specimen thickness between the observed areas.
Figure 6b shows that 1D migration frequency was scattered considerably among the experimental runs at the same irradiation intensity. It can be observed that 1D migration frequency increased with irradiation time in the initial stage and then
decreased to about half of the peak frequency. The irradiation time giving the peak frequency increased with decreasing irradiation intensity.
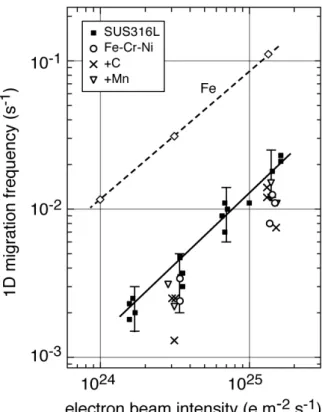
Figure 7 shows the peak frequency of 1D migration plotted against irradiation intensity. The figure shows that the peak frequency was almost proportional to beam intensity. In high-purity iron [10], a similar irradiation intensity dependence has been observed, and the absolute frequency is found to be about one order of magnitude higher than that in SUS316L.
3.5. Irradiation intensity dependence of 1D migration distance
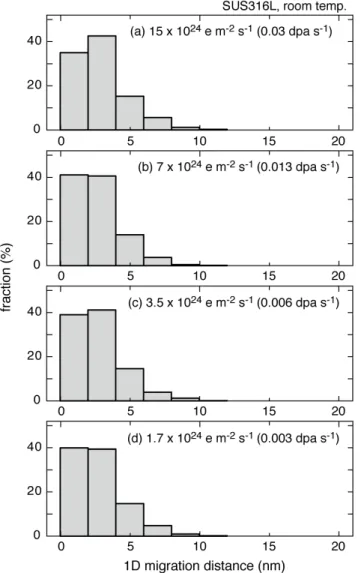
Figure 8 shows that there is no clear difference in the distribution of 1D migration distance in SUS316L among the four irradiation intensities examined. The fraction of 1D migration events decreased almost monotonically with increasing 1D migration distance, and the distance hardly exceeded 10 nm. The 1D migration distance was much shorter than that observed in high-purity iron in which longer 1D migration exceeds 100 nm [10]. An increase in electron irradiation intensity was found to increase 1D migration frequency without affecting 1D migration distance.
We note that a part of the 1D migration the distance of which was less than 2 nm was not detected owing to the spatial resolution in the present experimental
procedure. In addition, as has been noted in Section 3.3, the measured distance of 1D migration had considerable errors when the 1D migration distance was less than the cluster image size. The comparison of the 1D migration is thought to be meaningful in longer range of the distribution.
3.6. Cluster size dependence of 1D migration
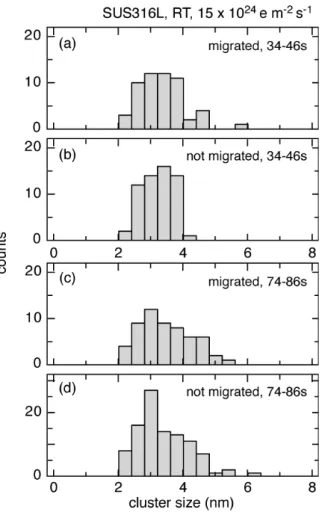
Figures 9a and 9b are size distributions of the interstitial clusters that induced 1D migration during a period 34-46 s from the start of electron irradiation and that did not induce 1D migration during the period, respectively. Both major and minor sizes of a cluster image were measured at the central time of the period (i.e., at 40 s), and their average was assigned as the cluster size in the figure. No clear difference is
observed between the two distributions, suggesting that the initiation of 1D migration did not depend strongly on the cluster size. Figures 9c and 9d show the similar tendency after irradiation for 80 s.
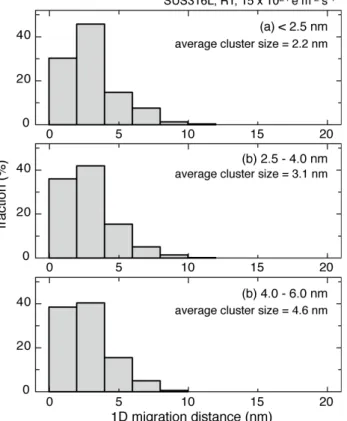
Next a relationship between 1D migration distance and cluster size was examined. The distribution of 1D migration distance shown in Figure 8a was
decomposed into Figures 10a – 10c according to cluster size; individual 1D migration events in Figure 8a were divided into three groups according to cluster size, and for each group the distribution of 1D migration distance is shown in Figure 10. The size boundary was arbitrary and was taken to be 2.5, 4.0 nm, and 6.0 nm, so that each group contained a sufficient number of 1D migration events. In this analysis, the size of interstitial clusters was measured when the clusters induced 1D migration. The TEM image size of the cluster was measured along the direction approximately perpendicular to the 1D
migration direction; the size corresponds to the diameter of the clusters projecting along the direction of 1D migration. No clear difference is observed in the distribution of the 1D migration distance among three ranges in the cluster size, suggesting that also the distance of 1D migration did not depend on the cluster size.
3.7. Effects of minor elements on 1D migration behavior
In this section, the effects of minor elements on 1D migration in SUS316L were examined by comparing the frequency and the distance of 1D migration among SUS316L and its model alloys. Figure 11 shows a comparison of the variations in the number of observed defect clusters and 1D migration frequency in the model alloys at the maximum irradiation intensity used in the present experiments. The figure shows that the number of observed clusters increased with irradiation time, and that the frequency of 1D migration peaked in the early stage of irradiation and then decreased. These results are to be compared directly with those of SUS316L shown in the top row of Figures 6a and 6b. The peak frequency of the model alloys is plotted in Figure 7 for two irradiation intensities. The 1D migration frequencies of the three model alloys exhibited no clear difference from each other, and were slightly lower than that of SUS316L.
Figure 12 compares the distribution of 1D migration distance among the three model alloys under the maximum irradiation intensity used in the present experiments. The occurrence of 1D migration decreases monotonically with increasing 1D migration distance, and was mostly observed at a distance shorter than 10 nm. When the results are compared with that of SUS316L shown in the top row of Figure 8, no clear difference is again observed in the distribution of 1D migration distance among all the alloys. These results suggest that minor solute/impurity elements are not responsible for the 1D migration of longer distance in SUS316L under the present experimental conditions.
4. Discussion
4.1. Summary of experimental results
We summarize briefly the above experimental results. 1) 1D migration was confirmed to occur in SUS316L under electron irradiation at room temperature. 2) Most 1D migration processes appeared as stepwise positional changes at irregular intervals. 3) 1D migration of long distances occurred along the <110> direction. 4) The occurrence of 1D migration decreased with increasing 1D migration distance, and the 1D migration
distance hardly exceeded 10 nm. 4) Increasing irradiation intensity proportionally increased 1D migration frequency without affecting 1D migration distance. 5) The occurrence and distance of 1D migration showed no clear dependence on the size of interstitial clusters. 6) No considerable difference was observed in the distance or frequency of 1D migration among SUS316L and its model alloys including Fe-Cr-Ni alloy with reduced impurities.
Accordingly, it is likely that the frequency and distance of 1D migration in SUS316L are almost independent of irradiation intensity, cluster size, and minor
solute/impurity elements within the scope of the present experiment conditions. Only the exception is that 1D migration frequency is proportional to irradiation beam intensity.
4.2. Distance of 1D migration
In high-purity iron, 1D migration distance is described by the free path of interstitial clusters [10,11]. In fact, 1) 1D migration distance follows the geometrical distribution expected for the free path of interstitial clusters migrating in one direction among impurity atoms of random distribution. In addition, 2) interstitial clusters of smaller size in iron of higher purity tend to have a longer 1D migration distance. The latter is reasonable because the interaction between smaller interstitial clusters and impurity atoms at lower concentrations is less likely and results in a longer free path.
We estimate the free path of interstitial clusters at higher solute/impurity concentrations, taking an interstitial cluster of 4 nm diameter as an example, which is typically observed in the present HVEM experiments. The cluster is thought to exhibit elastic interaction with solute/impurity atoms within a certain interaction volume around the cluster whose cross section roughly consists of 100 atoms [10]. Thus, the interstitial cluster would have a mean free path of about 25 nm (100b) and 2.5 nm (10b) in iron containing impurity atoms at 100 appm and 1000 appm (i.e., 0.1 at.%), respectively. In concentrated alloys containing solute/impurity atoms over 1 at.%, the interaction volume always contains one or more solute atoms on average, and the interstitial cluster has no effective free path.
By analogy to the model for iron, one might expect a simple interpretation that certain minor elements at a low concentration in SUS316L strongly interact with interstitial clusters, and that the free path among these minor elements gives the 1D migration distance. However, the following two features in terms of 1D migration
distance in SUS316L did not seem to support the simple interpretation: 1) There was no clear difference in 1D migration distance between SUS316L and its model alloys with low impurity levels (see Figures 8a and 12). Accordingly, the 1D migration distance in SUS316L comes from the effects of the basic ternary alloy system rather than of the minor solute/impurity elements. 2) 1D migration distance did not depend apparently on the size of interstitial clusters (see Figure 10). This is in contrast to iron in which
interstitial clusters of smaller size tend to have a longer 1D migration distance [11]. One might attribute the independence of 1D migration distance in SUS316L to narrow size distribution of interstitial clusters. In fact, size of interstitial clusters observed in the present experiments (see Figure 9), as compared with that for iron [11], had narrower distribution probably due to lower growth rate of clusters. But average cluster size in Figure 10c was about two times as large as that in Figure 10a; the 1D migration distance of the two cases would be considerably different from each other if the 1D migration distance represents a free path among certain minor elements. We may note, in passing, that the experimental 1D migration distance was so short in SUS316L that it could not be determined whether the distance follows a geometrical distribution (see Figures 8 and 12).
Figure 3 shows that vacancies were accumlated with irradiation time to form vacancy clusters at the maximum irradiation intensity in the present experiments. Basically, vacancies and their clusters are possible to affect 1D migration of interstitial clusters; for example, 1D migration might be reduced through the elastic interactions between interstitial cluster and vacancies/vacancy clusters. But the effect of vacancies on the 1D migration distance is thought to be negligible as compared to that of major solute atoms in the present experimental condition. Figure 8 reveals that the distribution of 1D migration distance did not change when the irradiation intensity varied by an order of magnitude; while the vacancy concentration under electron irradiation is in proportion to the square root of the irradiation intensity according to a simple reaction rate analysis [18]. We note that the effect of vacancies on 1D migration is not detected also in iron [11].
The 1D migration distance in other concentrated alloys under electron irradiation has been reported for V-5Ti (at.%) [6] and A533B steel [16]. The 1D migration distance in V-5Ti is shorter than 8 nm, while that in high-purity vanadium extends up to 45 nm [25]. Moreover, in A533B, the distances of most 1D migration
events are shorter than 10 nm. The fraction of 1D migration events monotonically decreases with increasing 1D migration distance in both alloys. The distributions of 1D migration distance in SUS316L and its model alloys were quite similar to those in V-5Ti and A533B. Therefore, there may be a common mechanism for the distribution of 1D migration distance in these concentrated alloys. Moreover, the essential part of the mechanism seems to be related to basic binary or ternary alloy systems rather than to minor solute/impurity elements, as has been suggested also in ref. [6].
4.3. 1D migration frequency
In iron, 1D migration frequency is almost proportional to electron irradiation intensity. A simple model has been proposed for the initiation of 1D migration in high-purity iron as follows [10]. An individual interstitial cluster is considered to be trapped by a single impurity atom in high-purity iron. The impact of an incident electron to an impurity atom or a host atom in the vicinity displaces the impurity atom to a location distant from the interstitial cluster, and sets the cluster free from the elastic interaction with the impurity atom (i.e., detrapping from the impurity atom).
Also, in SUS316L and its model alloys, 1D migration frequency is
proportional to irradiation intensity. This means that electron irradiation directly affects the initiation of 1D migration. Analogous to the model for iron, the atomic displacement caused by electron irradiation is thought to lead to the 1D migration of interstitial clusters in concentrated alloys. Figure 7 shows that the 1D migration frequency in SUS316L was about one order of magnitude lower than that in high-purity iron at the same electron beam intensity. Also, note that the difference in the frequency was smaller when the frequency was expressed in terms of the displacement per atom: the 1D
migration frequency corresponds to 1 and 0.6 migration/dpa in high-purity iron (Ed = 20 eV) and SUS316L (Ed = 40 eV), respectively.
One possible reason for the difference in 1D migration frequency between iron and SUS316L is the atoms interacting with interstitial clusters. The major impurities in high-purity iron are light atoms, such as carbon, oxygen, and nitrogen. In contrast, the experimental results suggest that the major alloying elements, that is, nickel and
chromium, are responsible for the apparent 1D migration processes in SUS316L. Interstitial impurity atoms are considered to have a larger cross section for atomic displacement by electron irradiation than major solute atoms in SUS316L. In addition,
because an interstitial cluster in SUS316L always interacts with multiple solute atoms, a large number of atomic displacements may be necessary to induce 1D migration. It has been reported that the frequencies of 1D migration in V-5Ti [6] and A533B [16] are lower than those in pure vanadium and iron, respectively.
4.4. Tentative model of 1D migration in concentrated alloys
We propose a tentative model of 1D migration processes of interstitial clusters in concentrated alloys under electron irradiation. Interstitial clusters are in a stationary state in concentrated alloys, owing to the fluctuation in the local distribution of solute atoms; that is, interstitial clusters are stable at a position where the formation energy of the clusters achieves a local minimum on their respective 1D migration tracks. The distribution of solute atoms is expected to change continuously from one random distribution to another (both are equivalent to each other) under electron irradiation because of atomic displacement and the following recovery of produced Frenkel pairs. This can be a type of mixing effect of solute atoms. The mixing changes the stable position of the cluster on its 1D migration track, and the clusters induce 1D migration into a new stable position. The applicability of the present rough model is under examination using atomistic simulations for binary alloys.
4.5. Effects of minor elements
Although no effects of minor solute/impurity elements on 1D migration processes were observed in the present experiments, such effects may appear at higher temperatures. It has been reported that the 1D migration frequency in A533B was much lower under irradiation at elevated temperatures than at room temperature [16]. Another considerable decrease in such frequency occurs at room temperature after interstitial clusters are heat-treated at high temperatures. It has been proposed that such decreases in 1D migration frequency are due to the segregation of solute/impurity atoms into
interstitial clusters at elevated temperatures [16]. According to this interpretation,
electron irradiation at room temperature does not induce serious segregation to constrain interstitial clusters in SUS316L as well as in A533B. This is consistent with the
suggestion that interstitial atoms as well as vacancies are thermally immobile at room temperature even in Fe-Cr-Ni alloy [18]. At higher temperatures where point defects and interstitial impurities are thermally mobile, the segregation of minor solute/impurity
elements will occur and may result in different 1D migration behaviors among SUS316L and its model alloys. In the future, it is worthwhile to examine the 1D migration
behavior at elevated temperatures and the effects of heat treatment on 1D migration in SUS316L and its model alloys.
5. Conclusions
The 1D migration of interstitial clusters was confirmed to occur in SUS316L under electron irradiation at room temperature. Most 1D migration processes appeared as stepwise positional changes along the <110> direction at irregular intervals. The distance of 1D migration was less than 10 nm, which was much shorter than that observed in high-purity iron. The distribution of 1D migration distance did not depend on minor solute/impurity elements or the size of interstitial clusters. 1D migration distance could not be explained using a free path of interstitial clusters among certain minor elements, but was shown to represent the effect of major solute elements.
Increasing irradiation intensity increased 1D migration frequency proportionally without affecting 1D migration distance, suggesting that electron irradiation directly affects the initiation of the 1D migration of interstitial clusters in SUS316L as well as in iron. We proposed a tentative model for the mechanism of 1D migration observed in concentrated alloys under electron irradiation.
Acknowledgements
We are grateful to Messrs. E. Aoyagi and Y. Hayasaka of the High Voltage Electron Microscopy Center at Tohoku University for technical support in the electron irradiation experiments. We also thank Dr. T. Ashino, Dr. K. Takada, and Mr. H. Shimada of the Analytical Research Core for Advanced Materials, Institute for Materials Research, Tohoku University for conducting the impurity analysis of the specimens. This work was supported in part by a Grant-in-Aid for Scientific Research by the Ministry of Education, Culture, Sports, Science, and Technology of Japan (No. 21560868) and by a sponsorship of the JNES open application research project for enhancing the basis of nuclear safety (JNES: Japan Nuclear Energy Safety
Organization).
[1] R.E. Stoller, G.R. Odette, and B.D. Wirth, J. Nucl. Mater. 251 (1997) p. 49.
[2] B.D. Wirth, G.R. Odette, D. Maroudas, and G.E. Lucas, J. Nucl. Mater. 276 (2000) p. 33.
[3] N. Soneda and T. Diaz de la Rubia, Philos. Mag. 81 (2001) p. 331.
[4] Yu.N. Osetskey, D.J. Bacon, A. Serra, B.N. Singh, and S.I. Golubov, Philos. Mag. 83 (2003) p. 61.
[5] M. Kiritani, J. Nucl. Mater. 251 (1997) p. 237.
[6] T. Hayashi, K. Fukumoto and H. Matsui, J. Nucl. Mater. 307-311 (2002) p. 993. [7] H. Abe, N. Sekimura, Y. Yang, J. Nucl. Mater., 323 (2003) p. 220.
[8] K. Arakawa, M. Hatanaka, E. Kuramoto, K. Ono, H. Mori, Phys. Rev. Lett., 96 (2006) p. 125506.
[9] K. Arakawa, K.Ono, M. Isshiki, K. Mimura, M. Uchikoshi, and H. Mori, Science, 318 (2007) p. 956.
[10] Y. Satoh, H. Matsui, and T. Hamaoka, Phys. Rev., B 77 (2008) p. 094135. [11] Y. Satoh and H. Matsui, Philos. Mag. 89 (2009) p. 1489.
[12] B.N. Singh, S.I. Golubov, H. Trinkaus, A.Serra, Yu.N. Osetskey, and A.V. Barashev, J. Nucl. Mater. 251 (1997) p. 107.
[13] H. Trinkaus, B.N. Singh and A.J.E. Foreman, J. Nucl. Mater. 249 (1997) p. 91. [14] T. Yoshiie, Y. Satoh and Q. Xu, J. Nucl. Mater. 329-333 (2004) p. 87.
[15] K. Arakawa, M. Hatanaka, H. Mori, and K.Ono, J. Nucl. Mater. 329-333 (2004) p. 1194.
[16] T. Hamaoka, Y. Satoh, H. Matsui, J. Nucl. Mater. 399 (2010) p. 26. [17] T. Hamaoka, to be published.
[18] H. Watanabe, A. Aoki, H. Murakami, T. Muroga, N. Yoshida, J. Nucl. Mater. 155-157 (1988) p. 815.
[19] S. Kojima, Y. Sano, T. Yoshiie, N. Yoshida, M. Kiritani, J. Nucl. Mater., 141-143 (1986) p. 763.
[20] M. Kiritani, J. Nucl. Mater., 216 (1994) p. 220.
[21] Y. Satoh, T. Yoshiie, H. Mori, M. Kiritani, Phys. Rev., B 69 (2004) p.094108. [22] Y. Dai, X.Jia, J.C. Chen, W.F. Sommer, M. Victoria, G.S. Bauer, J. Nucl. Mater., 296 (2001) p. 174.
[23] R. Schaeublin, Z. Yao, N. Baluc, M. Victoria, Philos. Mag. 85 (2005) p. 769. [24] N. Yoshida, J. Nucl. Mater. 174 (1990) p. 220.
Figure 1 Results of solute/impurity analysis of the present specimens. White and shaded bars indicate the lower detection limit and meaningful values of solute/impurity concentrations, respectively. The results of major elements Fe, Cr, and Ni are not shown.
Figure 2 Variations in carbon and oxygen concentrations of arc-melted Fe-18Cr-13Ni (mass %) as functions of the amount of the base alloy Fe-3.9C (mass %).
Figure 3 Weak-beam dark-field images of defect clusters in SUS316L and model alloys after electron irradiation at room temperature. Acceleration voltage was 1250 kV, and electron beam intensity was 15 x 1024
e m-2 s-1
. Irradiation for 30 s corresponds to about 1 dpa.
Figure 4 Typical examples of dynamic behaviors of interstitial clusters in (a)
Fe-18Cr-13Ni, (b) Fe-18Cr-13Ni-0.012C, (c) Fe-18Cr-13Ni-1.7Mn, and (d) SUS316L under electron irradiation at room temperature. Acceleration voltage was 1250 kV, and electron beam intensity was 15 x 1024
e m-2 s-1
. Times from the start of electron irradiation are shown. Clusters that induced 1D migration, sudden appearance, and sudden disappearance are indicated by “m”, “a”, and “d”, respectively, in the frame after the corresponding changes.
Figure 5 Distribution of displacement of 1D migration of interstitial clusters in (a) SUS316L and (b) Fe-Cr-Ni-C observed along the direction close to [110] and [100], respectively. Broken lines show projections in <110> directions. 1250 kV electrons, 15 x 1024
e m-2 s-1
Figure 6 Time evolutions of the (a) number of observed interstitial clusters and (b) frequency of 1D migration of interstitial clusters in SUS316L at different irradiation intensities. The maximum dose for all conditions was between 2.4 and 3.3 dpa. Each symbol corresponds to an individual experimental run. 1250 kV electrons, at room temperature.
Figure 7 Variations in peak frequency of 1D migration of interstitial clusters in SUS316L and its model alloys as a function of electron beam intensity. Peak frequency for higher-purity iron is also shown. 1250 kV electrons, at room temperature.
Figure 8 Comparison of distribution of 1D migration distance in SUS316L at four different irradiation intensities. The final dose was between 2.4 and 3.3 dpa. 1250 kV electrons, at room temperature.
Figure 9 Size distribution of interstitial clusters that induced 1D migration (a) and that did not induce 1D migration (b) during 34 - 46s from the start of electron irradiation. The cluster size was represented by the average of major and minor sizes of the cluster image at 40 s. (c) and (d) Results for 80 s from the start of electron irradiation. SUS316L, 15 x 1024
e m-2 s-1
, 1250 kV electrons, at room temperature.
Figure 10 Comparison of distribution of 1D migration distance among three ranges in cluster size. The total distribution corresponds to Figure 8a. The final dose was 3.3 dpa. SUS316L, 15 x 1024
e m-2 s-1
, 1250 kV electrons, at room temperature.
Figure 11 Comparison of time evolution of the (a) number of observed interstitial clusters and (b) frequency of 1D migration of interstitial clusters in three model alloys. The maximum dose was 3.3 dpa for all conditions. Each symbol corresponds to an individual experimental run. 1250 kV electrons, 15 x 1024
e m-2 s-1
Figure 12 Comparison of distribution of distance of 1D migration of interstitial clusters among the three model alloys. The final dose was 3.3 dpa for all conditions. 1250 kV electrons, 15 x 1024
e m-2 s-1


![Figure 5 Distribution of displacement of 1D migration of interstitial clusters in (a) SUS316L and (b) Fe-Cr-Ni-C observed along the direction close to [110]](https://thumb-ap.123doks.com/thumbv2/123deta/5919215.1051016/23.892.166.720.355.629/figure-distribution-displacement-migration-interstitial-clusters-observed-direction.webp)