Japan
著者
Akihiko Shimpo, Kazuto Takemura, Shunya
Wakamatsu, Hiroki Togawa, Yasushi Mochizuki,
Motoaki Takekawa, Shotaro Tanaka, Kazuya
Yamashita, Shuhei Maeda, Ryuta Kurora,
Hirokazu Murai, Naoko Kitabatake, Hiroshige
Tsuguti, Hitoshi Mukougawa, Toshiki Iwasaki,
Ryuichi Kawamura, Masahide Kimoto, Izuru
Takayabu, Yukari N Takayabu, Youichi Tanimoto,
Toshihiko Hirooka, Yukio Masumoto, Masahiro
Watanabe, Kazuhisa Tsuboki, Hisashi Nakamura
journal or
publication title
SOLA
volume
15
number
A
page range
13-18
year
2019-06-15
URL
http://hdl.handle.net/10097/00130704
doi: 10.2151/sola.15A-003Japan
Scientific Online Letters on the Atmosphere (SOLA)
EARLY ONLINE RELEASE
This is a PDF of a manuscript that has been peer-reviewed
and accepted for publication. As the article has not yet been
formatted, copy edited or proofread, the final published
version may be different from the early online release.
This pre-publication manuscript may be downloaded,
distributed and used under the provisions of the Creative
Commons Attribution 4.0 International (CC BY 4.0) license.
It may be cited using the DOI below.
The DOI for this manuscript is
DOI: 10.2151/sola.15A-003.
J-STAGE Advance published date: May 17, 2019
The final manuscript after publication will replace the
preliminary version at the above DOI once it is available.
Primary Factors behind the Heavy Rain Event of July 2018
1
and the Subsequent Heat Wave in Japan
2
Akihiko Shimpo1, Kazuto Takemura1, Shunya Wakamatsu1, Hiroki Togawa1, Yasushi
3
Mochizuki1, Motoaki Takekawa1, Shotaro Tanaka1, Kazuya Yamashita1, Shuhei Maeda1,
4
Ryuta Kurora1, Hirokazu Murai1, Naoko Kitabatake2, Hiroshige Tsuguti3, Hitoshi
5
Mukougawa4, Toshiki Iwasaki5, Ryuichi Kawamura6, Masahide Kimoto7, Izuru
6
Takayabu3, Yukari N. Takayabu7, Youichi Tanimoto8, Toshihiko Hirooka6, Yukio
7
Masumoto9, Masahiro Watanabe7, Kazuhisa Tsuboki10, and Hisashi Nakamura11
8
1Japan Meteorological Agency (JMA), Tokyo, Japan
9
2Meteorological College, JMA, Kashiwa, Japan
10
3Meteorological Research Institute, JMA, Tsukuba, Japan
11
4Graduate School of Science, Kyoto University, Kyoto, Japan
12
5Graduate School of Science, Tohoku University, Sendai, Japan
13
6Faculty of Science, Kyushu University, Fukuoka, Japan
14
7Atmosphere and Ocean Research Institute, University of Tokyo, Kashiwa, Japan
15
8Faculty of Environmental Earth Science, Hokkaido University, Sapporo, Japan
16
9Graduate School of Science, University of Tokyo, Tokyo, Japan
17
10Hydrospheric Atmospheric Research Center, Nagoya University, Nagoya, Japan
18
11Research Center for Advanced Science and Technology, University of Tokyo, Tokyo,
19
Japan
20 21
Corresponding author: Akihiko Shimpo, Japan Meteorological Agency, 1-3-4 Otemachi, 22
Chiyoda-ku, Tokyo 100-8122, Japan. E-mail: [email protected]. © 2010, 23
Meteorological Society of Japan. 24
Abstract
25
An extreme rainfall event occurred over western Japan and the adjacent Tokai region 26
mainly in early July, named “the Heavy Rain Event of July 2018”, which caused 27
widespread havoc. It was followed by heat wave that persisted in many regions over 28
Japan in setting the highest temperature on record since 1946 over eastern Japan as the 29
July and summertime means. The rain event was attributable to two extremely moist 30
airflows of tropical origins confluent persistently into western Japan and large-scale 31
ascent along the stationary Baiu front. The heat wave was attributable to the enhanced 32
surface North Pacific Subtropical High and upper-tropospheric Tibetan High, with a 33
prominent barotropic anticyclonic anomaly around the Korean Peninsula. The 34
consecutive occurrence of these extreme events was related to persistent meandering of 35
the upper-level subtropical jet, indicating remote influence from the upstream. The heat 36
wave can also be influenced by enhanced summertime convective activity around the 37
Philippines and possibly by extremely anomalous warmth over the Northern 38
Hemisphere midlatitude in July 2018. The global warming can also influence not only 39
the heat wave but also the rain event, consistent with a long-term increasing trend in 40
intensity of extreme precipitation observed over Japan. 41
(Citation: Shimpo, A., K. Takemura, S. Wakamatsu, H. Togawa, Y. Mochizuki, M. 42
Takekawa, S. Tanaka, K. Yamashita, S. Maeda, R. Kurora, H. Murai, N. Kitabatake, H. 43
Tsuguti, H. Mukougawa, T. Iwasaki, R. Kawamura, M. Kimoto, I. Takayabu, Y. N. 44
Takayabu, Y. Tanimoto, T. Hirooka, Y. Masumoto, M. Watanabe, K. Tsuboki, and H. 45
Nakamura, 2019: Primary factors behind the Heavy Rain Event of July 2018 46
and the subsequent heat wave in Japan. SOLA, 15, XXX-XXX, 47 doi:10.2151/sola.XXXX-XXX.) 48 1. Introduction 49
Japan experienced an extreme climate event that brought unprecedented amounts of 50
precipitation from June 28 to July 8, 2018, which was officially named “The Heavy 51
Rain Event of July 2018” by the Japan Meteorological Agency (JMA). It caused 52
widespread disastrous conditions, especially over western Japan and Tokai region, in 53
early July in the presence of the stationary Baiu front and Typhoon Prapiroon (T1807). 54
As of January 9, 2019, 237 fatalities were reported during the heavy rain event (Cabinet 55
Office, Japan 2019). Subsequently, extremely high temperatures persisted nationwide 56
except in Hokkaido and Okinawa/Amami regions, in association with the North Pacific 57
Subtropical High (NPSH) that intensified in the vicinity of Japan from mid-July to the 58
end of August. As of February 5 2019, it was reported that these extremely high 59
temperatures in summer 2018 caused 1469 fatalities due to heat stroke nationwide 60
(Ministry of Health, Labour and Welfare, Japan, 2019). 61
This article described the overall characteristics of and possible related factors behind 62
the Heavy Rain Event of July 2018 (or “2018 rain event” in short) and the subsequent 63
notable heat wave conditions, based on analysis conducted jointly by JMA and the JMA 64
Advisory Panel on Extreme Climate Events. The latter is a JMA body consisting of 65
several experts on climate science from universities and research institutes in Japan. 66
2. Data
67
In-situ observational station data of precipitation and surface temperature over Japan 68
were obtained from the JMA Automated Meteorological Data Acquisition System 69
(AMeDAS). Various atmospheric quantities (e.g., geopotential heights at 200 hPa) used 70
in this study were from the Japanese 55-year Reanalysis (JRA-55; Kobayashi et al. 71
2015) since 1958 with spatial resolution of 1.25º in both latitude and longitude. In 72
addition, the Centennial in situ Observation-Based Estimates of the variability of sea 73
surface temperatures (SSTs) (COBE-SST; Ishii et al. 2005), NOAA Interpolated 74
Outgoing Longwave Radiation (OLR) data (Liebmann and Smith 1996) and the Global 75
Satellite Mapping of Precipitation (GSMaP; Ushio et al. 2009) in near real time 76
(GSMaP_NRT) were also used. Climatological means are defined as averages for the 77
period from 1981 to 2010, and anomalies as deviations from the thus-defined 78
climatologies. 79
3. Observed extreme climate conditions
80
3.1 The Heavy Rain Event of July 2018 81
Most of the regions in Japan experienced significant rainfall during the 2018 rain 82
event from June 28 to July 8 with unprecedented amounts of precipitation recorded at 83
many of the AMeDAS stations. Specifically, some of those stations in Shikoku and 84
Tokai regions recorded more than 1,800 and 1,200 mm, respectively, during the event 85
(Fig. 1a; see Fig. S1 for the regions referred to in this article), and some areas 86
experienced as much as two to four times the precipitation of the monthly climatology 87
for July. Overall precipitation observed at 966 AMeDAS stations selected throughout 88
Japan in early July 2018 reached 208,035.5 mm (215.4 mm per station), which was the 89
highest among any 10-day periods starting from the 1st, 11th and 21st of the months 90
since 1982, highlighting the nationwide significance of this event. 91
In comparison with past heavy rainfall events caused by frontal systems and typhoons, 92
a prominent characteristic of the 2018 rain event is that the record-breaking local 93
precipitation, particularly within 48 to 72 hours, was observed extensively over western 94
Japan and Tokai region, including the Seto Inland Sea region, where monthly 95
precipitation climatologies are lower than in the surroundings (Fig. 1b). Total 96
precipitation at the selected AMeDAS stations throughout Japan for the period from 97
July 5 to 7, 2018 was 140,567.0 mm (equivalent to 145.5 mm per station), which was 98
the highest among any three-day periods since 1982. The three-day total during the 99
event was the highest ever for Chugoku region. 100
3.2 Heat wave from mid-July to August 101
The 2018 rain event terminated with the northward shift of the stationary Baiu front 102
due to re-enhancement of the NPSH. This shift also resulted in the withdrawal of the 103
Baiu period. The withdrawal was significantly earlier than its climatological counterpart 104
from Chugoku to southern Tohoku regions. The Baiu withdrawal in Kanto-Koshin 105
region (around Tokyo) occurred around June 29, the earliest on record. 106
In the period from mid-July to late August in 2018, area-averaged temperatures in 107
eastern and western Japan were significantly above normal. The July-mean (Fig. 2a) and 108
seasonal-mean (June-July-August) temperature anomalies in 2018 over eastern Japan 109
were +2.8°C and +1.7°C, respectively, both of which were the highest since the 110
area-averaged statistics for reference began in 1946. 111
At many weather stations daily maximum temperature often exceeded 30°C or 112
sometimes even 35°C. Several stations reported maximum temperatures exceeding 113
40°C around the peak of the heat wave, and on July 23 a new national record of 114
maximum temperature of 41.1°C was set at the Kumagaya City north of Tokyo. A total 115
of 202 AMeDAS stations set record maximum temperatures this summer. Figure 2b 116
shows evolution of the cumulative number of AMeDAS stations at which observed 117
daily high temperatures were 35°C or higher in June through September for 2018 and its 118
counterpart for some recent years. The cumulative numbers in 2018 show an 119
unprecedented increase that began as early as in mid-July, and finally the annual total 120
for 2018 well exceeds the previous highest record set in 2010 since 1976. 121
122
4. Primary factors behind the two extreme climate events
123
4.1 Primary factors behind heavy rainfall from July 5 to 8 124
Here, we focus on the heavy rainfall from July 5 to 8, which yielded most of the 125
rainfall over western Japan and Tokai region, and discuss its primary factors. 126
127
a. Synoptic situation around Japan 128
Around July 3 (Fig. S2f), the Baiu front was persistent over the northern part of the 129
Sea of Japan and Hokkaido between the intensified NPSH and the developing Okhotsk 130
High. On July 4 (Fig. S2g), the frontal system shifted further northward as Typhoon 131
Prapiroon moved northeastward over the Sea of Japan. The typhoon subsequently 132
transformed into an extratropical cyclone and approached Hokkaido on July 5 (Fig. 133
S2h). In association with the further development of the Okhotsk High, the Baiu front 134
shifted southward to the vicinity of western Japan, initiating heavy rainfall there. 135
As the NPSH southeast of Japan gradually re-intensified from July 6 onward, the 136
Baiu front stagnated in the vicinity of western Japan, continuously yielding heavy 137
rainfall (Fig. S2i). On July 7, an intensifying upper-level trough approached the western 138
part of the Sea of Japan from the west, generating a meso-scale low-pressure system to 139
its east on the Baiu front (Fig. S2j). Enhancing moisture inflow from the south into 140
western Japan to an extreme level (Takemura et al. 2019 (submitted); Sekizawa et al. 141
2019 (submitted)), this eastward-moving system yielded torrential rainfall over the Seto 142
Inland Sea side of the Chugoku and Shikoku regions. By the evening of July 7 the 143
large-scale precipitation area associated with the upper-level trough and surface 144
low-pressure system moved away from western Japan. Still, the low-level warm moist 145
inflow persisted into the following day, to organize several meso-scale convective 146
systems on the Pacific side of western Japan. 147
148
b. Large-scale circulation anomalies and associated remote influence 149
During the heavy rainfall event discussed above, the anomalous intensification of the 150
surface NPSH just southeast of Japan (Fig. 3b; Fig. S3) was associated with a persistent 151
northward meander of the upper-level subtropical jet (STJ) east of Japan with a 152
quasi-stationary anticyclonic anomaly (Fig. 3a). Meanwhile, the development of the 153
surface Okhotsk High (Fig. 3b; Fig. S3) was associated with a persistent marked 154
meander of the upper-level polar-front jet (PFJ) with the consequent development of a 155
prominent blocking ridge over eastern Siberia (Fig. 3a; Nakamura and Fukamachi 2004). 156
The concomitant meanders of these two jetstreams thus led to the amplification of the 157
NPSH and the Okhotsk High, acting to strengthen temperature and moisture contrasts 158
across the stationary Baiu front during the rain event. In addition, the STJ meander with 159
the upper-level trough lingering around the Korean Peninsula act to induce large-scale 160
ascent along the Baiu front, thereby favoring the formation of convective rainband 161
(Sampe and Xie 2010). The meanders of the STJ over Eurasia in summer are observed 162
in association with quasi-stationary Rossby wave propagation (teleconnection), whose 163
primary pattern is known as the Silk Road pattern (Enomoto et al. 2003; Kosaka et al. 164
2009). Even more prominent meanders of the STJ as the Silk Road teleconnection 165
occurred in late June, bringing the earliest-ever withdrawal of the Baiu rainy season to 166
Kanto-Koshin region (around Tokyo; Fig. S2b; Fig. S3). 167
168
c. Characteristic climate conditions causing the rain event 169
(1) Confluence of two extremely moist airflows into western Japan 170
During the rainfall event, enhanced convective activity over the southern East China 171
Sea (Fig. 4a) moistened the lower- and mid-tropospheric air, which was then transported 172
into western Japan by the southwesterlies. As the surface NPSH intensified southeast of 173
Japan, the surface southerlies strengthened south of Japan and thereby transported a 174
huge amount of moisture into western Japan (Fig. 3b, Fig. 4a). As demonstrated by 175
Takemura et al. (2019, submitted), the confluence of these two moist airflows brought 176
an unprecedented amount of moisture into western Japan from July 5 to 7, 2018, based 177
on the JRA-55 since 1958. They also argue that the enhanced convection over the East 178
China Sea acted to reinforce the moist southwesterlies by inducing low-level cyclonic 179
anomalies. 180
181
(2) Persistent ascent associated with the stationary Baiu Front 182
Around July 5, low-level cool air was transported southwestward over the Sea of 183
Japan due to the prominent Okhotsk High, which in combination with the concomitant 184
intensification of the low-level southerlies, strengthened meridional temperature 185
contrast across the Baiu front. Through these frontogenetic processes, ascent was 186
enhanced on the warmer side of the front, which favored the organization of convective 187
systems over western Japan and its vicinity, leading to heavy precipitation there. This 188
continuous ascent was attributable to the developing upper-level trough (e.g., Takemura 189
et al. 2019 (submitted); Yokoyama et al. 2019 (to be submitted)). 190
191
(3) Occurrence of line-shaped precipitation systems 192
Some areas affected by line-shaped convective precipitation systems experienced 193
extended periods of torrential rainfall, resulting in record-breaking precipitation totals. 194
Some of those systems exhibited a sequential back-building formation of convective 195
clouds, typified by those observed in the evening of July 6 in Hiroshima Prefecture 196
(Tsuguti et al. 2018). 197
198
4.2 Primary factors behind the heat wave from mid-July to August 199
a. Synoptic situation around Japan and associated large-scale atmospheric circulation 200
After the early July rain event, both the surface NPSH and the upper-tropospheric 201
Tibetan High (or the South Asian High), which exert substantial influence on Japan’s 202
summer climate, persistently extended toward the main islands of Japan (Figs. 3c, d; Fig. 203
S3). These high-pressure systems contributed to extremely high surface air temperature 204
(SAT) observed over mainland Japan, through prevailing sunny conditions and adiabatic 205
warming by anomalous descent. The extension of the Tibetan High toward Japan was 206
associated with an equivalent barotropic anticyclonic anomaly and the 207
northward-meandering STJ around the Korean Peninsula (Fig. 3c). The northward 208
meander was enhanced repeatedly due to the intensification of the anticyclonic anomaly 209
with incoming wave trains across Eurasia similar to the Silk Road pattern (Fig. 5a). 210
Three events of such wave-train propagation occurred in the middle through late July, 211
which were more frequent and stronger than those in August. The deep anticyclonic 212
anomaly was also concomitant with the strengthening of large-scale low-level cyclonic 213
circulation around Southeast Asia and the Philippines (i.e., the monsoon trough) and the 214
associated enhancement of convective activity around the Philippines (Figs. 4b and 5b). 215
The enhanced convection persisted from July through August, peaking in mid-July, 216
around August 10 and in late August. The cyclonic anomaly around the Philippines and 217
the anticyclonic anomaly around Japan are a manifestation of the Pacific-Japan (PJ) 218
pattern (Nitta 1987; Kosaka and Nakamura 2010). These atmospheric conditions 219
causing extreme positive SAT anomalies over Japan were marked in the middle and late 220
July and similar conditions were also observed in August. The northward STJ meander 221
became most pronounced in late July, influencing the untypical track of Typhoon 222
Jongdari (T1812), which moved westward after making landfall on mainland Japan. At 223
that time, the STJ axis was located around 50°N with weak easterlies south of 40°N (not 224
shown). 225
226
b. Persistent warm anomalies in the Northern Hemisphere midlatitude 227
In addition to the aforementioned effects by the anomalous circulation, factors 228
considered to act as a background to the heat wave over Japan include marked 229
tropospheric warmness over the Northern Hemisphere (NH) midlatitude since March 230
2018. In fact, zonally averaged tropospheric temperature in the NH midlatitude (e.g., 40 231
– 60°N) was the highest in 2018 for July since 1958 (Fig. 6a). Though more 232
investigation is needed into possible contribution from decadal variability and/or global 233
warming, this warmness might be attributable, at least in part, to enhanced convective 234
activity in the 10 – 20°N band over the western and central North Pacific including the 235
vicinity of the Philippines, in combination with suppressed convective activity in the 236
tropical South Pacific. This equatorial asymmetry in anomalous convective activities 237
may be attributable to the corresponding asymmetry in the SST field with positive 238
anomalies mostly over the tropical North Pacific and negative anomalies largely over 239
the tropical South Pacific (Fig. 6b). 240
241
5. Summary and discussion
242
This article offers an overview of the two extreme events that occurred in Japan 243
during 2018 summer, the Heavy Rain Event of July 2018 and the pronounced heat wave 244
from mid-July to the end of August. As illustrated in Fig. 7a, our analysis of the 2018 245
rain event, with primary focus on the heavy rainfall from July 5 to 8, has revealed the 246
three primary atmospheric factors as follows that could contribute to the event: 247
(A) Persistent confluence of two extremely moist airflows with tropical origins into 248
western Japan; 249
(B) Persistent ascent in a large-scale rain band along the stationary Baiu front; and 250
(C) Formation of line-shaped convective systems. 251
The factors (A) and (B) were contributed to by the intensified surface NPSH and 252
Okhotsk High in association with persistent pronounced meanders of the upper-level 253
STJ and PFJ, respectively (Fig. 7b). Overall, (A) and (B) appear to be the dominant 254
factors behind the event, while (C) played a significant role in torrential meso-scale 255
precipitation over some regions around western Japan. 256
As illustrated in Fig. 7c, the primary factors for the heat wave was the persistent 257
extension of the surface NPSH and the upper-tropospheric Tibetan High toward 258
mainland Japan, through the PJ-like teleconnection from convective activity enhanced 259
persistently around the Philippines and a persisted poleward meander of the STJ in 260
association with the teleconnection over Eurasia similar to the “Silk Road pattern”. 261
Although Fig. 7c illustrates the conditions in the middle and late July, similar conditions 262
were observed in August. 263
The consecutive occurrence of these two extreme climate events was attributable in 264
part to pronounced meanders of STJ (Fig. 5), including a manifestation of the 265
Silk-Road-pattern-like teleconnection over Eurasia. This wave teleconnection gave rise 266
to consecutive occurrence of abnormal weather conditions across Eurasia, including 267
anomalous high temperatures over central Asia. Another contributor to the heat wave 268
can be above-normal zonal-mean tropospheric temperature over the NH midlatitude that 269
persisted since March 2018. 270
Recent studies have focused on possible contribution to extreme events from global 271
warming (e.g., Imada et al. 2018). JMA (2018) reported that an upward long-term trend 272
in SAT over Japan is superimposed on its interannual and decadal fluctuations. The 273
warming trend was likely to act as a background to the heat wave in 2018 summer. In 274
fact, Imada et al. (2019) argued that the extremely high temperatures over Japan in July 275
would never have happened without anthropogenic global warming, based on 276
large-ensemble simulations through an event attribution approach. Furthermore, it has 277
been revealed from observations at AMeDAS stations all across Japan that the 278
nationwide average of the annual 72-hour maximum precipitation has increased by 279
about 10% over the last 30 years (Fig. S4). This statistic provides certain evidence for 280
an increasing trend in intensity of extreme local precipitation events observed recently 281
over Japan. According to IPCC (2013), an increasing trend in tropospheric water vapor 282
is very likely almost globally since the 1980s in association with the observed increase 283
in atmospheric temperature. It is widely accepted that saturated water vapor amount 284
increases approximately by 7% for air temperature increase by 1°C. In fact, JMA (2015) 285
reported an increasing trend in lower-tropospheric water vapor over Japan since the 286
1980s based on radiosonde observations (Fig. S5). These trends suggest a possibility 287
that the 2018 rain event may be influenced by the global warming. 288
Although additional analyses are presented in companion papers (e.g., Takemura et al. 289
2019 (submitted); Sekizawa et al. 2019 (submitted)), further investigations are required 290
in future to deepen our understanding of the aforementioned extreme events, especially 291
their mechanisms and predictability as well as specific contributions from global 292
warming and decadal climate variability (e.g., Urabe and Maeda 2014). It is also 293
instructive to perform event attribution studies targeting global warming impacts on 294
these extreme events (e.g., Imada et al. 2019) as well as other extreme events occurred 295
in Japan (e.g., Imada et al. 2018). 296
297
Acknowledgements
298
The authors are grateful to the anonymous reviewers for their constructive comments. 299
The authors would also like to express sincere thanks to the members of the Working 300
Group under the JMA Advisory Panel on Extreme Climate Events as well as related 301
JMA experts for their valuable contributions to the analysis of the events. NOAA 302
Interpolated OLR data was taken from U.S. NOAA Earth System Research Laboratory. 303
GSMaP data was provided by the Earth Observation Research Center, Japan Aerospace 304
Exploration Agency. HN is supported in part by the Japan Society for the Promotion of 305
Science through KAKENHI Grants (JP18K19951, JP16H01844) and by the Japan 306
Science and Technology Agency through Belmont Forum CRA “InterDec.” 307
308
Supplements
309
Supplement Figure 1 (Fig. S1). Climatological regions of Japan. 310
Supplement Figure 2 (Fig. S2). JMA surface analysis charts at 00 UTC from June 28 to 311
July 9, 2018. 312
Supplement Figure 3 (Fig. S3). Latitude-time section of daily precipitation and daily 313
sea-level pressure averaged over 130 – 140°E for 2018 summer. 314
Supplement Figure 4 (Fig. S4). Time series of the nationwide average of annual 72-hour 315
maximum precipitation (%) normalized by the baselines (i.e., the 1981 – 2010 average), 316
based on observations at 685 AMeDAS stations over Japan from 1976 to 2018. 317
Supplement Figure 5 (Fig. S5). Time series of the nationwide average of summer-mean 318
850-hPa specific humidity (%) normalized by the baseline (i.e., the 1981 – 2010 319
average), based on radiosonde observations at 13 stations over Japan from 1981 to 320 2018. 321 322 References 323
Cabinet Office, Japan, 2019: Report on damages by the Heavy Rain Event of July 2018 324
(as of January 9, 2019). Available online at
325
http://www.bousai.go.jp/updates/h30typhoon7/pdf/310109_1700_h30typhoon7_01
326
.pdf, accessed on April 8, 2019 (in Japanese). 327
Enomoto, T., B. J. Hoskins and Y. Matsuda, 2003: The formation mechanism of the 328
Bonin high in August. Quart. J. Roy. Meteor. Soc., 129, 157–178. 329
Imada, Y., H. Shiogama, C. Takahashi, M. Watanabe, M. Mori, Y. Kamae, and S. Maeda, 330
2018: Climate change increased the likelihood of the 2016 heat extremes in Asia. 331
Bull. Amer. Meteor. Soc., 99, S97-S101.
332
Imada, Y., M. Watanabe, H. Kawase, H. Shiogama, and M. Arai, 2019: The July 2018 333
high temperature event in Japan could not have happened without human-induced 334
global warming. SOLA (accepted). 335
IPCC, 2013: Climate Change 2013: The Physical Science Basis. Contribution of 336
Working Group I to the Fifth Assessment Report of the Intergovernmental Panel on 337
Climate Change [Stocker, T.F., D. Qin, G.-K. Plattner, M. Tignor, S.K. Allen, J. 338
Boschung, A. Nauels, Y. Xia, V. Bex and P.M. Midgley (eds.)]. Cambridge 339
University Press, Cambridge, United Kingdom and New York, NY, USA, 1535 pp. 340
Ishii, M., A. Shouji, S. Sugimoto, and T. Matsumoto, 2005: Objective analyses of 341
sea-surface temperature and marine meteorological variables for the 20th century 342
using ICOADS and the KOBE collection. Int. J. Climatol., 25, 865-879. 343
JMA, 2015: Report on Climate Change and Extreme Weather 2014. 253pp (in 344
Japanese). 345
JMA, 2018: Climate change monitoring report 2017. 91pp. Available on 346
https://www.jma.go.jp/jma/en/NMHS/indexe_ccmr.html. 347
Kobayashi, S., Y. Ota, Y. Harada, A. Ebita, M. Moriya, H. Onoda, K. Onogi, H. 348
Kamahori, C. Kobayashi, H. Endo, K. Miyaoka, and K. Takahashi, 2015: The 349
JRA-55 Reanalysis: General specifications and basic characteristics. J. Meteor. Soc. 350
Japan, 93, 5–48.
Kosaka, Y., and H. Nakamura, 2010: Mechanisms of meridional teleconnection 352
observed between a summer monsoon system and a subtropical anticyclone. Part I: 353
The Pacific-Japan pattern. J. Climate, 23, 5085–5108. 354
Kosaka, Y., H. Nakamura, M. Watanabe, and M. Kimoto, 2009: Analysis on the 355
dynamics of a wave-like teleconnection pattern along the summertime Asian jet 356
based on a reanalysis dataset and climate model simulations. J. Meteor. Soc. Japan, 357
87, 561-580.
358
Liebmann, B., and C. A. Smith, 1996: Description of a complete (interpolated) outgoing 359
longwave radiation dataset. Bull. Amer. Meteor. Soc., 77, 1275–1277. 360
Ministry of Health, Labour and Welfare, Japan, 2019: Monthly Vital Statistics Report. 361
73(9), 38pp, Available online at
362
https://www.mhlw.go.jp/toukei/saikin/hw/jinkou/geppo/m2018/dl/all3009.pdf, 363
accessed on April 8, 2019 (in Japanese). 364
Nakamura, H., and T. Fukamachi, 2004: Evolution and dynamics of summertime 365
blocking over the Far East and the associated surface Okhotsk high. Quart. J. Roy. 366
Meteor. Soc., 130, 1213–1233.
367
Nitta, T., 1987: Convective activities in the tropical western Pacific and their impact on 368
the Northern Hemisphere summer circulation. J. Meteor. Soc. Japan, 65, 373–390. 369
Sampe, T., and S.-P. Xie, 2010: Large-scale dynamics of the Meiyu-Baiu rainband: 370
Environmental forcing by the westerly jet. J. Climate, 23, 113–134. 371
Sekizawa, S., T. Miyasaka, H. Nakamura, A. Shimpo, K. Takemura, and S. Maeda, 372
2019: Anomalous moisture transport and oceanic evaporation during a torrential 373
rainfall event over western Japan in early July 2018. submitted to SOLA. 374
Takemura, K., S. Wakamatsu, H. Togawa, A. Shimpo, C. Kobayashi, S. Maeda, and H. 375
Nakamura, 2019: Extreme moisture flux convergence over western Japan during 376
the Heavy Rain Event of July 2018. submitted to SOLA. 377
Tsuguti, H., N. Seino, H. Kawase, Y. Imada, T. Nakaegawa, and I. Takayabu, 2018: 378
Meteorological overview and mesoscale characteristics of the Heavy Rain Event of 379
July 2018 in Japan. Landslides, 16, 363-371. 380
Urabe, Y., and S. Maeda, 2014: The relationship between Japan’s recent temperature 381
and decadal variability. SOLA, 10, 176-179. 382
Ushio, T., K. Sasashige, T. Kubota, S. Shige, K. Okamoto, K. Aonashi, T. Inoue, N. 383
Takahashi, T. Iguchi, M. Kachi, R. Oki, T. Morimoto, and Z. Kawasaki, 2009: A 384
Kalman filter approach to the Global Satellite Mapping of Precipitation (GSMaP) 385
from combined passive microwave and infrared radiometric data. J. Meteor. Soc. 386
Japan, 87A, 137-151.
387
Yokoyama, C., H. Tsuji, and Y. N. Takayabu, 2019: A Study on effects of an 388
upper-tropospheric trough on the Heavy Rainfall Event in July 2018 over Japan. to 389
be submitted to the J. Meteor. Soc. Japan. 390
391
Figure Captions
392
Fig. 1. Precipitation amounts (mm) observed during the Heavy Rain Event of July 2018 393
(June 28 - July 8 2018). (a) 11-day total. (b) Maximum 72-hour precipitation during 394
the 11-day event over western Japan and Tokai region. Thick and thin squares with 395
short lines indicate stations at which the 72-hour maxima during the event were the 396
highest ever any time since 1982 and the highest in July, respectively. 397
Fig. 2. (a) Monthly temperature anomaly (°C) observed in July 2018. (b) Seasonal 398
evolution (June through September) of cumulative numbers of AMeDAS stations 399
with daily maximum temperatures of 35 °C or higher for 2018 (thick solid), 2010 400
(thick dotted) and for 2013 through 2017. Numbers of available AMeDAS stations 401
are 918 for 2010, 927 for 2013, 2015 and 2018, 923 for 2014, and 929 for 2016 and 402
2017. 403
Fig. 3. (a) Geopotential height (m) at 200-hPa (contour) and its anomaly (shaded as in 404
the color bar) over the extratropical Northern Hemisphere averaged from July 4 to 8, 405
2018. Contour interval is 100 m and thick lines indicate 12000 and 12500 m. (b) As 406
in (a) but for sea-level pressure (hPa). Contour interval is 4 hPa and thick lines 407
indicate 1000 and 1020 hPa. (c) and (d) As in (a) and (b), respectively, but for the 408
averages from July 11 to 24, 2018. 409
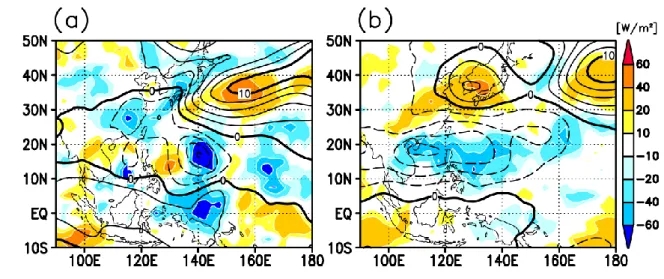
Fig. 4. (a) Anomalies of 850-hPa streamfunction (contoured for every 2 × 10⁶ m s-1;
410
thickened for 0 and 10 × 106 m s-1; dashed for negative) and outgoing longwave
411
radiation (OLR; W m-2; shaded as in the color bar) averaged from July 4 to 8, 2018.
412
(b) As in (a), but for the average from July 11 to 24, 2018. 413
Fig. 5. (a) Longitude-time section of five-day running mean anomalies in meridional 414
wind velocity (contoured for every 5 m s-1; dashed for anomalous northerlies; zero
415
lines omitted) and geopotential height (m; shaded as in the color bar) both at 416
200-hPa as averages over 35 – 50°N, and (b) time series of five-day running mean 417
outgoing longwave radiation (OLR) anomalies (W m-2) averaged over the domain
418
[10 – 20°N, 120 – 130°E] for 2018 summer. 419
Fig. 6. (a) Interannual variations in monthly anomalies for July of zonally averaged 420
thickness temperature in the troposphere (300 – 850 hPa; red triangles and black 421
dots for averages over the latitude bands of 40 – 60°N and 30 – 70°N, respectively). 422
(b) Monthly anomalies of outgoing longwave radiation (OLR; contoured for every 423
10 W m-2; dashed for negative anomalies; zero lines omitted) and sea surface
424
temperature (SST; °C; shaded as in the color bar), for July 2018. 425
Fig. 7. Schematics for (a) primary synoptic-scale factors and (b) large-scale atmospheric 426
circulation behind the extreme rainfall event that occurred over western Japan and 427
Tokai region from July 5 to 8, 2018. (c) As in (b), but for the heat wave in the 428
middle and late July, 2018. NPSH and SST stand for the surface North Pacific 429
Subtropical High and sea surface temperature, respectively. Purple, green and blue 430
dashed lines show normal positions of the NPSH, the Tibetan High and the 431
monsoon trough, respectively. 432
433 434
435
Fig. 1. Precipitation amounts (mm) observed during the Heavy Rain Event of July 2018 436
(June 28 - July 8 2018). (a) 11-day total. (b) Maximum 72-hour precipitation during 437
the 11-day event over western Japan and Tokai region. Thick and thin squares with 438
short lines indicate stations at which the 72-hour maxima during the event were the 439
highest ever any time since 1982 and the highest in July, respectively. 440
442
Fig. 2. (a) Monthly temperature anomaly (°C) observed in July 2018. (b) Seasonal 443
evolution (June through September) of cumulative numbers of AMeDAS stations 444
with daily maximum temperatures of 35 °C or higher for 2018 (thick solid), 2010 445
(thick dotted) and for 2013 through 2017. Numbers of available AMeDAS stations 446
are 918 for 2010, 927 for 2013, 2015 and 2018, 923 for 2014, and 929 for 2016 and 447
2017. 448
450
Fig. 3. (a) Geopotential height (m) at 200-hPa (contour) and its anomaly (shaded as in 451
the color bar) over the extratropical Northern Hemisphere averaged from July 4 to 8, 452
2018. Contour interval is 100 m and thick lines indicate 12000 and 12500 m. (b) As 453
in (a) but for sea-level pressure (hPa). Contour interval is 4 hPa and thick lines 454
indicate 1000 and 1020 hPa. (c) and (d) As in (a) and (b), respectively, but for the 455
averages from July 11 to 24, 2018. 456
458
Fig. 4. (a) Anomalies of 850-hPa streamfunction (contoured for every 2 × 10⁶ m s-1;
459
thickened for 0 and 10 × 106 m s-1; dashed for negative) and outgoing longwave
460
radiation (OLR; W m-2; shaded as in the color bar) averaged from July 4 to 8, 2018.
461
(b) As in (a), but for the average from July 11 to 24, 2018. 462
464
Fig. 5. (a) Longitude-time section of five-day running mean anomalies in meridional 465
wind velocity (contoured for every 5 m s-1; dashed for anomalous northerlies; zero
466
lines omitted) and geopotential height (m; shaded as in the color bar) both at 467
200-hPa as averages over 35 – 50°N, and (b) time series of five-day running mean 468
outgoing longwave radiation (OLR) anomalies (W m-2) averaged over the domain
469
[10 – 20°N, 120 – 130°E] for 2018 summer. 470
472
Fig. 6. (a) Interannual variations in monthly anomalies for July of zonally averaged 473
thickness temperature in the troposphere (300 – 850 hPa; red triangles and black 474
dots for averages over the latitude bands of 40 – 60°N and 30 – 70°N, respectively). 475
(b) Monthly anomalies of outgoing longwave radiation (OLR; contoured for every 476
10 W m-2; dashed for negative anomalies; zero lines omitted) and sea surface
477
temperature (SST; °C; shaded as in the color bar), for July 2018. 478
480
Fig. 7. Schematics for (a) primary synoptic-scale factors and (b) large-scale atmospheric 481
circulation behind the extreme rainfall event that occurred over western Japan and 482
Tokai region from July 5 to 8, 2018. (c) As in (b), but for the heat wave in the 483
middle and late July, 2018. NPSH and SST stand for the surface North Pacific 484
Subtropical High and sea surface temperature, respectively. Purple, green and blue 485
dashed lines show normal positions of the NPSH, the Tibetan High and the 486
monsoon trough, respectively. 487