Vision in Tunas and Marlins
著者
KAWAMURA Gunzo, NISHIMURA Waichiro, UEDA
Soichi, NISHI Tooru
journal or
publication title
南海研紀要
volume
2
number
1
page range
3-47
URL
http://hdl.handle.net/10232/15599
Mem. Kagoshima Univ. Res. Center S. Pac, Vol. 1, No. 2, 1981 3
Vision in Tunas and Marlins
Gunzo KAWAMURA*1, Waichiro NlSHIMURA*1,
Soichi UEDA*2 and Tooru NlSHI*2Abstract
To obtain a fundamental knowlege of the vision of tunas and marlins the brains were observed morphologically, and the retinae were examined histologically and electrophysiologically. Tunas and marlins have an extremely well developed optic tectum indicating that vision is very important to them. The S-potentials recorded from the retinae showed that tunas and marlins are probably color-blind. The retinae has cones (predominantly twin cones) in parallel arrangement, 3 layers of horizontal cells, no fovea nor well-developed area. Dense retinal tapetum was found in the bigeye tuna. Visual acuity determined from cone density ranged from 0.3 to 0.5, which is the highest among fishes. It is believed that the retinae of these fishes are advantageous for movement perception, and that their eyes are well adapted to the low light levels in the lower limits of their vertical distribution (ca. 500 m). Sight feeding was confirmed by experimental fishing by longlines with inedible artificial lures.
CONTENTS
Page
I . Introduction 4
II. Importance of vision as inferred from brain pattern 6 III. Visual acuity as inferred from histology on retina 8
IV. Color vision and spectral sensitivity 15
V. Attempts to confirm the importance of movement 18
perception in feeding
VI. Longline fishing with inedible artificial lure 21
VII. Conclusion 25
References 26
* 1 Lab. Fish. Technol., Fac. Fish., Kagoshima Univ., Shimoarata 4, Kagoshima, 890 Japan.
I. INTRODUCTION
Tunas and marlins widely inhabit oceanic and coastal waters in the Pacific, Indian, and Atlantic Oceans, and are of high commercial value. To predict changes in their distribution and abundance, systematic scientific work has been conducted, mostly as
oceanographic investigations in fishing grounds. Such work began in Japan in the
early 1930's,and in the USA in the early 1950's, since then these nations and others have been increasingly involved. The activities were reviewed by BLACKBURN (1965), NAKAMURA (1965), KAWAi (1969), SuDA et al (1969), SfflNGU (1970), and UDA and NAKAMURA (1973). At the same time, subsistence and commercial fishermen
have worked to devise and improve tuna fishing methods and gears. Only a few
similar attempts have been made by fishery scientists because of the difficulties involved in, for example, repeated experimental operation in the field.
Although oceanographic investigations have not contributed so much to fishery, they have elucidated a great many aspects in pure oceanography, such as currents and hydrographic conditions in fishing grounds. Owing to the accumulation of experi mental and commercial catch data, fish population dynamics has become a subject of great interest, and estimates of resources therefrom have become increasingly more reliable (SUDA, 1970, 1974; HAYASHI et al, 1972 ; HAYASHI, 1974 ; LAUREC and Le
Gall, 1975).
The seasonal and monthly horizontal distribution of tunas and marlins is now well
known from commercial and experimental fishing all over the world. The vertical
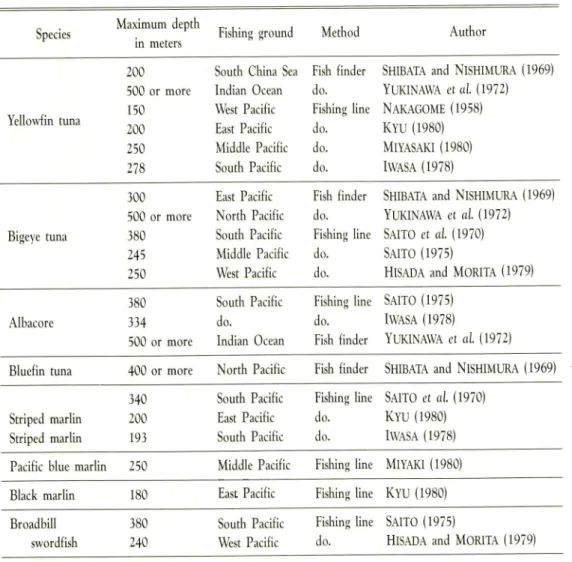
ranges have also been determined, by means of specially-designed deep sea lines and fish finders, to extend from the surface down to 500 m or so (NAKAGOME, 1958; SHIBATA and NlSHIMURA, 1969 ; SAITO et al, 1970 ; YUKINAWA et al, 1972 ; SAITO, 1975;I\VASA, 1978; HlSADA and MORITA, 1980; KYU, 1980; MlYAKI, 1980). The maximum depths of distribution of the various species are summarized in Table 1. 1. The finding of such a deep vertical range is very interesting to vision researchers. While light intensity is fairly strong at the water surface in tropical areas, ambient
light is extremely limited below 200m. Evidently, tunas and marlins have eyes spe
cially adapted to such optic environments.Knowledge about the behaviour and sensory physiology of fishes is very important
to fishery. In this paper, we report on vision in tunas and marlins, from histological
and electrophysiological studies and experimental confirmatory fishing.
There are many variations in the nomenclature of tunas and marlins, but we used the following for the species in the present study.
Japanese name English name Scientific name
Kihada Yellowfin tuna Neothunmis albacora (LOWE)
Mebachi Bigeye tuna Parathunnus, sibi (TEMMINCK & SCHLEGEL)
Binnaga Albacore Thunnus alalunga (BONNATERRE)
Kuromaguro Bluefin tuna Thunnus thynnus orientalis
(TEMMINCK & SHCLEGEL)
Kurokajtki Shirokajiki Mekajiki
Mem. Kagoshima Univ. Res. Center S.Pac, Vol. 2, No. 1,1981
Pacific blue marlin Black marlin Broadbill swordfish
Maluira mazara (JORDAN & SNYDER)
htiomax indicus (CuVIER)
Xiphias gladius LlNNE
Acknowledgement: We wish to thank to Prof. Dr. T. TAMURA of Nagoya Uni
versity, for valuable guidance and encouragement; the crew of Kagoshima-Maru for
specimens and for help in experimental fishing ; Mr.A. KABAYAMA of Nippon Oceanic
Survey Co., Ltd. for help in the dissection of fish eye on board ; Mr. T. KAMISASANUKI of Kagoshima University for help in the operation of the scanning electron microscope, and the Yamashita Fishing Tackles Co., Ltd. for the fishing lures, hooks, and accessories provided.
Table 1.1. Records of the maximum range of vertical distribtion in tunas and marlins determined by fish finder or fishing line, (after KAWAMURA et al, 1981)
Species Maximum depth
in meters Fishing ground
Method Author Yellowfin tuna 200 500 or 150 200 250 278 more
South China Sea
Indian Ocean West Pacific East Pacific Middle Pacific South Pacific Fish finder do. Fishing line do. do. do.
SHIBATA and NISHIMURA (1969) YUKINAWA et al. (1972) NAKAGOME (1958) KYU (1980) MlYASAKI (1980) IWASA (1978) Bigeye tuna 300 500 or 380 245 250 more East Pacific North Pacific South Pacific Middle Pacific West Pacific Fish finder do. Fishing line do. do.
SHIBATA and NISHIMURA (1969)
YUKINAWA et al. (1972) SAITO et al. (1970) SAITO (1975) HiSADAand MORITA (1979) Albacore 380 334 500 or more South Pacific do. Indian Ocean Fishing line do. Fish finder SAITO (1975) IWASA (1978) YUKINAWA et al. (1972)
Bluefin tuna 400 or more North Pacific Fish finder SHIBATA and NISHIMURA (1969)
Striped marlin Striped marlin 340 200 193 South Pacific East Pacific South Pacific Fishing line do. do. SAITO et al. (1970) KYU (1980) IWASA (1978) Pacific blue marlin 250 Middle Pacific Fishing line MIYAKI (1980)
Black marlin 180 East Pacific Fishing line KYU (1980)
Broadbill swordfish 380 240 South Pacific West Pacific Fishing line do. SAITO (1975)
H. IMPORTANCE OF VISION AS INFERRED
FROM BRAIN PATTERN
The fish brain differs considerably both in its outer form and in the inner structure according to taxon or ecological group. Studies of the brains of many kinds of fish have revealed that their behavioural characteristics are reflected in the structure of their brains. This finding has been important in the study of the correlation between
function and structure of the brain (TSUGE et al, 1968). Attempts have been made
to infer fish behaviour from brain structure (UCHIHASHI, 1953; OGAWA, 1967, 1968;
OZAWA and TSUKAHARA, 1973; KAWAMURA, 1979 a).
In this study, we infer the
importance of vision in tunas and marlins from the structure of their brains.
MATERIALS and METHODS
Materials were obtained on board Kagoshima-Maru, training boat of the Faculty
of Fisheries, Kagoshima University, in the Indian Ocean in 1978. Fish were captured
by longline and their heads were fixed in 10%formalin for more than 25 days before
dissection in the laboratory.
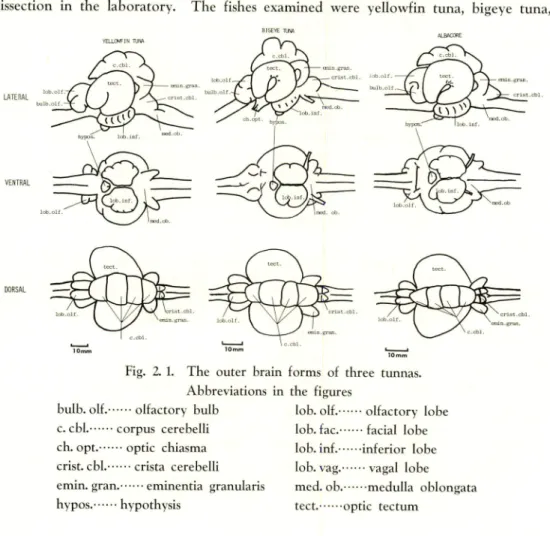
The fishes examined were yellowfin tuna, bigeye tuna,
YEU-O^IN TUttt
Fig. 2. 1. The outer brain forms of three tunnas.
Abbreviations in the figures
bulb. olf. olfactory bulb
c. cbl. corpus cerebelli ch. opt. optic chiasma
crist. cbl. crista cerebelli
emin. gran. eminentia granulans
hypos. hypothysis
lob. olf. olfactory lobe
lob. fac. facial lobe lob. inf. inferior lobe
lob. vag. vagal lobe
med. ob. medulla oblongata
Mem. Kagoshima Univ. Res. Center S. Pac., Vol. 2, No. 1, 1981 7
albacore, striped marlin, and Pacific blue marlin.
RESULTS
Tuna. There is no significant difference in the outer form of the brains of these tunas as shown in Fig. 2. 1.
The telencephalon consists of olfactory bulb and olfactory lobe, neither of which is as well developed as those of nocturnal fishes such as catfish and eel which are known to have highly sensitive chemo- perception. The optic tectum is extremely well developed and has the largest volume. The corpus cerebelli, dorsal to the optic tectum, is likewise large and is separated into four parts by three deep grooves. The medulla oblongata consists of eminentia granularis, crista cerebelli, facial lobe, and vagal lobe: The latter two are small.
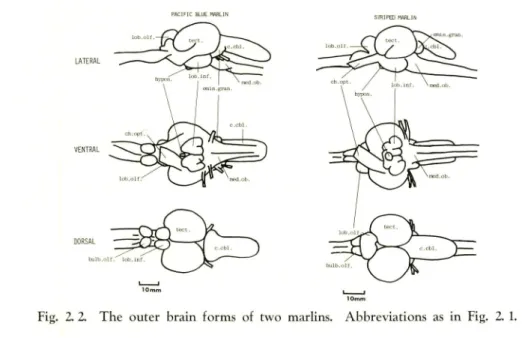
Marlin. There is no significant difference in the outer brain form between the two marlins, but both differ markedly from the tunas (Fig. 2. 2).
I'Al[F]C i^UE ^LIN
Fig. 2. 2. The outer brain forms of two marlins. Abbreviations as in Fig. 2. 1.
The telencephalon consists of olfactory bulb and olfactory lobe, neither well developed. The optic tectum and the corpus cerebelli are equally well developed. The eminentia granularis is less developed than in the tunas; the facial and vagal
lobes are also small.
DISCUSSION
The extremely well developed optic tectum in the tunas and marlins studied indicates that vision is very important to these fishes. Bluefin tuna has been reported by TSUGE et al (1968) also to have well developed optic tectum, corpus cerebelli,
and eminentia granularis. The development of the optic tectum and corpus cerebelli in fish shows the importance of movement perception in feeding (UCHIHASHI, 1953:
TSUGE et al, 1968).
VAN WEEL (1952) and TESTER et al (1954) observed the reaction of yellowfin tuna and little tuna to extracts of food and to chemical substances in a pond and in the sea. The fishes responded to some of the stimuli in the pond but not in the sea. KOYAMA (1957) used inedible lure permiated with squid oil in tuna longline fishing,
and NAKANO (1969) tried to allure albacore with minced fish meat. Neither of them
got the expected response. These show that tunas do not have sensitive chemical perception. This conclusion is supported by the finding that tunas do not have well developed olfactory lobes and facial lobes. The same could be said about marlins.
Development of the corpus cerebelli provides for highly active swimming in fish. Tagging experiments revealed that bluefin tuna and albacore migrate from coastal waters of Japan across the Pacific to the west coast of USA and back (CLEMENS and FLITTNER, 1969). It is well known that striped marlin and Pacific blue marlin migrate latitudinally across the equator (UEYANAGI, 1954; NAKAGOME, 1985 ; ANRAKU and YABUTA 1959). Tunas and marlins have very strong swimming power (WALTER and FlERSTINE, 1964). It is often observed with fish finder that tunas go up and down the vertical range of 200-300 m at very high speed. Based on an echo trace of the fish finder, MORITA and YAMANAKA (1974) reported a vertical swimming speed of 4.6 km / h in yellowfin tuna. This active swimming is reflected well in the extremely well developed corpus cerebelli of tunas and marlins.
According to UCHIHASHI (1953), fish with well developed eminentia granularis and crista cerebelli has a nocturnal habit. Tunas can be fished at night, although the efficiency is lower than in daytime (WATABE, 1958; TSUKAKOSHI, 1979); stomach contents show that they feed even at nighttime (KUME and MORITA, 1966). Since marlins do not have well developed eminentia granularis and crista cerebelli, their activity is probably limited to daytime.
HI. VISUAL ACUITY AS INFERRED
FROM HISTOLOGY ON RETINA
An animal's habit is well reflected in its eyes (WALLS, 1942). O'CONNELL (1963) noted that differences in number and size of various retinal structures in fishes, when
considered along with various other features, suggest certain functional differences. From a comparative study on retinae of various fishes, not only the function of retinal
elements but also the animal's habit can be deduced. KAWAMURA and TAMURA
(1973) and KAWAMURA (1976) discussed the correlation between histological features of retinae and the habits of teleosts. In this study, the retinae of tunas and marlins were observed histologically, and visual axis and visual acuity were determined from cone density.
MATERIALS and METHODS
Mem. Kagoshima Univ. Res. Center S. Pac, Vol. 2, No. 1, 1981
marlin, Pacific blue marlin, black marlin, and broadbill swordfish. Two sizes of bluefin tuna were used : a young one (52 cm fork length) obtained by trolling in the coastal waters off Kagoshima in 1980, and an adult which has been reared from a young
stage in a fish cage in the Bohnotsu Bay and supplied by Bohnotsu Cho. The other
fishes were captured alive by longline on board Kagoshima-Maru in the Indian Ocean in 1978 and 1979.
Photographs were made at right angles to the eye surface to determine the dire
ction of the sighting groove of the pupil. Then the heads of the specimens were
cut. The eyes were enucleated (parts of the cornea at the temporal and dorsal regions were removed as marks for orientation) and fixed in BoUIN's solution for a few days, and transferred into 70 % ethanol.
For the histological examination, each retina was divided into 33 regions as shown in Fig. 3. 1. After routine dioxan -paraffin em bedding, tangential and cross sections (6 /u) were made. Photomicrographs were taken. The cones in 0.01 mm2 of each region were then counted. The cone ellipsoids and visual cell nuclei in a 230 /j stretch of retina were
counted and their ratios (nuclei-cone ratio)
were calculsted. For detailed observation, the retinae were dehydrated in dry ice (TANAKA, 1980), sputtered with gold, and processed for scanning electron microscopy.
To determine the presence of retinal ta-petum, the sections were observed under a polarizing microscope. In addition, the pig ment epithelium was carefully removed tog ether with the choroid from the fresh eye, pressed on paper, dried in the air, sputtered with gold, and then observed under the sca
nning electron microscope.
The minimum separable angle, or visual acuity, was calculated from the density of the cones in the retinal region in which the highest cone density was observed, the assumption being that image lines can be only be resolved when they fall on
cones separated by at least one unstimulated cone (TAMURA, 1957). This angle is
Sina= 1/F[0.1 (1 + 0.25)y2//n]
where a is the minimum separable angle in radians, F is focal distance of the lens, which is 2.55 times the radius of the lens (MATTHIESSEN'S ratio), 0.25 is the degree of shrinkage during the histological procedure, n is number of cones (single and twin cones) per 0.01mm2.
Fig. 3. 1. Regions of the retina for
which cone density
measurements were made.
B, bottom ; D, dorsal; N, nasal ; T, temporal; V, ventral ; OC, optic cleft.
RESULTS and DISCUSSION
VELLOWFIN TUNA
Fig. 3. 2. Cone (sum of twin and single cones) density topography in tunas.
Areas of equal density are delineated.
STRIPED MARLIN
BLACK KARLIN
PACIFIC BLUE MARLIN BROADBILL SW3RDFISH
Mem. Kagoshima Univ. Res. Center S. Pac, Vol. 2, No. 1, 1981
YELLOWFIN TUNA
Fig. 3. 4. Single cone density topography in tunas. Hatched area shows
retinal part where single cones •were absent.
STRIPED MARLIN
BLACK MARLIN
PACIFIC BLUE MARLIN
BROADBILL SWORDFISH
sections of selected tetinal regions are shown for each species in Plates 1-8. Density and size of cones varied with species and retinal regions ; cone densities are given in Appendix table 1. The highest cone density was in the ventral retinal region in tunas and in the ventro-temporal region in marlins. Tamura and Wisby (1963) mabe similar findings. Topographies of cone density distribution are shown in Figs. 3. 2. and 3. 3.
Twin cones were present throughout the retinae of all species studied. While many single cones were found in the retina of broadbill swordfish, they were virtually absent, particularly from the dorsal retinal regions of other fishes especially bigeye tuna. The topography of single cone density in each species is shown in Figs. 3.4 and 3.5.
TAMURA (1957) and LYALL (1957) conducted a histological study of the retinae of many marine teleosts and found that twin cones (or double cones) were most nu merous in deep-water fishes, and suggested that twin cones were intermediate between single cones and rods in sensitivity. Their suggestion was supported by ENGSTROM
(1963), ANCTIL (1969), SOMIYA and TAMURA (1971), KAWAMURA and TAMURA
(1973), and now by this study. The measurement of angular distribution of underwater radiance revealed that the downward component is predominant even at depths of 400 m (JERLOV, 1968). Presumably, the rare appearance of single cones at the dorsal retinal region is an adaptation of the tunas and marlins to such an angular distribution
of underwater radiance. Additionally, the nuclei-cone ratio (Fig. 3. 6 and Appendix
table 2) is higher in the dorsal than in the ventral part of the retina ; the higher ratio
means more numerous rods. The dis
tribution of single cones and rods in the retina seems to harmonize well with the angular distribution of the relative energy of underwater radiance at great depths.
Young bluefin tuna has more nu merous single cones than the adult, sug
gesting a shallower habitat for the for
mer. In support of this is the fact
that young bluefin tuna are captured not by deep set longline but by trolling in surface water. Young broadbill swordfish also have relatively numerous
single cones, again suggesting a change
in depth of habit with growth.
SCHWASSMANN (1968) observed
that the retinal fovea in kelp bass ap
pears along the direction of the sight
ing groove of the pupil. Examining
the relationship between the direction
of the sighting groove and the cone density topography in the tunas and marlins in this study, we found that the oval-shaped pupil and its sighting 50 4 0 0 30 Bigeye tuna Yellowfin tuna Striped marlin
Pacificblue marlin
T VT V VN N DN D DT B
RETINAL REGION
Fig. 3. 6. Visual cell nuclei-cone ratio in each retinal region for tunas (upper) and marlins (lower).
Mem. Kagoshima Univ. Res. Center S. Pac., Vol. 2, No. 1, 1981 13
groove are directed upwarp and slightly nasalward, except in striped marlin and Pa cific blue marlin, which have a triangular pupil with the sighting groove directed nasalward not in harmony with cone density topography (Plate 9). This suggests different visual behaviour of the striped marlin and Pacific blue marlin from the others.
Visual acuity. Vision is most acute when tunas look upward and marlins
fore-upward. The direction of lens movement in accommodation shifts slightly forward
(TAMURA and WISBY, 1963). The minimum separable angle was calculated for the
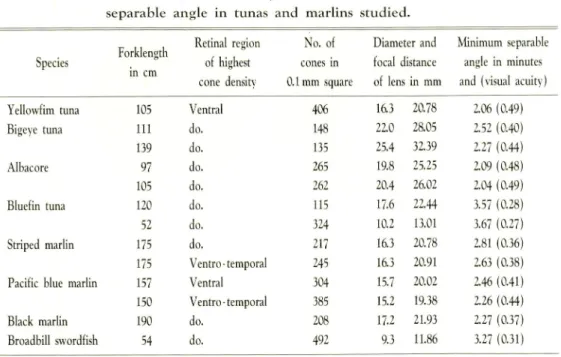
retinal region where the highest cone density was observed and shown in Table 3. 1.
Table 3. 1. Size of fish, cone density, focal distance of lens, and minimum
separable angle in tunas and marlins studied.
Forklength
in cm
Retina region No. of Diameter and Minimum separable
Species of highest cone density cones in 0.1mm square focal distance of lens in mm angle in minutes and (visual acuity)
Yellowfim tuna 105 Ventral 406 16.3 20.78 2.06 (0.49)
Bigeye tuna 111 do. 148 22.0 28.05 2.52 (0.40)
139 do. 13? 25.4 32.39 2.27 (0.44)
Albacore 97 do. 265 19.8 25.25 2.09 (0.48)
105 do. 262 20.4 26.02 2.04 (0.49)
Bluefin tuna 120 do. 115 17.6 22.44 3.57 (0.28)
52 do. 324 10.2 13.01 3.67 (0.27)
Striped marlin 175 do. 217 16.3 20.78 2.81 (0.36)
175 Ventro-temporal 245 16.3 20.91 2.63 (0.38)
Pacific blue marlin 157 Ventral 304 15.7 20.02 2.46 (0.41)
150 Ventro -temporal 385 15.2 19.38 2.26 (0.44)
Black marlin 190 do. 208 17.2 21.93 2.27 (0.37)
Broadbill swordfish 54 do. 492 9.3 11.86 3.27 (0.31)
These values range about 2 to 4 minutes in arc (about 0.3 to 0.5 in visual acuity). NAKAMURA (1967) trained yellowfin tuna to discriminate between vertically and hor izontally striped images and obtained maximum visual acuity value of 0.274, which is less than that obtained here, 0.49. While we determined acuity at the ventral ret inal region, NAKAMURA presented the striped image to be discriminated in front of
the fish and the visual acuity was measured at the temporal retinal region. Our value
for the temporal retinal region is 0.23 which is close to 0.274. It is believed from
the visual axis that tunas and marlins probably see objects from below as silhoueting
targets.
Cone arrangement. Most teleost retinae contain single and twin (or double)
cones and these are frequently arranged to form a regular cone mosaic.
Twin cones in tunas form a regular mosaic of rows in parallel arrangement. A few single cones appear randomly among them (Plates 1-4) but not in the dorsal part of the retina. The long axes of the cross section of the twin cones were oriented in concentric circles relative to the retinal periphery in albacore, yellowfin, bigeye,
YELLOWFIN TUNA ALBACORE
V V
Fig. 3. 7. Cone arrangement in the retinae of five tunas.
BLUEFIN TUNA
and skipjack and parallel to the equator in bluefin. (Fig. 3. 7).
The twin cones were also in regular mosaic in marlins. In most of the retinal
regions, cones were arranged in parallel rows, but a quadrangular mosaic was present in the ventro -temporal part behind the optic cleft of the retina (Plate 5-8).
Cone mosaic patterns reflect to a great extent the degree to which the fish relies
upon vision. LYALL (1957) believed that cone patterns improve the perception of
movement.
The most regular mosaics are found in species feeding on fast-moving
prey. Based on the finding that the square mosaic occurs in the ventral part of the retina and the rows in the dorsal part, ENGSTROM (1963) suggested that the square
mosaic is predominant in acute vision. This was supported by KAWAMURA and
TAMURA (1973). The regular arrangement of twin cones in parallel rows as well as the presence of 3 layers of large horizontal cells indicate the importance of movement
perception in tunas and marlins.
Retinal tapetum. As TSUKAKOSHI (1979) observed, the eye of bigeye tuna ca ptured at night shines brightly as shown in Fig. 3. 8. Observation with the polarizing microscope revealed a dense tapetum lucidum in the pigment epithelium layer. The
tapetum material was square to rectangular in shape (Plate 10). No eyeshine nor
tapetum lucidum was observed in the other tunas and marlins examined.
The tapetum lucidum is considered to act as a mirror, reflecting the light back and thus increasing the effectiveness of photoreceptors, the retina bearing this having predominance in dim light vision (WALLS, 1942).
Mem. Kagoshima Univ. Res. Canter S. Pac., Vol. 2, No. 1, 1981 15
Fig. 3. 8. Bigeye tuna photographed on deck ; note bright
eyeshine.-sensitivity. The bigeye tuna has the largest eye among the tunas (TSUKAKOSHI, 1979), indicating a corresponding higher efficiency in dim light at extreme depths and at night. It was also observed that the outer segment of the cone was ramified in bigeye tuna (Plate 11). Such a ramified outer segment could be a special adaptation for increased sensitivity, or perhaps an artifact of the histological procedure. The retina of bigeye tuna should be observed further under various histological treatments to confirm the ramification.
IV. COLOR VISION AND SPECTRAL SENSITIVITY
Dependence of tunas and marlins on vision was discussed above. While it is very common among fishermen to use colorful lures shaped like squid or fish, color vision and shape discrimination in tunas and marlins have not been demonstrated. Pelagic fishes have retina with cones which are responsible for color vision, but not all of them have color vision (TAMURA et al, 1972). We conducted an electrophy siological study to determine the presence of color vision in tunas and marlins, using the S-potential as an indicator of spectral sensitivity and color vision (KAWAMURA et
al, 1981).
MATERIALS and METHODS
The experiments were carried out in May-July 1975, 1978, and 1979 on board Kagoshima-Maru. The species studied were the yellowfin tuna, bigeye tuna, albacore, striped marlin, Pacific blue marlin, and black marlin. Specimens were captured alive
by longline in the Indian Ocean.
and apparatus for recording S-potential were described by KAWAMURA (1979 b). A glass capillary microelectrode filled with 3M KC1 was used as the recording electrode. The electrical potentials were amplified, displayed on a cathode-ray oscilloscope and
photographed for later analyses. The photostimulator employed was designed to
produce 11 colored lights (almost monochromatic) of equal energy for all wave lengths.
RESULTS and DISCUSSION
S-potentials are classified into two major types from their response pattern to
spectral light. Responses involving hyperpolarization at all wavelengths of light are
the "luminosity type" (L-response); those in which the polarity is wavelength-dependent are the "chromaticity type" (C-response).
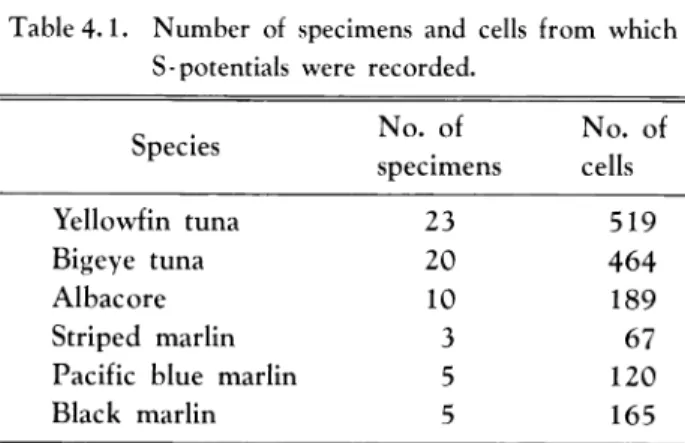
Table 4.1. Number of specimens and cells from which
S-potentials were recorded.
Species No. of specimens No. of cells Yellowfin tuna 23 519 Bigeye tuna 20 464 Albacore 10 189 Striped marlin 3 67
Pacific blue marlin 5 120
Black marlin 5 165
In yellowfin tuna, we observed and recorded responses of 519 cells from the
retinae of 23 fish (Table4.1).
All responses showed simple hyperpolarization at
all wavelengths, and no C-response, even from the inner horizontal cells. Similarresuks were obtained in the other species. Fig.4.1 shows the spectral responses
recorded in the six species. The amplitude of response was higher at blue and blue-green, decreasing toward either side of the spectrum, more remarkably toward the longer wavelengths.
The spectral sensitivity was estimated from the distribution of the relative
amplitude. From Figs.4.2 and 4.3, it can be said that the maximum spectral
sensitivity is between 458 and 492 nm in yellowfin tuna, bigeye tuna, and the three marlins and 492-522 nm in the albacore.
The absence of C-response, that is, absence of color vision in the tunas and marlins studied is a surprising fact, if only for the fishermen who had tried to use as colorful baits and lures as available and thought they were successful about it. TESTER and NAKAMURA (1957) analysed catch records of tuna trolling and showed that there was in fact no preference for any color nor form of lure. It is wellknown that the species studied could be captured by line at night, although the efficiency is
lower than in daytime (WATANABE, 1958). The stomach contents of captured fish
Mem.Kagoshima Univ.Res.Center S.Pac., Vol.2, No. 1, 1981 17
A A.lVN^^vv
/\J\VVV~
""*U**ff*fi
-^aAAA/V^^—r
ol WAVELENGTHFig. 4.1. Spectral responses of S-potential
for three tunas and three marlins. A,
yellowfin tuna ; B, bigeye tuna ; C, albacore ;
D, striped marlin; E, black marlin; F,
Pacific blue marlin.
fishes! body color patterns, considered to have some meaning in interspecific or intraspecific communication (STRASBURG,
1961; MAGNUSON, 1965), are not
particularly colorful. Since these fishes inhabit great depths as shown in Table
1.1, their visual habitat is presumably
far from colorful. All these behavioural
features and observations seems to agree
with the electrophysiological fact-color blindness. Agreement is also shown by the study of MUNZ and MACFARLAND (1977). They found only a single visual pigment in retinal extracts of wahoo, yellowfin tuna, little tuna, black marlin, and Makaira ampla. The total range of Amax in the visual pigments of these
fishes was only 482-486nm. TAMURA
et al (1972) recorded S-potentials from
skipjack tuna, little tuna, and frigate
mackerel; they found no C-response, and concluded that the fishes were color blind.
According to JERLOV (1970), water acts as a monochromator for blue light, and the spectral distribution curves for clear water are peaked in blue light. From the spectral sensitivity determined by electroretinograms in many fishes, KOBAYASHI (1962) found an obvious
correlation between the sensitivity max
imum and the maximum depth at which the fishes were found, that is, the sensi tivity maximum tended to shift toward the shorter wavelength with increse in depth. SVAETICHIN and MACNlCHOL (1958) showed the same tendency based on
S-potential. Our results agree with these findings. The spectral sensitivity maximum
occurs in the blue range for yellowfin and bigeye tuna and the three marlins. The vertical ranges of distribution of these fishes extend from the surface down to 500 m or so. The difference in the sensitivity maximum in albacore can not be explained on the basis of the spectral characteristics of the environment, as NlWA (1976) had
done for two groups of freshwater ugui, because the vertical range of distribution of
albacore overlap with those of the other five species.
According to SAITO (1979),
albacore feeds more actively in deep waters. There thus must be a phylogenetic
explanation for this observed difference.
0.5
tilth
-J • f 1 : ! ; • • -1 1 1 1 1 l. , . Q. < 0.5 > < - I UJ \-9 #t
!
T
It
*
*
# 29 • 6 :if
1.0 % •?
•i
t t • t • • * • 0.54 • • «j» •i
1 • • • • • t f• f
• i • * | t • • #28 • % • 0 » • 5 — j i 1 t i —c WAVELENGTHwhen considered along with other features such as histological characters of their retina and ambient light in their habitat. In the depths, sensi
tivity is most important and color
vision has no value. Even at the
surface, they might see underwater
objects from below not as colored targets but as silhouettes.
V. Attempts to Comfirm the
Importance of Movement
Perception in Feeding
It was estimated from the brain
pattern and retinal structure of the fishes studied that movement percep tion is the most important in feeding. Moreover, commercial fishermen have observed that rough sea conditions increase the efficiency of tuna
long-lines, i.e. catch is increased. Pre
sumably, the rough sea tosses the
gear about and the motion of hooked
bait stimulates the movement perception of fishes. To clarify the observed relationship between catch
and sea conditions, catch records
were analysed.
Data Used
The Kagoshima -Maru has done tuna longline fishing in the Indian Ocean since 1960 to train students and do experiments in the fishing grounds shown in Fig. 5.1. Catch data and sea and weather conditions during the operations were recorded every four hours in the ship's logbook. The Fig. 4.2. Distribution of relative amplitude of response at each stimulus wavelength for tunas.
Numbers beside larger circles show the frequency. Top, yellowfin tuna; middle, bigeye tuna; bottom, albacore. (after KAWAMURA et al, 1981)
Mem. Kagoshima Univ. Res. Center S. Pac., Vol.2, No. 1, 1981 19
relationship between the wave scale (set by the Central Meteorogical Observatory of Japan, see Table 5.1)
and the hook ratio (number of hooked tuna and marlin to number of hooks used) was examined using 9 logbooks in 1960-'62, '67, '71, '74, '75, '77, and '79, involving 154 operations excluding those for gear and lure experiments.
Results and Discussion
Fishing on Kagoshima-Maru was Table 5.1. Relationship between wave
scale and wave height
Wave scale Wave height (m)
0 0 1 0 to less than 0.5 2 0.5 to less than 1 3 1 to less than 2 4 2 to less than 3 5 3 to less than 4 6 4 to less than 6 7 6 to less than 9 8 9 to less than 14 9 14 o r m o r e
Table 5.2. Annual fluctuation of mean hook ratio.
Year Hook ratio Mean Range 1960 3.89 1.70-6.30 1961 5.15 0.37-11.77 1962 4.05 1.14-7.25 1967 2.32 0.70-4.25 1971 3.70 0.00-8.40 1974 2.08 0.80-4.60 1975 1.84 0.00-4.27 1977 2.95 0.30-6.50 1979 2.63 0.56-6.10 IjO a . • 5 3 a. I > - i UJ • 7 • 5 1.0 ! m
1
?
• •#
t • •r
4 0.5 A ® • 1 » tr
i • #20 m\
• — i — i • 16t
WAVELENGTHFig.4.3. Distribution of relative amplitude of response at each stimulus wavelength
for marlins. Top, Pacific blue marlin ;
middle, striped marlin ; bottom, black
repeated 10 to 23 times in one cruise and the catch data for many years were pooled to deduce a reliable relationship between the wave scale and hook ratio. This was done after it was ascertained that the annual catch fluctuations did not noticeably affect the hook ratio (Table 5.2).
Fishing was done during wave conditions 1 to 5, and the hook ratio varied from
0 to 11.77. Plotted together, no correlation appears (Fig. 5.2).
Japanese fishermen believe that motion of the baited hooks is the most important factor in attracting fish ; this belief was experimentally supported by TAMURA (1952). While fish will be attracted more by moving bait than by still bait, increase in wave scale evidently does not increase the catch efficiency. According to YAMANE (1979).
the amplitude of vertical motion
of a float with sinker is much
smaller than that of a regular
wave. Even when the floats move
with high amplitude,due of the rheology of the kuremona line
used (TANIDA, 1980), the tension
caused by the floats' motion at the
upper part of the float line is
probably absorbed in the successive sections. Thus in such small waves
examined here, float motion
probably caused no motion of the bait submerged in 80- 140 m
waters.
Fig. 5. 1. Fishing grounds in the Indian Ocean where longline fishing
was carried out by Kagoshima-Maru.
o < o 2 5 0 1 2 3 4 5 WAVE SCALE
Mem. Kagoshima Univ. Res. Center S. Pac., Vol. 2, No. 1, 1981 21
90°E 100
10°S
Fig. 6. 1. Positions of experimental fishing by
longline with inedible artificial
lure in the Indian Ocean
fckLead
\«;ight
Fig. 6. 2. The inedible
artificial lure used (left)
showing saury inside
(middle) and hook and lead weight inside (right).
VI. LONGRINE FISHING WITH INEDIBLE ARTIFICIAL LURE
Artificial inedible lures have long been used in trolling for tunas and marlins, but only recently in longline fishing. The experimental use of artificial lures, edible and inedible ones,in tuna longline fishing has been done in Japan (KOYAMA, 1957; ASARI, et al, 1965 ; Faculty of Fisheries, Hokkaido University, 1966; Kanagawa Pre fecture Fisheries Experimental Station, 1969 ; YADA et al, 1969 ; TSURUDOME, 1970 ; HARADA and KONAGAYA, 1971; KOBAYASHI, 1975), mostly without success. We tried again to use inedible artificial lure in tuna longline because it is a convenient method to determine the role of vision in the feeding of tunas and marlins.
MATERIALS and METHODS
The experiment was done by the Kagoshima-Maru in the fishing grounds in
the Indian Ocean (Fig. 6. 1) from May to July, 1979. The lures were made of soft
vinyl chloride shaped and colored like a squid 30 cm long and 3.5 cm wide with a
lead weight of 30 g. The lures were attached to hooks as shown in Fig. 6.2. Ad
ditionally, lures stuffed with saury (Fig. 62B) were used to test for the effect of
chemical sense of the fish no catch. Frozen saury was used as control bait. The
longline used was of common construction and one basket had 5 hooks (1MA1, 1972), and 200 baskets were used in a day. A group of 5 baskets was considered as a unit. The units were arranged in various ways (Fig. 6.3) during the 22 operations made. In the first and second operation, 4 units of lure baskets were arranged at one end
NUMBER OF BASKETS 100 150 OPERATION WO. 2 113-17 118-20
Fig. 6. 3. Arrangement of units of lure, saury bait, and stuffed
lure on the experimental tuna longline. Each unit consists of 5 baskets each of 5 hooks.
Table 6. 1. Number of hooks used.
Operation
No.
Saury Lure Stuffed lure
1 900 100 — 2 900 100 — 3 700 300 — 4 700 300 — 5 700 300 — 6 700 300 — 7 700 300 — 8 700 150 150 9 700 150 150 10 700 150 150 11 700 150 150 12 700 150 150 13 790 185 — 14 790 185 — 15 790 185 — 16 790 185 — 17 790 185 — 18 790 185 150 19 790 185 150 20 790 185 150 21 425 325 — 22 450 300 — Total 15995 4555 1200
Mem. Kagoshima Univ. Res. Center S. Pac, Vol. 2, No. 1, 1981 23
of the line for practice in the use of the lure. In the 21st end 22 nd operation, 13 and 12 units of lure basket were arranged in succession as a preliminary to next year's experiments. Therefore, the analysis was made on the catch from the 4 arrangement in the 3 rd to the 20 th operation.
RESULTS and DISCUSSION
Three kinds of tuna and six kinds of marlin were captured in the baskets anal ysed (Table 6.2). Many of the lures were slightly or seriously damaged (Plate 12)
Table 6. 2. Number of hooks tested and number
of fish captured.
Species Saury Lure Stuffed lure
Number of hooks tested 1750 1500 1200
Yellowfin tuna
Bigeye tuna
Albacore
Striped marlin
Pacific blue marlin Black marlin Sailfish
Shortbill spearfish
Broadbill swordfish
probably due to biting by fish other than tuna or marlin since no fragment of the lure was found among the gut contents of the tunas and marlins captured.
The lure was always turned inside out or inverted where tuna or marlin was hooked (Plate 12). It was very difficult to invert the lure by hand and it must have taken the fish a great deal of power to do it. The inverted lure gives valuable insight on the motion of the fish after being hooked.
As the catch of the units was poor, mostly 0 or 1, catches obtained in one arrangement were summed up for two fixed positions of the units: saury-unit-adjacent-to-lure-unit and saury-unit-adjacent-to-stuffed-lure-unit. Thus, results for 30 pairs of saury and lure units, and 12 pairs of saury and stuffed lure units were statistically tested (Tables 6.3 and 6.4). As the frequency distribution of longline
catch was not normal, catches and differences in catch were normalized by a trans
formation using the logarithmic formula Log (N + 2) where N is the actual catch or difference.
The catch with lure was significantly less than that with saury (t= 3.648, ci/=48, 0.001 < p < 0.005). However, the catch with lure was same as that with stuffed lure (t=0.646, d/=20, 0.50 < p). From these results, it can be said that while the catch with lure was poorer than with saury bait, tunas and marlins can be captured by inedible lure, and that there is no apparent effect of chemical sense on the catch.
73 14 6 18 0 2 8 1 0 I 0 0 4 0 0 1 1 0 1 0 1 2 0 0 3 0 1
These findings suggest that tunas and marlins feed mainly by sight.
Using the same lure as in our experiment, MlYAKI (1980) obtained a better catch although 63 % of it was bigeye tuna which have highly sensitive eyes (see above). The maximum depth at which his lure was submerged was calculated as 225 m based on the catenary curve of the longline used. His result shows that tunas feed by
Table 6. 3. Comparison of catch betwen saury and lure.
Operation No. Saury Lure Difference
7 0 7 8 2 6 6 1 5 5 0 5 3-7 8-12 18-20 3 3 0 4 0 4 9 3 6 2 0 2 3 0 3 4 0 4 3 0 3 3 1 2 9 1 8 3 0 3 9 2 7 2 0 2 1 0 1 3 1 2 11 0 11 2 0 2 0 0 0 4 0 4 5 0 5 1 0 1 2 0 2 0 0 0 2 1 1 0 1 1 0 0 0 0 0 0 Total 111 16 95 Mean 3.70 0.53 3.17
Confidence limit of mean
Mem. Kagoshima Univ. Res. Center S.Pac, Vol. 2,No. 1, 1981
Table 6. 4. Comparison of catch between lure and stuffed lure.
Operation No. Stuffed lure Lure Difference
1 1 0 1 0 1 1 2 -1 1 0 1 2 0 2 8-12 and 3 1 2 18-20 1 0 1 0 0 0 0 1 -1 0 1 -1 0 0 0 0 0 0 Total 10 6 4 Mean 0.83 0.50 0.33 Confidence 1imit of m e a n difference at 90% 1evel: —0.065 --0.725 25
sight even at such depths. SAITO et al (1970) recorded an albacore hooked at 207 m
using a depth meter attached to a branch line; he also captured albacore, bigeye
tuna, striped marlin, and broadbill swordfish at depths of 335-382 m with a
specially-designed experimental vertical longline.Fishermen using lure in tuna longline fishing at present report that they get
almost the same hook ratio with lure as with fish bait. It has been shown that inedible lures effectively stimulate sight feeding by fishes. If this gear and its operation
could be improved, lures could completely take the place of fish bait, and costs could
be minimized since lures can be used repeatedly.m CONCLUSION
We have thus shown that tunas and marlins are visual animals; their brain and
eye-retinal structure all point to this.
The visual -optical apparatus of these fishes is
designed to adapt to the low light levels in the lower limits of their vertical
distribution.
Object recognition seems to be by preception of movement and of
contrast with the background, more than of color or form vision. The importance
of movement perception in feeding is clear from trolling operations from surface to
deep water (tens of meters).
A good catch can not be expected with stationary
lures; motion attracts the fish. In tuna longlines set in deep water, motion is some
what precluded. It is a challenge to fishermen and fishery scientists to develop a way
to keep tuna longlines in some form of motion that the fish can appreciate.
this should hold true for tunas and marlins. It is thus worth investigating how these
fishes recognize their prey or their predators, given the apparent absence of color
vision determined presently. Such study should help us design an artificial lure which
is visually effective.REFERENCES
ANCTIL, M., 1969; Structure de la retine chez qualques teleosteens marins du
plateau continental. J. Fish. Res. Bd. Canada, 26(3), 597-628.
ANRAKU, N. and YABUTA, Y, 1959; Seasonal migration of black marlin. Bidl
Nankai Reg. Fish. Res. Lab., 10, 63-71. (in Jap., Engl, abstr.)
ASARI, T., YAMAUCHI, N. and TACHIBANA, K., 1965; (Experimental fishing with
lures). Rep. Fukushima Pre/. Fish. Exp. Stat, 1965, 81-84- (in Jap.)
BLACKBURN, M., 1965; Oceanography and the ecology of tunas. Oceanogr. Mar.
Biol Ann. Rev., 3, 299-322.
CLEMENS, H. B. and FLITTNER, G. A., 1969; Bluefin tuna migrate across the Pacific Ocean. Calif. Fish and Game, 55, 132-135.
ENGSTROM, K., 1963; Cone types and cone arrangement in teleosts retinae. Acta Zooiogtca, 44, 179-243.
Faculty of Fisheries, Kagoshima University, 1966; Data on tuna long-line fishing
experiments using three kinds of bait (saury, squid and false -saury). Data
Rec. Oceanogr. Obs. Explor. Fishing, 10, 86-92.HARADA, M. and KONAGAYA, T., 1971; Studies on the bait of tuna long-line
fishing. Bull Shizuoka Pre/. Fish. Exp. Stat., 4, 1-18. (in Jap., Engl, abstr.)
HAYASHI, S., 1974; Stock assessment of southern bluefin tuna based on
information up to September 1973-Its conclusions and problems. Bull Far
Seas Fish. Res. Lab., 11, 15-65. (in Jap., Engl, abstr.), HONMA, M. and SUZUKI, Z., 1972; A comment to rational utilization of
yellowfin tuna and albacore stock in the Atlantic Ocean. Ibid., 7, 71-112.
(in Jap., Engl, abstr.)HlSADA, K. and MORITA, J., 1980; (Survey on the swimming depths of tunas and
marlins). Proc. Japan Tuna Res. Conf., 1979, 220-224. (in Jap.)
IMAI, T., 1972; Studies on the several raw fish baits in tuna-long -line fishing-I.
Some results of comparative fish bait experiments using for baits frozen
saury, round scad, mackerel and squid for hooking tuna, marlin and sword
fish. Mem. Fac. Fish., Kagoshima Univ., 21(1), 45-50. (in Jap., Engl, abstr.)
IWASA, K, 1978; Proc. Japan Tuna Res. Con/., 1977, 33-35.
JERLOV, N. G., 1968; "Optic Oceanography". Elsevier Publishing Co., Amsterdam,
194 p., 1970; Light, in "Marine Ecology" Vol. 1, Part 1, (ed. by KlNNE, O.), Wiley-Interscience, London, pp. 97-99.
Kanagawa Prefecture Fisheries Experimental Station, 1969; (Experiments of the baits
for tuna longline). Kanagaiva Pref. Fish. Exp. Stat., Data, 143, 22p.
KAWAI, H., 1969; On the relationship between thermal structure and distribution of
Mem.Kagoshima Univ.Res. Center S.Pac, Vol. 2, No. 1, 1981 27
on isotherms on level surfaces, topographies of thermocline, etc. Bull Far
Seas Fish. Res. Lab., 2, 275-303. (in Jap., Engl, abstr.)
KAWAMURA, G., 1976; Morphological study on the retina of Japanese mackerel
Pneumatophorus japonicus (Houttuyn). Mem. Fac. Fish., Kagoshima Univ.,
25, 143-149. (in Jap., Engl, abstr.)
, 1979 a; Fundamental study on application of the vision of spotted mackerel-I. Importance of vision estimated from brain pattern, visual acuity of retina, and accommodation. Bull. Japan. Soc. Sci. Fish., 45, 281-286. (in Jap., Engl, abstr.)
, 1979 b; Fundamental study on application of the vision of spotted mackerel-II. Spectral sensitivity and color vision. Ibid., 45, 549-551. (in Jap., Engl, abstr.)
, NISHIMURA, W, UEDA, S. and NlSHI, T., 1981; Color vision and spectral sensitivity in tunas and marlins. Ibid., 47, 481-485.
and TAMURA, T., 1973; Morphological studies on the retina of two teleosts Scomber tapeinocephalus and Halichoeres poecilopterus. Ibid., 39, 715-726. (in Jap., Engl, abstr.)
KOBAYASHI, H., 1962; A comparative study on electroretinogram in fish, with special reference to ecological aspects. J. Shimonoceki Coll Fish., 11, 407-538.
KOBAYASHI, H., 1975; A study on the success of a fishery with artificial baits for tuna long lines. Bull Japan. Soc. Sci. Fish., 41, 175-182. (in Jap., Engl, abstr.) KOYAMA, T., 1957; Study on bait for tuna long line-1. An articial bait of
latex-sponge shaped like a squid. Bidl Tokai Reg. Fish. Res. Lab., 15, 89-94. (in Jap., Engl, abstr.)
KUME, S. and MORULA, T., 1966; Ecological studies on bigeye tuna-III. On bigeye tuna, Thunnus obesus, caught by "nighttime longline" in the north Pacific Ocean. Bull Nankai Reg. Res. Lab., 24, 21-30. (in Jap., Engl, abstr.) KYU, T., 1980; (Catch of tunas in 10-Kaiku). Proc. Japan Tuna Res. Conf.,
1978, 58-60.(in Jap.)
LAUREC, A. and Le GALL, J. Y., 1975; De-seasonalizing of the abundance index of a species. Application to the albacore (Thunnus alalunga) monthly catch per unit of effort (C.P.U.E.) by the Atlantic Japanese longline fishery. BuIL Far
Seas Fish. Res. Lab., 12, 145-169.
LYALL, A. H., 1957; Cone arrangements in teleost retinae. Quart. J. Micr. Sci, 98,
189-201.
MAGNUSON, J. J., 1965; Coloration of the scombrid fish Euthynnus affinis (Cantor). Copeia, 1965(2), 234-235.
MlYAKI, N., 1980; (Report on the operation of experimental longline with artificial lure shaped like a squid, 1978). Proc. Japan Tuna Res. Conf., 1979, 64-65. (in Jap.)
MORITA, J. and YAMANAKA, H., 1974; Some information as observed from the records of the fish finder in the experimental tuna operation. Bull Far Seas
Fish. Res. Lab., 11, 37-50. (in Jap., Engl. Abstr.)
MUNZ, F.W. and MACFARLAND, W. H, 1977; in "Handbook of Sensory Physiology" (ed. by CRESCITELLI, F), Vol. VII/5, Springer Verlag, Berlin, pp. 259-260.
NAKAGOME, J., 1958; Seasonal variation of hooked-rate and mean fork length and relation among hooked-rate, mean fork length, sexes and migration of black marlin, Makaira mazara, in the western Pacific Ocean. Bidl. Japan. Soc. Sci.
Fish., 23, 525-528. (in Jap., Engl, abstr.)
NAKAMURA, E. L., 1967 ; Visual acuity of yellowfin tuna, Thunnus albacares. FAO
Conference on fish behaviour in relation to fishing techniques and tactics, Bergen, FR : FB/67/E/19, 4p.
NAKAMURA, H, 1965; "Tuna Resources of the World". Japan. Fish. Resources Assoc, Tokyo, 111 p. (in Jap.)
NAKANO, K, 1969; (Response of albacore to artificial bait). Proc. Japan Tuna Res.
Conf., 1968, 162. (in Jap.)
NlWA, H., 1976; Spectral sensitivity of a fish, Tribolodon hakonensis (GuNTHER), retina from two localities. Comp. Biochem. Physiol, 54 A, 263-265.
O'CONNELL, C. P., 1963; The structure of the eye of Sardinops caerulea, Engraulis
mordax, and four other pelagic marine teleosts. J. Morphol, 113, 287-329.
OGAWA, Y., 1967; Morphological transition of the brain components of yellow-tail with their body-growth. Bidl. Japan. Soc. Sci. Fish., 33, 628-635. (in Jap., Engl, abstr.)
, 1968; Morphological transition of the brain components of horse mackerel with their body-growth. Ibid., 34, 11-16. (in Jap., Engl, abstr.) OZAWA, T. and TSUKAHARA, H., 1973 ; On the occurrence of the engraulid fish,
Sto/ephorus buccaneeri STRASBURG, in the oceanic region of the equatorial western Pacific-Life history and distribution. J. Fac. Agr., Kyushu Univ., 17, 151-171. SAITO, S., 1975; On the depth of capture of bigeye tuna by further improved
vertical long-line in the tropical Pacific. Bull Japan. Soc. Sci. Fish., 41, 831-841. (in Jap., Engl, abstr.)
1979; Studies on fishing of albacore, Thunnus alalunga (BONNATERRE) by experimental deep-sea tuna long-line. Mem. Fac. Fish., Hokkaido Univ.,
21, 107-185.
., ISHII, K and YONETA, K, 1970; Swimming depths of large sized albacore in the south Pacific Ocean -I.
Fishing of albacore by a newly designed vertical longline. Bull Japan. Soc. Sci.
Fish., 36, 578-584. (in Jap., Engl . abstr.)
SCHWASSMANN, H. O., 1968! Visual projection upon the optic tectum in foveate marine teleosts. Vision Res., 8, 1337-1348.
SHIBATA, K. and NISHIMURA, M., 1969; Analysis of fish-finder records-Ill. Classification and interpretation of echo trace in the tuna fishing ground.
Bull. Fac. Fish., Nagasaki Univ., 28, 43-67.
SHINGU, C, 1970; Studies relevant to distribution and migration of the southern
bluefin tuna. Bull. Far Seas Fish. Res. Lab., 3, 57-113. (in Jap., Engl, abstr.)
SOMIYA, H. and TAMURA, T., 1971; On the eye of "yellow lens" fishChlorophthalmus albatrossis. Bull Japan. Soc. Sci. Fish., 37, 840-845. (in
Jap., Engl, abstr.)
STRASBURG, D. W, 1961; Banded color phases of two pelagic fishes, Coryphaena
hippurus and Katsmvonus pelamis. Copeia, 1961(2), 226-228.Mem.Kagoshima Univ. Res.Center S. Pac, Vol. 2,No. 1, 1981 29
population utilizing effort and catch statistics with little information on
biological features.
Bid!. Far Seas Fish. Res. Lab., 3, 1-14. (in Jap., Engl,
abstr.)
, 1974; Recent status of resources of tuna exploited by longline fishing in
the Indian Ocean. Ibid., 10, 27-62. (in Jap., Engl, abstr.), KUME, S. and SHIOHAMA, Y., 1969; An indicative note on a role of
permanent thermocline as a factor controlling the longline fishing ground for
bigeye tuna. Ibid., 1, 99-114. (in Jap., Engl, abstr.)
SVAETICHIN, G. and MACNICHOL, E. F., 1958; Retinal mechanism for chromatic and
achromatic vision. Ann. New York Acad. Sci., 74, Art 2, 385-404.
TAMURA, T., 1952 On the senses of food-searching in Lateolabrax Japonicus
(TEMMINCK & SCHLEGEL). Bid!. Japan. Soc. Sci. Fish., 17, 296-300. (in Jap., Engl.
abstr.)
, 1957 ; A study of visual perception in fish, especially on resolving power and accommodation. Ibid., 22, 536-557.
, HANYU, 1. and NlWA, H, 1972; Spectral sensitivity and color vision in skipjack tuna and related species. Ibid., 38, 799-802.
and NlWA, H., 1967; Spectral sensitivity and color vision of fish as indicated by S-potential. Comp. Biochem. Physiol, 22, 745-754.
and WlSBY, W. J., 1963 ; The visual sense of pelagic fishes especially the visual axis and accommodation. Buff. Mar. Set. Gulf and Caribbean, 13, 433-448.
TANAKA, K., 1980; ("Explanatory Diagrams of Scanning Electron Microscopy") (ed. by TANAKA, K. and NAGATANI, T.), Asakura Shoten, Tokyo, pp. 85-104.
TANIDA, K., 1980; On the rheology of netting twine-V. 4 elements model. Bidl
Japan. Soc. Sci. Fish., 46, 281-287.TESTER, A. L. and NAKAMURA, E. L., 1957; Catch rate, size, sex and food of tunas and other pelagic fishes taken by trolling off Oahu, Hawaii, 1951-1955. U. S.
Fish and Wildlife Service, Spec. Sci. Rept.-Fish., No. 250, 25 p.
, YUEN, H. and TANAKA, M., 1954; Reaction of tuna to stimuli-1953. Ibid., No. 134, 33 p.
TSUGE, H., UCHIHASHI, K., SHIMAMURA, H. and TSUKIJI, S., 1968 ; "An atlas of the
brains of fishes of Japan". Tsukiji Shokan, Tokyo, 289 p.TSUKAKOSHI, T., 1979; (The time of day when tunas are captured). Suisan Sekai, 28, 76-84. (in Jap.)
TSURUDOME, M, 1970; On the bait for tuna long-line-I. An artificial bait of vinyl
chloride shaped like a flying fish. Mem. Fac. Fish., Kagoshima Unit'., 19, 81-90. UCHIHASHI, K, 1953; Ecological study of the Japanese teleost in relation to the
brain morphology. Bull. Japan Sea Fish. Res. Lab., 2, 1-166. (in Jap., Engl.
Figs, expl.)UDA, M. and NAKAMURA, Y., 1973; Hydrography in relation to tuna fisheries in the Indian Ocean. Spl. Pub!., mar. biol. Ass. India, 1973, 276-292.
UEYANAG1, S., 1954; Annual variations found in the fishing conditions and size
compositions of makajiki, Makaira mitsukurii (JORDAN & SNYDER). Bull
Japan. Soc. Sci. Fish., 19, 1100-1108. (in Jap., Engl, abstr.)VAN WEEL, P, B., 1952; Reaction of tuna to stimuli-1951, Part II. observations on
the chemoreception of tuna. U. S. Fish and Wildlife Service, Spec. Sci. Rept.
Fish., 91, 8-35.
WALLS, G. L., 1942; "The vertebrate eye and its adaptive radiation".
Hafner,
London, 785 p.WALTER, V. and FlERSTINE, H. L., 1964; Measurements of swimming speeds of
yellowfin tuna and wahoo. Nature, 202; 208-209.WATANABE, H., 1958; On the difference of the stomach contents of the yellowfin
and bigeye tunas from the western equatorial Pacific. Rept. Nankai Reg.
Fish. Res. Lab., 7, 72-81. (in Jap., Engl, abatr.)YADA, S., ABE, S., INOUE, S. and AKISHIGE, Y., 1969; On the hooked-rates of tunas in tuna long-line fishing with luminous baits and non-luminous ones. Bw!i. Fish. Fac, Nagasaki Univ., 27, 95-99. (in Jap., Engl, abstr.)
YAMANE, T., 1979; On the motion of fishing gear against wave action -II.
Vertical motion of a float exposed to sine wave. Bull Japan. Soc. Sci. Fish.,
45, 333-339.YUKINAWA, S., YAMANAKA, H. and MORITA, J., 1972; (Echo Survey on tunas'
swimming depths and oceanography in fishing grounds). Japan Tuna Res.
Mem. Kagoshima Univ. Res. Center S.Pac, Vol.2, No. I, 1981 31
Appendix table 1. Cone density (number of twin and single cones in 0.01mm") of
each retinal region. The fork length of specimen is shown in parenthesis. TC, twin cone; SC, single cone, Sum, sum of twin and single cones.Retinal
Yellowfin tuna (105 cm)
Bigeye tuna (149cm)
Bigeye tuna (111 cm)
region TC SC gum SC/TC TC SC Sum SC/TC TC SC Sum SC/TC
1 133 0 133 0 44 0 44 0 55 0 55 0 2 109 0 109 0 44 0 44 0 54 0 54 0 3 90 0 90 0 37 0 37 0 65 3 68 0.05 4 96 8 104 0.08 39 1 40 0.03 67 3 70 0.04 5 298 73 371 0.24 86 0 86 0 116 0 116 0 6 310 66 376 0.21 105 0 105 0 7 366 40 406 0.11 135 0 135 0 148 0 148 0 8 246 26 272 0.11 78 1 79 0.01 86 8 94 0.09 9 157 10 167 0.06 63 1 64 0.02 54 3 57 0.06 10 105 6 111 0.06 43 0 43 0 53 3 56 0.06 11 107 0 107 0 45 1 46 0.02 75 0 75 0 12 146 0 146 0 42 0 42 0 93 0 93 0 13 79 10 89 0.17 35 1 36 0.03 84 4 88 0.05 14 54 1 55 0.02 40 0 40 0 15 101 0 101 0 47 0 47 0 66 0 66 0 16 136 0 136 0 39 0 39 0 84 0 84 0 17 146 0 146 0 39 1 40 0.03 85 0 85 0 la 94 3 97 0.03 35 1 36 0.03 62 2 64 0.03 lb 84 3 87 0.04 31 2 33 0.06 54 2 56 0.04 3a 87 9 96 0.10 29 1 30 0.03 46 2 48 0.04 3b 80 27 107 0.34 28 15 43 0.54 40 3 43 0.08 5a 178 41 219 0.23 62 0 62 0 5b 138 14 152 0.10 51 2 53 0.04 56 5 61 0.09 7a 210 32 242 0.15 94 0 94 0 111 3 114 0.03 7b 115 11 126 0.10 50 0 50 0 118 0 118 0 9a 118 5 123 0.04 57 0 57 0 62 3 65 0.05 9b 93 8 101 0.09 48 1 49 0.02 41 2 43 0.05 10a 81 6 87 0.07 47 1 48 0.02 51 2 53 0.04 10b 73 3 76 0.04 35 1 36 0.03 11a 71 0 71 0 29 0 29 0 46 3 49 0.07 lib 75 3 78 0.04 29 1 30 0.03 37 2 39 0.05 12a 80 1 81 0.01 30 0 30 0 57 4 61 0.07 12b 83 3 86 0.01 33 0 33 0 48 1 49 0.02
Cntinued from p. 29 Alb, acore (105 cm) Alb: acore (97 cm) Blue: fin tuna (52 cm) Bluefin tuns . (120cm) Striped TC mar SC lin (1 Sum 7 5cm) TC SC Sum SC TC TC SC Sum SC/TC TC SC Sum SC/TC 0.0 TC SC Sum SC/TC SC/TC 74 0 74 0 65 2 67 0.03 144 2 146 0.01 71 2 73 0.03 129 6 135 0.05 59 0 59 0 78 2 80 0.03 213 2 215 0.01 73 1 74 0.01 155 9 164 0.06 58 0 58 0 62 3 65 0.05 131 2 133 0.02 64 0 64 0 218 16 234 0.06 53 1 54 0.02 85 5 90 0.06 188 1 189 0 63 4 67 0.06 218 27 245 0.07 73 7 80 0.10 121 20 141 0.17 200 14 214 0.07 92 4 96 0.04 215 30 245 0.12 221 22 243 0.10 161 28 189 0.17 314 10 324 0.03 97 3 100 0.03 215 15 230 0.14 242 20 262 0.08 225 40 265 0.18 286 9 295 0.03 107 8 115 0.08 198 9 207 0.07 168 1 169 0.01 155 35 190 0.23 296 4 300 0.01 88 1 89 0.01 154 I 1 165 0.05 95 0 95 0 84 18 102 0.21 294 9 303 0.03 90 0 90 0 155 17 172 0.05 44 2 46 0.05 78 5 83 0.06 180 9 189 0.05 95 0 95 0 115 19 134 0.17 49 2 51 0.04 56 6 62 0.11 195 32 227 0.16 63 0 63 0 117 7 124 0.06 45 0 45 0 53 3 56 0.06 173 5 178 0.03 59 0 59 0 115 6 121 0.05 42 1 4 3 0.02 60 5 65 0.08 193 6 199 0.03 58 1 59 0.02 113 22 135 0.19 63 0 63 0 89 6 95 0.07 187 2 189 0.01 80 1 81 0.01 1 19 20 139 0.17 57 0 57 0 57 4 61 0.07 238 10 248 0.04 86 1 87 0.01 125 7 132 0.06 45 0 45 0 146 0 146 0 182 4 186 0.02 74 0 74 0 160 4 164 0.03 61 0 61 0 65 0 65 0 176 5 181 0.03 75 0 75 0 136 6 142 0.03 60 0 60 0 — — — — 154 3 157 0.02 54 3 57 0.06 127 2 129 0.02 40 0 40 0 42 2 44 0.05 138 3 141 0.02 64 1 65 0.02 123 9 132 0.07 52 0 52 0 68 3 71 0.04 163 6 169 0.04 65 1 66 0.02 156 23 179 0.15 44 1 45 0.02 48 8 56 0.17 156 6 162 0.04 72 4 76 0.06 132 30 162 0.29 63 6 69 0.01 156 0 156 0 191 7 198 0.04 93 6 99 0.07 170 18 188 0.11 47 0 47 0 — — — — 167 6 173 0.04 71 1 72 0.01 156 16 172 0.10 128 25 153 0.20 -281 5 286 0.02 79 4 83 0.05 155 10 165 0.06 100 16 116 0.16 90 9 99 0.10 150 6 156 0.04 69 4 73 0.06 146 10 156 0.06 71 1 72 0.01 -— -— 181 5 186 0.03 76 0 76 0 148 13 161 0.09 59 0 59 0 65 4 69 0.06 168 4 172 0.02 63 2 65 0.03 135 14 149 0.10 40 0 40 0 49 4 53 0.08 172 4 176 0.02 79 2 81 0.03 111 32 143 0.29 42 0 42 0 48 4 52 0.08 147 5 152 0.03 60 2 62 0.03 104 32 136 0.31 38 0 38 0 60 2 62 0.03 173 5 178 0.03 58 1 59 0.03 102 6 108 0.06 38 0 58 0 48 2 50 0.04 164 3 167 0.02 63 2 6 5 0.03 118 9 127 0.08 40 0 40 0 57 6 63 0.11 176 4 180 0.02 65 0 65 0 114 5 119 0.04 42 0 42 0 45 1 46 0.02 118 3 121 0.03 50 1 51 0.02 99 8 107 0.08
I
C - <Continued from p. 30 Striped marlin Pacifi c blue Pacific : blue Broa dbill Black marlin (175 cm) marlin (157cm) marlin ( 150 cm) swordfish (54 cm) (190 cm) TC SC Sum SC/TC TC SC Sum SC/TC TC SC Sum SC/TC TC SC Sum SC/TC TC SC Sum SC/TC 184 0 184 0 160 0 160 0 181 0 181 0 170 82 258 0.48 105 13 118 0.12 225 0 225 0 180 0 180 0 174 0 174 0 168 92 260 0.55 111 10 121 0.09 158 46 204 0.29 203 0 203 0 138 7 145 0.05 170 83 253 0.49 123 16 139 0.13 165 50 215 0.30 289 21 310 0.09 282 103 385 0.37 320 155 475 0.48 144 26 170 0.18 158 40 198 0.25 — — — — 198 64 262 0.32 342 150 492 0.44 185 14 199 0.08 s 165 0 178 0 260 0 260 0 240 37 277 0.15 300 135 435 0.45 194 14 208 0.07 g 207 10 217 0.05 304 0 304 0 232 30 262 0.13 272 120 392 0.44 160 16 176 0.10 ~ 158 18 176 0.11 225 5 5 280 0.24 157 42 199 0.27 288 140 428 0.49 136 8 144 0.06 iz 203 16 219 0.08 196 49 245 0.25 165 21 186 0.13 186 90 276 0.48 137 8 145 0.06 §t 140 0 140 0 192 0 192 0 119 20 139 0.15 208 95 303 0.46 143 5 158 0.04 | 180 4 184 0.02 230 8 238 0.04 235 0 235 0 238 110 348 0.46 137 2 139 0.02 d 139 4 143 0.03 210 0 210 0 164 0 164 0 201 98 299 0.49 123 0 123 0 g-136 6 142 0.04 126 23 149 0.18 91 6 97 0.07 136 70 206 0.52 105 5 110 0.05 7*n 136 7 143 0.05 196 0 196 0 143 19 162 0.13 198 98 296 0.50 139 7 146 0.05 f") — — — — 196 14 210 0.09 218 0 218 0 252 123 375 0.49 140 2 142 0.02 c' 175 0 175 0 188 0 188 0 156 0 156 0 196 95 291 0.49 131 0 131 0 n 160 5 165 0.03 190 0 190 0 192 0 192 0 168 80 248 0.48 120 3 123 0.03 5/3 136 13 149 0.10 118 2 120 0.02 101 0 101 0 168 8 5 253 0.51 103 5 108 0.05 ~ 148 18 166 0.12 113 3 116 0.03 92 3 95 0.03 151 77 228 0.51 91 0 91 0 < 156 15 171 0.10 139 3 142 0.02 128 0 128 0 155 75 230 0.48 103 7 110 0.07 183 24 207 0.13 135 10 145 0.07 101 7 108 0.07 150 70 220 0.47 106 5 HI 0.05 N) — — _ — 150 44 194 0.29 117 58 175 0.50 280 140 420 0.50 95 12 107 0.13 •z 146 48 194 0.33 168 63 231 0.38 91 50 141 0.55 204 94 298 0.46 88 10 98 0.12 ., 1 221 0 221 0 189 68 257 0.36 140 68 208 0.49 290 138 428 0.48 148 20 168 0.14 143 36 179 0.25 118 37 155 0.31 120 54 174 0.45 241 122 363 0.51 94 1 3 107 0.14 00 116 28 144 0.24 — — — -100 47 147 0.47 180 93 273 0.52 83 8 91 0.10 104 32 136 0.31 108 52 160 0.48 93 49 142 0.53 172 84 256 0.49 104 2 106 0.02 123 48 171 0.39 96 55 151 0.57 95 25 120 0.25 182 90 272 0.50 105 4 109 0.04 113 52 165 0.46 84 43 127 0.51 87 10 97 0.16 168 8 1 249 0.48 112 0 112 0 116 0 116 0 145 0 145 0 109 3 112 0.03 156 73 229 0.47 110 3 113 0.03 123 48 171 0.39 98 0 98 0 95 6 101 0.06 154 73 227 0.47 107 0 107 0 132 4 136 0.03 137 0 137 0 115 0 115 0 174 83 257 0.48 97 0 97 0 125 8 133 0.06 107 0 107 0 88 3 91 0.03 160 78 238 0.49 95 0 95 0 CO
Appendix table 2. Number of visual cell nuclei and cones found in 230/i of the cross secion (6/a), and their ratios for tunas (upper) and marlins (lower). Figures in parentheses show number of single cones. Retinal region Yellowf in tuna (105 cm) Bigeye tuna (149 cm) Albacore (105 cm) Cone Nucleus Ratio Cone Nucleus Ratio Cone Nucleus Ratio Temporal 21 366 17.43 19 330 17.36 17(1) 331 18.39 Ventro -temporal 34 359 10.57 28 592 21.14 23(1) 316 13.17 Ventral 35 420 12.00 33 599 18.15 27 307 11.37 Ventro-nasal 31 398 12.93 20 553 27.65 21(1) 361 14.36 Nasal 25 401 15.76 21 627 29.86 17 480 28.24 Dorso -nasal 20 447 22.35 19 716 37.68 14(1) 437 29.13 Dorsal 21 434 20.67 22 732 33.27 16(1) 433 25.46 Dorso-temporal 23 499 21.70 17 591 34.76 17 425 25.00 Bottom 20 484 24.20 17 658 38.71 19(2) 537 25.57 Retinal region Striped marlin (1', '5cm) Pacific blue marlin (150cm) Black marlin (190 cm) Cone Nucleus Ratio Cone Nucleus Ratio Cone Nucleus Ratio Temporal 34 448 13.18 34 394 11.59 35 472 13.49 Ventro-temporal 41 415 10.12 33 385 11.67 39 390 10.00 Ventral 41 400 9.76 34 336 9.88 40 387 9.68 Ventro-nasal 34(1) 377 10.77 28(3) 315 10.16 36 359 9.97 Nasal 33 389 11.79 27(3) 455 15.69 27(2) 346 11.93 Dorso-nasal 28 592 21.14 28 547 19.54 29 423 14.69 Dorsal 24 430 17.92 26 437 16.81 28 496 15.71 Dorso-temporal 35 565 16.14 34 434 12.76 3 3 543 16.46 Bottom 31 615 19.84 21 305 14.52 30 473 15.77
Mem.Kagoshima Univ.Res.Center S.Pac, Vol.2, No. 1, 1981 35
Explanation of Plates
Plate 1. Yellowfin tuna. Photomicrographs of tangential sections of visual cell layer
showing the cone mosaic and cross sections in various retinal regions. Mayer's
H.E. stain. B, bottom ; D, dorsal; DN, dorso-nasal; DT, dorso-temporal; N,
nasal; T, temporal; V, ventral; VN, ventro -nasal; VT, ventro -temporal.
Plate 2. Bigeye tuna. As in Plate 1. Plate 3. Albacore. As in Plate 1.
Plate 4. Bluefin tuna. Azan stain. As in Plate 1.
Plate 5. Striped marlin. As in Plate 1. Plate 6. Pacific blue marlin. As in Plate 1. Plate 7. Broadbill swordfish. As in Plate 1. Plate 8. Black marlin. As in Plate 1.
Plate 9. Photographs showing the shape of pupil and direction of sighting groove.
A, yellowfin tuna; B, bigeye tuna; C, albacore ; D, striped marlin; E, Pacific
blue marlin ; F, broadbill swordfish.
Plate 10. Tapetum lucidum found in the retina of bigeye tuna.
A to D, photo
micrographs taken with polarizing microscope. Note the light reflected at the
retinal tapetum can be seen bright in B and D. E, scanning electronmicrograph
showing the retinal tapetum in a pigment epithelium cell.
Plate 11. Photomicrographs (A and C) and scanning elecronmicrographs (B and D)
of the cross sections of the retina of yellowfin tuna (upper) and bigeye tuna (lower). Note the ramified outer segment of cone of bigeye tuna (D). Scale, 1 cm = 30 fi.Plate 12. Photographs showing the seriously damaged lures (top) and hooked albacore
KISS'
w i t
iCiiS^^r •
Wos i *>.•*-i • >'I
?'';• 'r^jS
GOpi
In
M
Staler"#1
1*5f t
«KSS%
i*
KGh
om
";;i;v;vMSSfei
A^*5^\?
>#••%<*(
n^
DN
'
D
N B T '-*. 50/A.-,,.,
..4
N B•
':,
....
-J,
VT V VN 50MI
r
F
2 P $$
fe
- i CO m1
«.Q * r ; *•" •:! t V !#;'r; •" >*•!v« Q
#>.#^ .^;®t'-^'*~
* ft* ~%
*y^%^;^
***^ (-'"•a& ^*» ^-ftu *«* . * . .$ '
,-4X.$
j:#-
>1
> •-• 4 <* >it i.
ISpI fife
Mem.Kagoshima Univ.Res.Center S.Pac, Vol.2, No. 1, 1981
•i .?V:-z Q •t ' ., B -," ... Wv" '*.,-,, o 39
•I!!;- • y.J
ijsSiSliSSEs «£fillli«
« if »>• -'* a, -J 41- C. ;». is" * ! . . ' J * ' . ,. . . ;. :.' '•'• < .4* #».,» ,»i t . .•* B*2* $?iUI ;; - v "Mem. Kagoshima Univ. Res.Center S.Pac., Vol.2, No. 1, 1981 lfOS
•••j{>
s r m
..ill
" :' * » 41 z >i
»-i»v.
:
•.v.-...--63 *"*•*
i Ml®
',-',«*-I S
Mem.Kagoshima Univ.Res. Center S.Pac, Vol.2, No. 1, 1981 ' -. * Q
HP
n a m W M i t tm
-. ••>.•-:.,•' tit * *" * ** *I'M4* it ».,*"•"*JM
»llii it *% * - ^* *'. . ' , . ' • . ,
(!»«.* * •::• iff JtWJIV,
:-iBP« .nm'fffPf
'•!.**-,-.*••>•'"•«•.
"*;
-. •...
43Mem. Kagoshima Univ. Res. Center S.Pac, Vol.2, No. 1, 1981 ;. t 5 rt«r ••