Oceanic Conditions near the Ryukyu Islands in
Summer of 1965
著者
TAKAHASHI Tadao, CHAEN Masaaki
journal or
publication title
鹿児島大学水産学部紀要=Memoirs of Faculty of
Fisheries Kagoshima University
volume
16
page range
63-75
別言語のタイトル
1965年夏季における琉球列島近海の海況
Oceanic Conditions near the Ryukyu Islands
in Summer of 1965by
Tadao Takahashi* and Masaaki Chaen*
Abstract
The general feature of oceanic conditions near the Ryukyu Islands in summer of 1965 is de scribed, on the bases of the results of the Kagoshima-maru and the Keiten-maru cruises for CSK from 20°N to 32°N along the meridian of 125°E and 127°30'E. In the region around the edge of the continental shelf, the structure of the sharp transition between the Kuroshio water and the surface water from the Yellow Sea origin is revealed from the distributions of temperature and salinity and the aid of the temperature-salinity diagrams, which is more remarkable on 125°E. In the region between the edge of the continental shelf and the Ryukyu submarine ridge, iso therms and isohalines slope down toward the submarine ridge from the north in general, and some characteristic aspects related to the current structure are found. The current structure of the Kuroshio in this region is illustrated by means of the dynamic method and the volume trans port of the east component across 125°E is estimated to be ca 29x 106 m3/sec.
1. Introduction
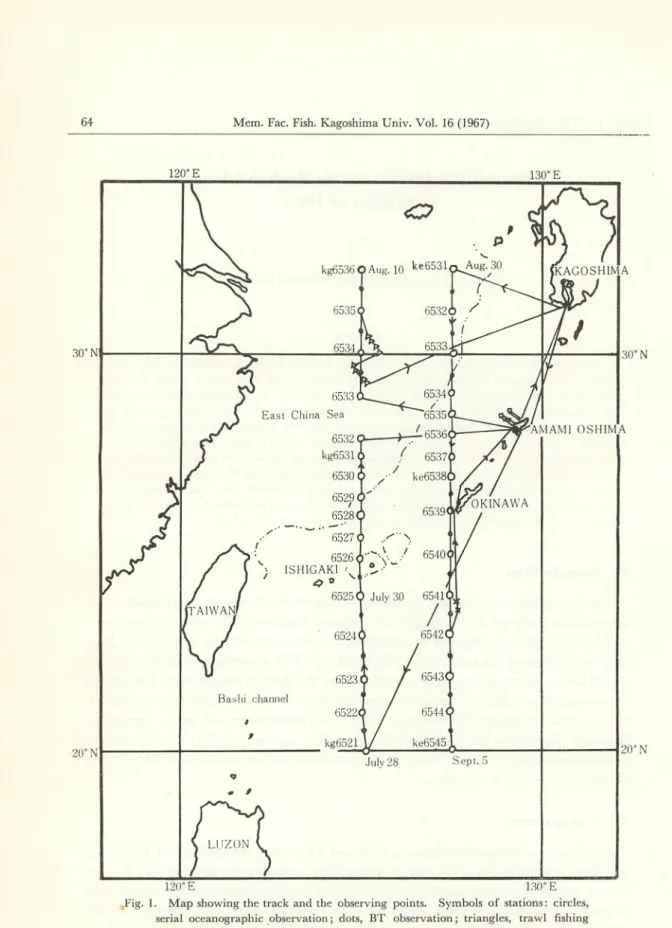
The Kagoshima-maru and the Keiten-maru, Kagoshima University, participate to the Co-operative Study of the Kuroshio and Adjacent Regions (CSK), a new international oceanographic proj'ect, proposed by UNESCO, and the results of their first surveys from 20°N to 32°N along the meridian of 125°E and 127°30'E in summer of 1965 will give a good idea concerning the oceanic conditions near the Ryukyu Islands, since the serveys are systematic very much. Serial oceanographic observations of temperature and salinity from surface to a depth of 1,500 m or 2,000 m, BT observations, and meteorological and biological observations are made at all stations, which are shown in Fig. 1; and some ad ditional observations at several stations, and continuous surface temperature record along
the meridian of 125°E are taken.
2. Temperature
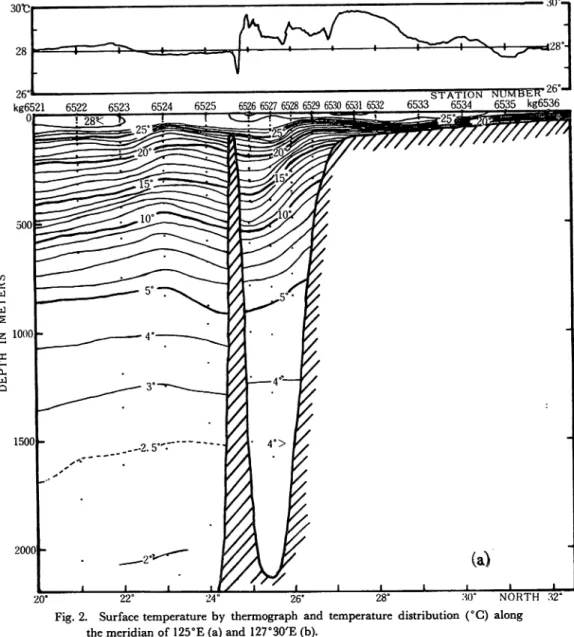
Distribution of temperature between 20°N and 32°N along the meridian of 125°E and
127°30'E is given in Fig. 2 (a) and (b) respectively.
On the meridian of 125°E, con
tinuous record of surface temperature shows clearly three divisions; a region to the south of the Ryukyu submarine ridge, a region on the continental shelf, and a region between the two. A well-mixed surface layer develops to a depth of ca 70 m to the south of the
30" N
20° N
120° E 130° E
120°E 130°E
Fig. 1. Map showing the track and the observing points. Symbols of stations: circles, serial oceanographic observation; dots, BT observation; triangles, trawl fishing experiment; crosses, tuna long-line fishing experiment; squares, deep sea long-line
fishing experiment.
submarine ridge, while it develops only to a depth of ca 30m between 28°N and 30 N
on the continental shelf. The highest temperature in this section is found on the very
surface in a region around the edge of the continental shelf, where the well-mixed surface
30*) kg6521 6522 6523 6524 6525 6526 6527 6528 6529 6530 65316532 6533 6534 6535 kg6536 2 2 1000 -H Q 1500- 2000-20° 22° 24° 26° 28° 30° NORTH 32°
Fig. 2. Surface temperature by thermograph and temperature distribution (°C) along
the meridian of 125°E (a) and 127°30,E (b).
layer disappears, suggesting that a process of upwelling of lower temperature water just
below exists. Below the surface layer, the isotherms are parallel on the continental shelf and close to the bottom. To the south of the edge of the continental shelf, the isotherms
STAITION NUMBER ke6545 6544 6543 6542 6541. 6540 6539 6538 6537 6536 6535 6534 6533 6532 ke6531 o -—- , ^! '"V- ; i ' • -—• i—-Id 2 1000 -a, w a 1500 -2000 NORTH 32° Fig. 2. (b)
of 27 -19 C slope up toward the south from the middle point between the edge of the continental shelf and the submarine ridge. This fact seems to correspond to the existence of so-called warm core in the Kuroshio Extension and the Kuroshio south of Honshu (Masuzawa; 1964, 1965). The isotherms less than 18°C slope down toward the subma rine ridge, suid horizontal temperature difference between the continental slope and the submarine ridge is ca 7 C in a layer between depths of 200 m and 400 m. This sharp slope of isotherm corresponds to a strong current. To the south of the submarine ridge, the isotherms below the surface layer slope slightly up to 23°N and slightly down from here toward the south, showing an upwelling of the lower water around 23°N. The slope of isotherms disappears below a depth of ca 1,000 m in the region between the continental slope and the submarine ridge, while to the south of the submarine ridge it remains down to a depth of 1,500 m or more. Numerical value of temperature below ca 1,200 m layer to the north of the submarine ridge is ca 1 C higher than that to the south of the sub
STATION NUMBER
kg6521 6522 6523 6524 6525 6526 6527 6528 6529 6530 6531 6532 6533 6534 6535 kg6536
Of ! —
22° 24° 26° 28° 30° NORTH 32°
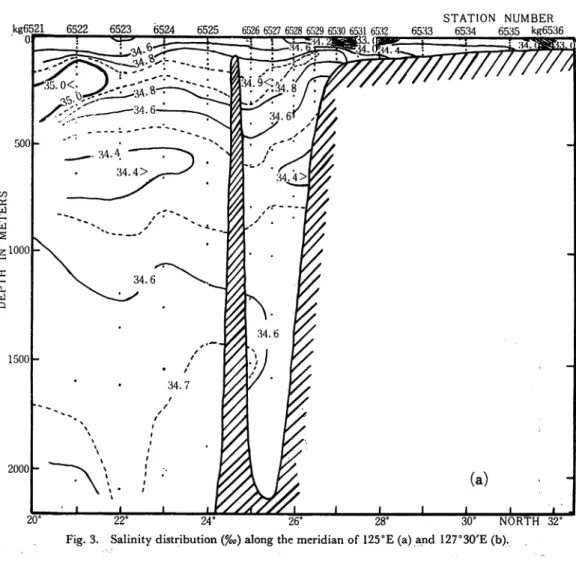
Fig. 3. Salinity distribution (%0) along the meridian of 125°E (a) and 127°30'E (b).
On the meridian of 127°30/E, the well-mixed surface layer is ca 40 m depth both on
the continental shelf and to the south of the submarine ridge, which is shallower than that on 125 E, and the numerical value of temperature in this layer is higher than that on
125°E. In a region between the edge of the continental shelf and the submarine ridge
this layer almost disappears, where the highest temperature in this section exists on the top layer, that is, the thermocline becomes more or less indistinct. To the south of the edge of the continental shelf, the second thermocline can be found in a layer between 400 m and 600 m depth, though it is rather weak. The second thermocline slopes down toward the submarine ridge from the north with the maximum inclination on the conti
nental slope. The water mass (20-15°C) between these two thermoclines seems to correspond to the 17°-water in the Kuroshio Extension (Masuzawa, loc. cit.). This water
mass have a large volume and may be important together with two thermocline structure for the dynamics of the Kuroshio.
STATION NUMBER ke6545 6544 6543 6542 6541 6540 65.39 6538 6537 6536 6535 6531 6533 6532 ke6531 OS w w 2 1000 Q 1500 2000 20° J I I L 22° 24° I J_ 26° 28° NORTH 32° Fig. 3. (b) 3. Salinity
Distribution of salinity between 20 N and 32 N along the meridian of 125 E and 127 30'E is given in Fig. 3 (a) and (b) respectively.
On the meridian of 125 E, two remarkable salinity minima are found on the surface; one from the Yellow Sea origin to the north of 31 30'N, and the other around the edge of the continental shelf. The thin surface water characterized by salinity minimum of
lower than 34.0 %o around the edge of the continental shelf may be a branch of the
Yellow Sea water mixtured with the coastal water in the East China Sea. Below the
surface water, a tonguelike protuberance of salinity maximum higher than 34.8 %0 extends to the north from south in a layer between 100 m and 300 m depth, and a part of this maximum creeps further north on the continental shelf, where intense mixing with the
be-tween the subsurface salinity maximum and the thin surfacesalinity minimum on the edge
of the continental shelf is remarkable. The intermediate water of salinity Tower than
34.4 %0 is found in a layer around 600 m to the south of the submarine ridge, and a
part of it can be found in contact with thecontinental slope on the same depth.
Isohalines
in a layer between depths of ca 100m and 600 m slope greatly down from the north to
the south in the region between the edge of the continental shelf and the submarine ridge.On the meridian of 127°30'E, a surface water characterized by salinity lower than
34.0 %0 is found on the continental shelf, especially lower than 33.0%0 in 32°N, showing
the Yellow Sea origin. The thin surface water found around the edge of the continental
301C32.5 33.0 33.5
fft^Q 0^ (ke6531)
34.0 34.5
i(k$529) w £(ke6536) g
l0^--(ke6534L_J-35.0 %o
32.5 33.0 33."> 34.0 34.5 35.0 %>
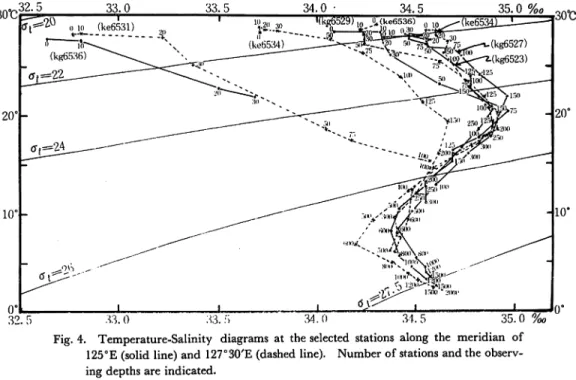
Fig. 4. Temperature-Salinity diagrams at the selected stations along the meridian of 125°E(solid line) and 127°30'E (dashed line). Number of stations and the observ
ing depths are indicated.
•30°C
shelf on 125°E is not distinguished on 127°30/E.
A tonguelike protuberance of salinity
maximum higher than 34.8 % extends to the north from the south in a layer between
100 m and 300 m depth, a part of this maximum creeps further on the continental shelf.
The lower part of this salinity maximum water corresponds to the 20-15°C water be
tween the thermoclines. A sharp transition between the subsurface salinity maximum and the surface minimum near the edge of the continental shelf is somewhat weaker than that of 125°E. To the south of the submarine ridge, the intermediate water of salinitylower than 34.4 %0 is clearly found, while it is not so distinct in the region between the submarine ridge and the continental slope. Numerical value of the salinity minimum of the intermediate water on 127°30/E is ca 0.2 % lower than that of 125°E.
kg6521 6522. 6523 6524 6525 6526 6527 65286529 6530 65316532 STATION6533 6534NUMBER6535 kg6536 ~- • ~^^ 500- T
^Ssmmmntniin)
30° (a) NORTH 32° Fig. 5. Thermosteric-anomaly (cl/ton) distribution along the meridian of 125°E (a) and127°30/E (b). On 125°E section, the block of solid earth surrounded by the conti nental slope and the straight line indicate the imaginary water mass.
4.
Temperature-Salinity Relation
Temperature-salinity diagrams at several stations are shown in Fig. 4. Those for four
stations; Ke6543 (22°N, 127°30'E), Kg6523 (22°N, 125°E), Kg6527 (25°30'N, 125°E),
and Ke 6536 (28°N, 127°30'E), selected approximately along the path of pre-Kuroshio
and the Kuroshio itself, are quite similar to each other, showing the Kuroshio water
characterized by a salinity maximum at a depthof 150-200 m and by a salinity minimum
at a depth of ca 600 m, though the salinity minimum at ca 600 m at the last point, St. Ke6536, is obscure.
T-S diagram for St. Kg6529 (26°30'N, 125°E) is also similar to those stated above, though some discrepancies are seen above 75 m depth. The water characteristics at 75 m for this station corresponds to those at ca 150 m depth for the four stations stated
WD DC 2 STAITION NUMBER ke6545 6544 6543 6542 6541 6540 6539 (6538 6537 653665356534 6533 6532 ^6531, PL. •-^ ' 1000 3C H Q 1500 2000 20° 22° 24° 26° Fig. 5. (b) 28° 30° - L -L NORTH 32°
above. T-S diagram for St. Ke6534 (29°N, 127°30,E) shows a result of mixing pro cesses between the Kuroshio water and the Yellow Sea water, characterized by extremely low salinity of surface layer, which is clearly represented by T-S diagrams for Kg 6536 (32°N, 125°E) and Ke6531 (32°N, 127°30'E).
5. Current Structure
The current structure can be illustrated from the mass field, assuming the current field in approximately geostrophic equilibrium. Thermosteric anomaly is adopted for mass field, and the distributions along the meridian of 125°E and 127°30/E are shown in Fig. 5. On both sections, in the region between the edge of the continental shelf and the submarine ridge, high value of horizontal gradient toward the south of the thermosteric anomaly exists, showing the concentration of the current system into this region. On 125°E, in the top layer around the edge of the continental shelf thermosteric anomaly is
en W H W 3C H W Q kg6525 STATION NUMBER 6526 6527 6528 6529 6530 6531 6532 1000 -1500 2000 24° 26° NORTH 28°
Fig. 6. The east-west component (cm/sec) of calculated relative current velocity across
higher than '700 cl/ton and to the south from here horizontal gradient is great.
A
tonguelike protuberance of subsurface high salinity extending to the north from the south
corresponds to thermosteric anomaly of 400-200 cl/ton, and the water between the two
thermoclines along 127°30/E corresponds to thermosteric anomaly of 300-200 cl/ton.
On the basis of this figure on 125°E section, the dynamic calculation is attempted to get
the current distribution, by means of a method assuming the imaginary moving water mass
instead of the solid earth after B. Groen (1948) (see Fig. 5). For the no motion layer,1,200 m level is adopted, where horizontal gradient almost disappears in temperature
and thermosteric anomaly distributions.
The east-west component of relative current
velocity calculated from the method is shown in Fig. 6. It is seen in the figure that the
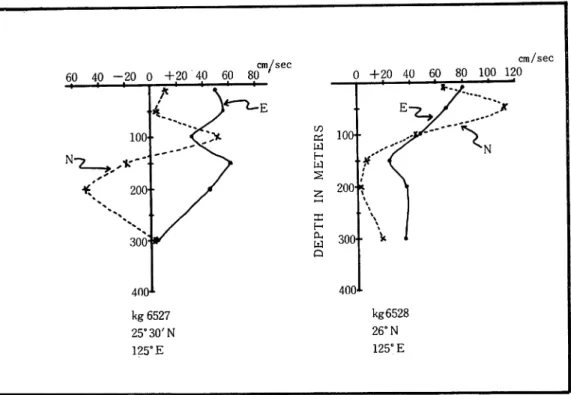
60 40 -20 0 +20 40 60 cm/sec 80 ' cm/sec 0 +20 40 60 80 100 120
\
"*-E 100-N-7 --.—: \ 200* *% 300: in & w H W s z DC H cu W Q 100 200-300-•f i
\
\
. \
J
400- 400 kg 6527 kg6528 25°30'N 26° N 125° E 125° EFig. 7. Vertical profile of the east-west and north-south components (eastward, north ward positive) of the directly measured current velocity relative to 1,000 m.
Kuroshio is situated on the continental slope and that the maximum speed of the east
component having ca 100 cm/sec is found in the surface layer between Kg 6527 (25 30'N,
125°E) and Kg 6528 (26°N, 125°E), where the warm core exists (Fig. 2). On the edge
of the continental shelf and near the submarine ridge, the current flows westwards.At two stations, Kg6527 and Kg6528, the relative currents referred to a depth of
1,000 m are measured by means of two current meters of Ekman-Mertz type. The max
imum current speed is 132.0 cm/sec with direction of 31° at a depth of 50 m at St.
Kg6528. The east-west andnorth-south components of observed relative current velocity
are shown in Fig. 7. The east component of current occurs through all the depths, and
the speed is higher than 60 cm/sec at a depth of 150 m at St. Kg 6527 and at depths of
10 m and 50 m at St. Kg6528. A rough estimation of the current structure of theKuroshio across the meridian of 125°E in the region between the edge of the continental
shelf and the submarine ridge, stated above, can be considered as reliable on the bases of
these observed facts.
From the current structure (Fig. 6), the volume transport of the east component across
the meridian of 125°E is estimated to be ca 29 X106 m3/sec. This amount corresponds
to the volume transport of ca 31X106 m3/sec, assuming that the Kuroshio flows toward
the east-northeast on an average according to the results of two current meter observation
(Fig. 7). Other information concerning the volume transport of the Kuroshio in thesame
season of the year isgiven byNagasaki Marine Observatory, which are47.3 X106 m3/sec,
35.8 X10⁶ m3/sec, and 28X106 m3/sec, of the South and North Taiwan and at the
central area in the East China Sea respectively (Fujita, Fukase and Tsuchida, 1967).
The numerical value of the volume transport in the East China Sea is nearly equal to
that across the meridian of 125°E, presented in this paper, though the volume transport
of the Kuroshio in the East China Sea is expected to be variable very much according to
many changing factors.
6. Conclusion
An oceanographic description near the Ryukyu Islands is presented, based on oceanog
raphic data of the Kagoshima-maru and the Keiten-maru cruises for CSK in summer of
1965 along the meridian of 125°E and 127°30'E respectively.
The well-mixed surface layer is not found on the edge of the continental shelf on 125°E,
neither do in the region between the edge of the continental shelf and the Ryukyu sub
marine ridge on 127°30/E. On the edge of the continental shelf the sharp transition
between the Kuroshio water and the thin surface water from the Yellow Sea origin is
found, which is more remarkable on 125°E and weaker on 127°30'E. To the south of the edge of the continental shelf isotherms and isohalines slope down to the submarine ridge in general, but a warm-core in the surface layer on 125°E is found; and the second
thermocline on 127 30'E exists. To the south of the submarine ridge, an upwelling of
the lower water seems to take place around 23°N. The slope of isotherms remains downto a depth of 1,500 m or more, while to the north of the submarine ridge it disappears
below a deph of ca 1,000 m.
Two salinity minima are found in the toplayer on thecontinental shelf.
A tonguelike
protuberance of salinity maximum extends to the north from the south in a layer between
100 m and 300 m depth, and a part of it creeps on the bottom of the continental shelf.
An intermediate salinity minimum of lower than 34.4 % is found in a layer ca
600-700 m depth.
Temperature-salinity relations at several stations in the Kuroshio both sides of the Ryukyu Islands are quite similar to each other. In the northern side of the Kuroshio,
the Yellow Sea water with extremely low salinity exists.
Direct current measurement at two stationsin the Kuroshio (25°30'N and 26 N, 125 E) shows the east component through all the depths and the maximum current speed of
132.0 cm/sec with direction of 31° at a depth of 50 m in 26°N.
The current structure
of the Kuroshio in a region between the edge of the continental shelf and the submarine
ridge on 125°E, obtained by the dynamic method, is consistent with the direct measure
ments. The eastward volume transport of the Kuroshio referred to 1,200 m is estimated
to be ca 29 X 106 m3/sec.
The authors wish to express their hearty thanks to Capt. S. Ueda, Kagoshima-maru, and his crew, and to Capt. T. Henmi, Keiten-maru, and his crew, for their works in
observations on the sea.
References
Fujita, K., S. Fukase and T. Tsuchida (1967): Summary of oceanographic conditions of the Sea West of Japan in 1965 (in Japanese), four. Oceanogr. Soc. fapan, 8(1), 42.
Groen, P. (1948): Methods for estimating dynamic slopes and current in shallow water, f. Marine
Res., 7 (3), 313-316.
Masuzawa, J. (1964): Atypical hydrographic section of the Kuroshio extension. Oceanogr. Mag.,
16(1-2), 21-30.