関西学院大学リポジトリ
181
0
0
全文
(2) Contents. Chapter 1: InterMolecular Interactions and Crystallization Behavior of Biodegradable. Polymer Blends between Poly (3-hydroxybutyrate) and Cellulose Acetate Butyrate Studied by DSC, FT-IR, and VVAXD. Experimental Section 32. Results and Discussion 35. References and Notes 44 Chapter 2: Effects of Intermolecular Hydrogen Bondings on Isothermal Crystallization. Behaviors of Polymer Blends of Cellulose Acetate Butyrate and poly(3-hydroxybutyrate). Experimental Section 69 Analysis airid Discussion 75. i.
(3) Chapter 3: Simultaneous Synchrotron SAXS/VVAXD Study on Composition Fluctuations, Cold-Crystallization, and Melting in Biodegradable Polymer Blends of Cellulose Acetate Butyrate and Poly(3-hydroxybutyrate). '. Experimental Section 110. 112. References and Notes 125 Chapter 4: Effects of Hydrogen Bond Intermolecular Interactions on the Crystal Spherulite of Poly(3-hydroxybutyrate) and Cellulose Acetate Butyrate Blends: Studied. by FT-IR and FT-NIR Imaging Spectroscopy. Experimental Section 145 Results and discussion 147 '. List of Publications 173. ii.
(4) List ofAbbreviations. CAB. cellulose acetate butyrate. CC. cold crystallization. DSC. differential scanning calorimetry. Dc. lamellar thickness. Da. thickness ofthe lamellar amorphous region within lamellar assembly. FT-IR. Fourier transforms infrared. FT-NIR. Fourier transform near infrared. GM. a number of assemblies or grains. HCAB. the high molecular weight cellulose acetate butyrate. HBs. hydrogen bondings. IR. infrared. intra. intramolecular interaction. inter. intermolecular interaction. Iobs(q). the observed scattering intensity as a function of scattering vector g. I,(q). the corrected scattering intensity as a function of scattering vector g. L. interlamellar spacing. LCAB. the low molecular weight cellulose acetate butyrate. MCT. mercury cadmium telluride. NM. the number ofthe lamellar within the GM-th assembly. NIR. near infrared. PC. principle component. PCA. principle component analysis. PHAs. polyhydroxyalkanoates. PHB. poly(3-hydroxybutyrate). iii.
(5) PLLA. poly(L-lactic acid). POM. polarized optical microscope. q. scatterlng vector .. 9m. the magnitude ofthe scattering vector q at the SAXS maximum due to the long-spacing. SAXS. small angle X-ray scattering. T. a characteristic temperature close to melting temperature ofPHB. -163OC Tc. crystallization temperature. Tcc. onset temperature for cold crystallization temperature. Tcc,pHB. onset temperature for cold crystallization temperature of. poly(3-hydroxybutyrate) Tcc,cAB. cold crystallization temperature ofcellulose acetate butyrate. Tg. glass transition temperature. Tg,h, Tg,h,sAxs. higher glass transition temperature ofthe blends measured by SAXS. Tg,1 , Tg,l.Dsc. lower glass transition temperature ofthe blends measured by DSC. Tm. melting temperature as determined by the temperature at the peak ofthe. highest melting endotherm in DSC.. WAXD. wide arigle Å~-ray diffraction. WCAB. weight fraction of CAB in the blend ofPHBI CAB. wZTB. the q-Fourier mode ofthe local composition ofCAB in the. amorphous phase. wZTB. biased from the bulk (or net) blend composition wcAB.. Xc. crystallinity. gbL,pHB. average volume fraction ofthe PHB lamellae in the assembly. iv.
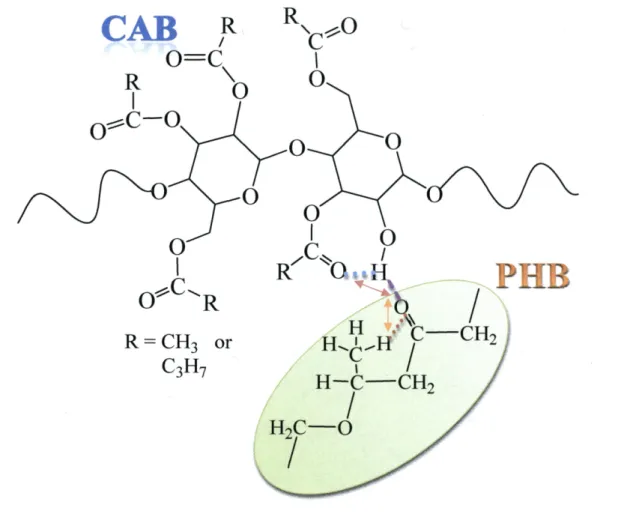
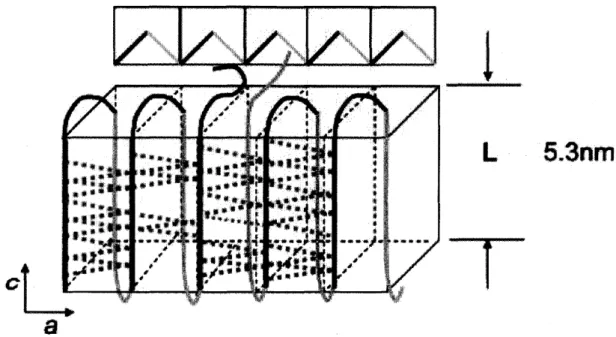
(6) Introduction This. thesis aims to explore the exchange of intermolecular and intramolecular interactions, the crystallization behavior, phase separation and structural properties of. polymer blends between poly (3-hydroxybutyrate) (PHB) and cellulose acetate butyrate (CAB) using vibrational spectroscopy, polarized optical microscopy (POM), differential scanning calorimetry (DSC), wide angle X-ray diffraction (WAXD), and small angle X-ray. (SAXS). The inter and intramolecular interactions are significant factors and play important roles in crystallization behaviors, crystal growths, crystal morphologies, and phase behaviors. of polymer blends. In the case of semicrystalline polymer, especially biopolymers, the interactions and crystal behavior 1argely affect the manufacturing processes and product. properties. Therefore, the understandings of the exchanges of inter and intramolecular interactions and the phase behavior in the polymer blends are very essential for controlling the properties of new materials and for wide applications of the biodegradable polymers.. In the present thesis, biodegradable polymers PHB and CAB are mainly analyzed for exploring the exchanges of inter and intramolecular interactions and crystallization behavior. in polymer blends. The chemical structures ofPHB and CAB are drawn in Figure 1(A) and (B), respectively. As it can be seen from their chemical structures of PHB and CAB, strong. absorption bands associated with C=O, O-H, C-C, and C-H groups are presented. Moreover,. the intermolecular interactions between C=O groups of PHB and O-H groups of CAB (C=OeeeH--O) should be presented. Figure 2 demonstrates the ideal model of the change of. the inter and intramolecular hydrogen bonding interactions. Therefore, vibrational spectroscopies, infrared (IR) and near infrared (NIR) spectroscopies, are efficient teclmiques. to preciously characterize their localized structural changes and express their minute interaction in the blends during the crysta11ization processes with heating, cooling and •isothermal temperatures.. Besides the vibrational spectroscopic investigations, the thermal properties of the blends such as glass transition temperature (Tg), cold crystallization temperature (Tcc), arid. melting temperature (Tm) are explored by using DSC. The FT-NIR imaging is also established and investigated for revealing the growth of spherulite in the blends. Moreover, the phase. behaviors and the crystal structures both of PHB and CAB in the blends are detected and deeply discussed by the simulated wide angle X-ray diffraction (WAXD) and the small angle X-ray scattering (SAXS).. -1-.
(7) The novelty and originality ofthis thesis can be described as follows: the first point is. that the exchanges between the intra-molecular hydrogen-bonding interactions of the neat. PHB (C=OeeeH--C) and the intermolecular interactions of CAB and PHB (C=OeeeHL-O) are interpreted through investigating various rat•ios of blends with temperature-dependent IR spectroscopy combining with the results of thermal behavior that obtained from DSC and the crystal structures from WAXD. In this study, the absorbance and second derivative spectra in. C=O and O-H stretching vibration regions ofthe neat PHB, neat CAB, and PHB/CAB blends of various ratios are identified and deeply analyzed by monitoring the intensity changes of. their characteristic IR bands with temperature. The second point is that the effect of the. intermolecular hydrogen bonding and the effect of molecular weight on the overall crystallization process are extremely revealed. The transformation of phase structure from amorphous melt of the blends to the intermediate state, the primary crystallization process,. and the secondary crystallization process are deeply explored with IR spectroscopy. The changes of IR spectra in C=O, C-()-(), and C-H bending regions, which are involved in the. intramolecular hydrogen bondings (C=OeeeH-C) of the neat PHB, are mainly analyzed for this point. Furthermore, the Avrami calculations of various characteristic crystalline bands are carried out for interpreting the detailed crystal kinetic behavior in the blends. The third point. is that the phase behavior of PHB and CAB in the PHBICAB blend is explored by using the. DSC, simultaneous WAXD, and SAXS measurements in one heating process. Two glass transition points of the blend are detected and the crystal structures at high temperatures are. studied. We also propose the model of cold crystallization processes of the as-prepared PHBICAB blend samples following the change ofincreasing temperature. The fourth point is that the conformational evolution and difference of the spherulite during the isothermal. crystallization process of the PHBICAB blend are studied using IR and NIR imaging spectroscopies. The images of specific bands ratios in the regions of 1St overtone C= O and the. 2"d overtone C=O stretching vibration are proposed. Multivariate analysis as PCA is used to analyze the variation of localized NIR spectra in spherulite.. 1. Introduction of Poly (3-hydroxybutyrate) (PHB) and Cellulose Acetate Butyrate. (CAB) Nowadays, the management of plastic waste has become a serious environmental problem, especially the plastic from petrochemical products. The biodegradable plastic is one. of the perfect products that can be expected for replacing the commercial petrochemical. -2-.
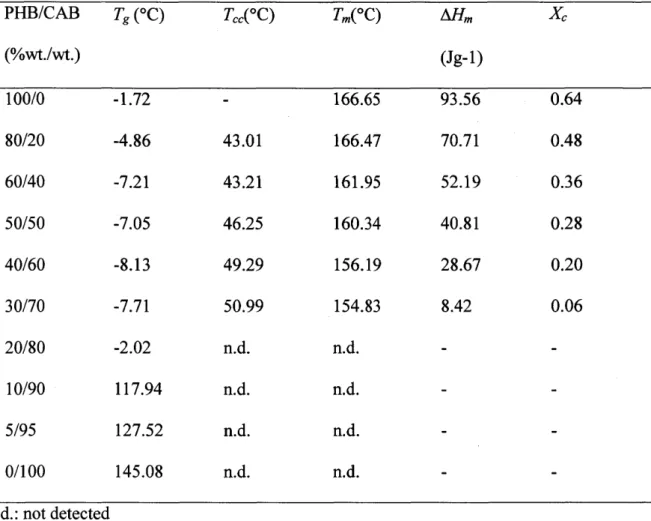
(8) products. Poly (3-hydroxybutyrate) (PHB) is a class of the most common biopolymer from. polyhydroxyalkanoates (PHAs). PHAs are the accumulated substances produced by micro organisms. Lemoignei was the first one who isolated and characterized in 1925. Then, numerous research groups begun to study the biosynthesis, degradation, structural and mechanical properties of PHAs.2-5 PHB is accumulated as a membrane enclosed inclusion in many bacteria at up to high as 900/o of the cell dry weight under conditions of nutrient stress and acts as a carbon and energy reserve.6 It has mechanical properties that are very similar to. the conventional plastics like polypropylene or polyethylene. PHB can be extruded, molded,. spun into fibres, made into films, and used to make heteropolymers with other synthetic polymers. In spite of its numerous advantages, PHB has not yet been able to fu11y replace conventional plastics on a large scale because of its high cost.7. PHB is an intriguing semicrystalline polymer as containing the amorphous part and crystalline part. The crystal structure ofPHB was reported as orthormbic system P2i2i2i(D42) with a= 5.76 A, b = 13.20 A, c= 5.96 A.8 The crystalline structure is illustrated in Figure 3.. Usually, the crystal spherulites of PHB forrn the banded spherulites.9' iO The band spacing depends on the crystallization temperature. It is smaller at lower crystallization temperatures.. The spherulite from melt twists and presents the banded texture morphology due to the elastic bending of radically oriented lamellar ribbons where the folding directions on opposite faces ofthe lamellae are approximately orthogonal and incline to the radial direction, leading to the. formation of helicoidally twisted lamellae.9' ii It was shown by X-ray microdiffraction that the crystallographic a axis is radial in PHB spherulites, with the b and c axes rotating about. this axis.i2 The spiraling spherelulites of PHB usually exhibited left handed twisting.ii-i3. PHB contains significant defect points as rigid and brittle, because of its excessive crystallinity. Furthermore, its poor thermal properties lead to the difficulty in the actual. applications and manufacturing process. For instance, the melting temperature of PHB is close to the thermal decomposition temperature, causing the difficulty to operate the melting. process. The copolymers of PHB with other kinds of monomers were synthesized to. overcome these defects. For example, poly(hydroxybutyrate-co-hydroxyvalerate) (P(HB-co-HV)),i4'2i poly(hydroxybutyrate-co-hydroxyhexanoate) (p(HB-co-HHx)),22'26 and poly(hydroxybutyrate-co-hydroxypropionate) (P(HB-co-HP))27-29 were examined to decrease the crystal parts. Their structures and properties have been continually reported. They showed. a wide range of physical and mechanical properties depending on comonomer compositions and the arrangement of structure chains.. -3-.
(9) Polymer blending is a powerfu1 choice toward materials providing property and cost performances superior to those of their individual components.30 The cheap polymer has been attempted in the polymer research studies.3i There are many reports on the blending of PHB. with other biodegradable or nonbiodegradable polymers including poly(vinyl acetate) (pvAc),32-35 poly(epichlorohydrin) (pECH),36-40 poly(vinyl alcohol) (PVA),`i-43 poly(ethylene. oxide) (PEO),44' `5 poly(butylenes succinate) (pBs),46 poly(vinyl phenol) (pvph),47'49. poly(lactic acid) (PLA),50-53 atactic poly-[(R,S)-3-hydroxybutyrate],54 and its block copolymer with poly(ethylene glycol) (P(R,S-HB-b-EG).55 In addition, the blending of PHB with natural polymers especially polysaccharides like starch,56' 57 chitin and chitosart,58 cellulose59 and its derivatives60-66 were promising as candidates because they reduce, the cost and improve the processability and physical properties.. Cellulose acetate butyrate (CAB) is one of the most industrially important cellulose. ester plastic.67 The structure of CAB composts of cellulose backbone, which is linked by P(1-4) linkage. The substituent groups are the acety1 and butyryl groups. Cellulose molecules. are rigid due to the strong intermolecular hydrogen bonding that occurs between the C=O and. C-H groups in CAB. Cellulose itself is insoluble and reaches its decomposition temperature. prior to melting. The acetylation reaction of the hydroxyl groups reduces intermolecular. bonding, and increases free volume depending upon the level and chemical nature of the. alkyl groups.67' 68 By introducing the acetyl and butyry1 group into cellulose, the mix-cellulose ester CAB does not only have the excellent properties of cellulose, but also exhibits better solubility in organic solvents due to its hydrophobicity. Furthermore, CAB shows notable characteristics in clear form, flexibility, weather ability, moisture resistance,. dimensional stability, and light and cold resistance that make it widely used in the manufacture of plastics. Cellulose acetate butyrate is commonly used in coating film, membrane, textile, pen barrels, steering wheels, tool handles, blister packaging, skylights, etc.69 However, the variation of the percentage in substitution groups leads to the difference of crystallization behavior, thermal propenies, inter and intramolecular interaction of CAB its self. Iwata et al.70 reported the unit lattice parameters and space group of cellulose butyrate. diacetate (CBDA, 2,3-di-O-acetyl-6-O-butyryl cellulose) which is one kind of probable structures in CAB structure. CBDA is orthorhombic with space group P2i2i2i with a = 1.544 nm, b = 2.147 nm, and c = 1.062 nm (fiber repeat). Furthermore, one unit cell composes of four chains (two antiparallel and two parallel chains). The crystallographic repeat is the. -4-.
(10) disaccharide unit in each chain. From the commercial marketing products, there are a lot of types and percentages of CAB content; therefore, it still contains a lot of unclear behaviors.. 2. IR and NIR spectroscopy of PHB and CAB ' Infrared (IR) and near infrared (NIR) spectroscopies are both vibrational spectroscopy, which enable to analyze the structure and interactions of molecules at the ftnctional group level.7i Therefore, these techniques have been extensively used to explore the polymer molecular conformations,72' 73 tactility,43 and interactions in both of amorphous. and crystal parts. The energy band is defined for convenience as the near-infrared (NIR) covering 12,821 to 4000 cm-i (780-2500 nanometers); the infrared (IR) as 4000 to 400 cm-i (2500-25,OOO nm); and the far-infrared (or terahertz) from 400 to 1O cm-i (25,OOO-1,OOO,OOO. nm).74 Polymer spectra describes that the vibrational information characterized by the harmonic vibrations of the fundamental, overtone, and their corresponding combination bands occur from various wavenumber in both ofNIR and IR regions.75'76 The predominant NIR and IR spectral features include: the C-H stretching, the C :O stretching, and the O-H stretching vibrations.. In the case of PHB and PHB copolymer, IR bands attributed to C=O, C-O-C, and C-H groups were extensively proposed as the characteristic bands. Therefore, IR has been widely used for characterizing the composition analysis, crystallinity, crystallization, and melting. behaviors. Sato et al.77-83 has shown that a crystalline CH3 asymmetric stretching bartd appeared in the high frequency (3009 cm-i), which showed a downward shift about 16 cm-i. In addition, the intensity of the crystalline v(C=O) band at 1723 cm'i decreased, while the intensity ofthe amorphous v(C=O) stretching band at 1747 cm'i increased during the heating process. On the basis of these observations, the changes of IR characteristic bands together. with the shorter distance (2.63 A) between the O atom ofthe C=O and the H atom of one of the three C-H bonds of CH3 group compared with the sum of the Van der Waals interaction. (2.72 A). It was concluded that the C-HeeeO=C hydrogen bondings exist between the C=O group in one helix structure and the CH3 group in the other helix structure along the a axis in. crystal part of PHB. The C-HeeeO=C hydrogen bondings are the significant factors to stabilize the chain folding in the lamellar structure of PHB, in other words, the high crystallinity partly comes from the C-HeeeO=C hydrogen bonding. In addition, the band at 3009 cm-i shifts to a lower wavenumber with the increase in temperature. It indicated that,. with temperature increase, the a lattice parameter increases arid the C-HeeeO==C hydrogen. -5-.
(11) bonding becomes weak. Figure 4 presents a model of the lamella structure and intramolecular. interactions ofPHB crystal which was proposed by Sato et al.79 Zhang et al.84 observed the. difference of the intensity change between bands at 1184 and 825 cm-i, which pointed out that the structures of C-O-C backbone' change faster than the structures of C-C backbone during the crystallization process. In the case of cellulose, the assignments of the O-H stretching vibration for the inter and intramolecular hydrogen bonding and self associated interaction in a chain of cellulose were reported.85'87 However, the assignments of CAB were slightly different with cellulose. Park et al.64 reported that the peak --3490 cm-i is assigned to. O-H stretching vibration of the hydrogen bonded interactions between intermolecular chains of CAB .64. The oharacteristic ofNIR spectra consists of overtones and combination bands of the. fundamental molecular absorptions.75' 88 However, an overtone or combination band has an energy slightly below the sum ofthe individual energies ofthe related fundamental vibration.. Generally, it tends to be weaker than each additional of fundamental energy contributing to their absorption by a factor of 1O-1OO.89 NIR spectroscopy has been used for quarititative and. qualitative studies of polymer due to its many advantages such as non-destructive, fast measurement, and almost without sample pretreatment.75 It is very suitable to measure the samples with long optical path lengths, which is useful to the actual application. In the polymer industry, the direct polymerization analyses and real-time monitoring of physical. and chemical properties have long been required. An optical fiber NIR spectroscopy holds. considerable promise for them; therefore, many researchers have investigated on-line polymer processes using the optical fiber NIR. NIR spectroscopy is also powerfu1 in studying. hydrogen bondings, hydration, and inter and intramolecular interactions in polymers. By combining IR with NIR data, one can explore the anliarmonicity of a band which is sensitive to the formation and strength of a hydrogen bond.75 Hu et al.90 investigated the time resolved. crystallization process of PHB by NIR spectroscopic technique. They reported that the band. at 5973 cm-i in NIR region is from the first overtone of C-H stretching vibration of C-HeeeO=C hydrogen bonding. For fUrther interpreting the crystallization of PHB, the principal component analysis (PCA) was used to analyze the real-time NIR difference spectra. measured during the isothermal crystallization process. The result suggested that the crystallization process of PHB is not a simple transition ofa binary mixture ofthe amorphous and ordered crystalline states. Moreover, the crystallization kinetics parameters of PHB was. obtained by combining PCA and,Avrami equation based on the spectral regions instead of the intensity changes ofcertain bands. In the case ofCAB, there is almost no any rgport in NIR. -6-.
(12) region so far; therefore, it is very challenging to investigate CAB polymer for the basic knowledge and further applications.. 3. IR and NIR imaging spectroscopies of polymer The imaging of spectroscopy is one novel and advanced technology. The chemical image which expresses 3D profiles" of the measured sample can be obtained simultaneously. within a few minutes. Thereby, the imaging spectroscopic teclmique could indicate the information of the samples on their spatial separation.9i The extensive study of FT-IR imaging began in 1997 for exploring polymer dissolution in the group of Koenig.73' 92'95 After. that, FT-IR imaging showed a great potential and was rapidly adopted in polymer studies. For. example, Koenig et al. successfu11y investigated the homogeneity and the degree of orientation in the various of poly(ethylene glycol) (PEG) system in 1999.95 Furthermore, the studies on the dissolution behavior ofpolymer for several solvent systems were explored with FT-IR imaging technique.96-iOO For example, Gupper and KazarianiOi reported that the solvent diffusion kinetic and solvent-induce crystallization in syndiotactic polystyrene (sPS) can be. observed by FT-IR imaging. The resolved information of imaging indicated that the 6 crystalline of sPS was presented as a function of solvent exposure time. The imaging experiments proved that solvent diffusion is the limiting factor in the overall crystallization. process ofa sPS sample.. In the case of polymer blends, the imaging spectroscopy has been utilized to investigate phase separation, miscibility, and morphology. Vogel et al.53 studied the phase. separation in the blends of PHB with PLLA and PCL through measuring various blend compositions. The Ii723/Ii7sg intensity ratio was used to compare these blends in terms of. homogeneity They reported that the ratio of PHBIPLLA (30:70 wt O/o) is a compatible one-phase system, while the PHBIPLLA (50:50 wt O/o) blend is phase separated. Further study, the polarized radiation of FT-IR imaging spectroscopy was used to irivestigate the. anisotropic PHB/PLA blends.5i The values of chain orientation function were calculated through analyzing the C=O stretching vibration region. It was found that the opposite chain orientation (PHB negative, PLA positive) of the 500/o elongated PHB/PLA(50:50 wtO/o) blend. film were detected, while the polarized spectra measured with a single element detector. cannot discriminate the different orientation mechanisms in the phase separated blend 51 systems.. -7-.
(13) The application of NIR imaging spectroscopy in the field of polymer research is relatively new, even though it has been familiarly used in pharmaceutical researches.i02 Furukawa et al.i03 carried out the FT-IR imaging ofPHB/PLLA with various blend ratios. The. score images were formed to indicate PHB and PLLA rich phase. These images directly. exhibited the distribution of the component of PHBIPLLA blends. In addition, the compositions of blends were estimated using PLSR calculation method. The predictions of the component concentrations with an average over space were in good agreement with their actual concentration. The narrow distributions of score values, which were calculated from the standard deviation (STD) of the histograms, referred to the high level of homogeneity of PHBIPLLA blends. From their study, it is feasible to expect that FT-IR imaging spectroscopy will be very usefu1 in the polymer blend systems even for homogenous polymer blends. Multivariate data analysis using specific chemometrics teclmiques has often been used. to extract the significant information in the data matrix resulted from IR and NIR measurements.i04 This technique requires extracting the essential information about the objects and variables by reducing the data into fewer components. Also, it separates the noise. from the important data to the residual parameter. The reduction of information terms will increase the stability due to the removal of noise or useless information from the data.i05 Classification of spectral data can be done through classification techniques such as principal. component analysis (PCA). PCA is a chemometric method that decomposes a data matrix into a bilinear model of latent variables technique whilst retaining as much as possible of the variations present in the data set.i05'i07 PCA projects data onto a orthogonal subspace, so that. the first principal component (PC) accounts for the 1argest amount of variation originally present in the data set. The second PC accounts for the largest amount of residual variance. unexplained by the first PC, and so on until all of the sample variances are combined into. component groups.i05-i07 Each pc designates an independent component of variation in the data matrix. PCA forms the basis for multivariate image analysis, and reduces the hundreds of image planes to a small data matrix that captures the maximum variation in the sample, and is easier to interpret. i08 The bilinear decomposition ofthe data can be explained as:. X= TP'+E (1) where Xis the spectra matrixes, T expresses the scores, P' indicates the loadings, and E is the. residual error. The prime is used to indicate the transpose ofmatrixes. Figure 5 presents the. calculation process for PCA model to analyze one data matrix, which was reproduced from Geladi et al.i05'i09 From PCA calculation, the scatter plots and line plots to allow efficient. interpretation of the data space can be easily viewed. Scatter plots are frequently used to. -8-.
(14) detect similarities, differences, or other interesting phenomena between samples, while outliers, subgroups, and clusters can also be detected. The plot ofeach loading vector against. wavelength number is used to visualize the spectral pattern ofeach PC. Loadings are used to interpret the relationships between scores and the original variables (wavelength). It would indicate which variables are most important for the different components in the data set. The. loading lines are usefu1 for identifying which variables characterize the different component.iiO As described above, the advantage of PCA is that it reduces the number of. variables for easy analyses. The drawback of PCA is the interpretation of the loadings because several chemical components could contribute to one loading.i08. 4. DSC and X-ray of polymer DSC is usefu1 to characterize the thermal properties ofpolymers. DSC measures the heat flow changes with temperatures during the heating or cooling process associated with. the exothermic and endothermic transitions. It can be used to characterize materials for. melting points, softening points, heat capacity, transitions, and material-reaction characteristics such as specific heat, percent crystallinity, and reaction kinetics. DSC is an. analytical technique that measures the heat flow to or from a sample specimen as it is subjected to a controlled temperature program in a controlled atmosphere.iii. The glass transition temperature (Tg) ofpolymer is the important factor relating to the amorphous region which is the molecular motion of the material. Tg represents graphically in the thermal curve as a shift in the baseline. It is a change in the heat capacity of the material. as the amorphous regions melt. In the case of polymer blends of the miscible system, it has been known that single Tg can be presented in each composition. The relationship between Tg and blends composition for the miscible system could probably be calculated and established based on previous propositions,ii2 such as Fox,ii3 Gordo Taylor,ii4 couclman,ii5•ii6 or Kwei equations.ii7 Lodge-McLeish et al. ii8'ii9 pointed that the miscible polymer could present two Tgs due to the local heterogeneities of the blend composition mediated by a difference in the. "self-concentration" ofthe stiff and flexible components in the blends. Two Tgs were affected by the influent of chain connectivity, which could evaluate the self-concentration value and Kuhn length ofpolymer.ii8• ii9. X-rays are electromagnetic waves of very short wavelength. X-rays used in polymer studies have wavelengths of about O.1-O.2 nm. wnen the electromagnetic wave intact with structures, it is scatted and diffracted. The angles of scatter are 1arge when the lengths are less. -9-.
(15) than the structure comparable to the wavelength. On the other hand, it is small when the lengths are large compared with the wavelength ofthe waves. Two types ofX-ray are used in. the study of polymers, wide angle X-ray diffraction (WAXD) and small angle X-ray scattering (SAXS) depending on the scale ofthe features studied.i20. WAXD method is a usefu1 and powerfu1 technique to capture the informatioh for understanding and elucidating of the order and orientation of crystalline structure. The diffraction peak which diffracts from the diffraction angle could be observed and used to calculate the lattice parameters as a, b, and c. The unit cell geometry can also be determined. To obtain the lattice parameter, the Miller indices h, k, and l for each crystallography plane are provided the reflection peaks, which lead to calculate from the Bragg 's eguation.. 2dhki sine=nX (2) where n is the diffraction order from a set of planes, X artd dhki are the wavelength of X-ray. and interplanar spacing between parallel crystallographic planes (hkb, respectively. The investigation of the lattice parameter changes during perturbations such as temperature and pressure could provide the information ofthe crystal structure responding to that perturbation. imposed on them. Furthermore, X-ray diffraction studies also reveal a great deal of information related to the disorder in the crystal structure through a quantitative measurement. Disorder in the crystal structure leads to broaden ofthe diffraction pattern. For. calculation ofthe relative amounts ofcrystalline and amorphous material in a given sample, it is necessary to resolve the contributions of the two types of structures to the X-ray diffraction pattern.i2i' i22 In other words, the degree of crystallinity can be determined if the intensities. due to the amorphous scattering can be separated and subtracted. Furthermore, it also can be. used to study the variation and orientation distribution of the crysta11ographic plane in crystalline phase in anisotropic samples.. Small angle X-ray scattering (SAXS) of polymers probes relatively 1arge-scale structures, in contrast to wide angle X-ray diffraction (WAXD) that deals mainly with the atomic structure of crystals. SAXS includes not only the diffraction of 1arge lattice spacing of the order structure materials, but also the scattering by perturbed or non-periodic structures of. amorphous and mesormorphic materials.i23 The scattering radiation in a single particle is presented in Figure 6.i24 The scattering amplitude A(g) is proportional to Fourier transforrn of electron density, io(r):. A(q)=fp(r)e-iqrdr (3) q is the scattering factor defined as. -10-.
(16) q=k- ko=ÅÄ' sin (g) (4) where ko = 2nSo/1 and k = 2nS/Z are the wave vectors ofthe incident and the scattered radiation. In a scattering experiment, the result is normally expressed by giving the intensity distribution in q-space, I(g). The intensity I(g) is the absolute square of the amplitude of the. scattered X-ray. It is more appropriately td write as `. I(q) = <IA(q)l2>= A(q)•A'(q) (5) It follows from equation and adopting a new variable r = u' - u,. I(q) =• [J p(u')e-iqW] [J p(u)eiq"] = J [f p(u)p (u + r) du] e-iq' dr (6). == frp (r) e-iqrdr (7) where rKr) is called autocorrelation function ofp(r) and defined as. r, (r) =Jp(u)p(u+r) du (8) According to equation 5, 6, and 7, the intensity distribution I(q) can be obtained from the. Fourier transformation of the autocorrclation function of p(r). On the other hand, the autocorrelation fUnction rp(r) can be used to calculate the inverse Fourier transformation of. the intensity distribution I(g). The relationship of the four physical parameters as above mentioned; p(r), A(g), F.(r) and I(g), is shown in Figure 7. It is clear that the intensity distribution, I(q) can be calculated from a known electron density distribution, p(r), while the. electron density distribution of an unlmown system cannot directly evaluate from the experimentally intensity distribution, I(g).i25. Method for evaluating parameters characterizing such systems has been developed by many researchers over the years. Especially, Guinier,i24 Debye,i26 Luzatti,i27 porodi28-i30 developed the interpretation for the basic features in SAXS pattems. In the nonparticulate. two-phase system, for example, two immiscible polymers are blended or a miscible polymer has phase separation, the analysis of scattering data leads to the determination of parameters. characterizing, which is related to the dispersion of the components in sample. These include the correlation length characterizing as the domain size, the specific boundary area, and the. possibly the thickness of phase boundaries. The important theoretical result for the ideal two-phase model is the Porod law.i28-i30 It is used for predicting the total area S of the boundaries between the two phase in the scattering volume. I(g) decreases as -g-4 for 1arge g;. I(q) =<di >2nSq-` (9) where if is the mean square fluctuation of the reflective index, and S is the total surface area of the boundaries.. -11-.
(17) Debye and Buechei26 established the theory that gives the relation between the intensity distribution and statistical pararneters, which describe the two phase structure. The intensity usually decreases with an increase in scattering angle (e).. I(q) = A (1+g2q2)2. (1O). where A is a constant, and the correlation distance (C) can be calculated as the value of (slope/intercept)i/2 in the Debye-Bueche plot ofl(g)'i/2 versus g2.i26•i3i. From previous works, the blends of PHB/CAB were investigated on miscibility,6i' 65• 66 crystallization 6i' 65' 66 and orientation behavior64 using DSC and X-ray methods. Scandola. et al.66 reported that the blends of PHBICAB were miscible in amorphous states through. operating the dynamic-mechanical thermal analysis (DMTA) and DSC measurements. They. found that the blend can crystallize only at temperatures higher than the composition-dependent Tg. When crystallization was induced by thermal treatments, the obtained melting temperature of the crystalline phase mainly depended on the composition. The Tg blends slightly shift to higher temperature with an increase in CAB or CAP content. The result was in agreement with that by Ceccoru11i et al. 60 who further investigated effects. of low molecular weight plasticizer on the miscibility of PHB/CAB blends. Pizzole et al.65 explored the miscibility between PHB and two kinds of CABs in the melt, and reported that there was no observable interspherulitic segregation when the blends crystallizing under this given crystallization conditions. The spherulite radius increased linearly with time. The radial. growth rate (G) strongly depends on the cellulose ester content of the blend, and G decreases. with an increase in CAB content. The spherulites showed bariding whose spacing increases with increasing crystallized temperature. El-Shafee et al.6i confirmed the miscible blend in. melts and indicated that the effect of the equilibrium melting-point depression of PHB crystals upon the addition of CAB. Moreover, it was found that, after crystallization of the. PHB component in the blends, CAB exists in the interlamellar amorphous regions and becomes a major component, as detected by SAXS. Park et al.64 investigated a uniaxial drawing of PHBICAB blend. WAXD revealed that the orientation of the crystallizable PHB. component in the drawn PHBICAB blends was changed from c-axis-orientation to a-axis-orientation With increasing CAB content. The a-axis-orientation was a result from the. a-axis-oriented crystal growth caused by the intramolecular nucleation and the confined crystai growth. A combination of SAXS and polarized FT-IR analysis indicated that most of. the PHB main chains were aligned perpendicular to the drawing direction. The change of crystal growth directly influenced the manner of the lamellar stacking. The lamellar stacking. -12-.
(18) direction was also changed from parallel to perpendicular in the stretching direction with an increase in CAB content. As well, the long period along the equatorial direction significantly. increased in the ratio to the CAB content, suggesting that most of the extended CAB chains were located in the interlamellar region ofthe a-axis-oriented PHB crystal.. 5. 0utline of each chapter This thesis consists of four chapters. In Chapter 1, the PHB/CAB blends are investigated on the intra- and inter-molecular interactions, the structure evaluation, artd crystallization. behavior using IR spectroscopy, DSC, and WAXD. The composition-dependent and temperature-induced spectral variations in the C=O and O-H stretching vibration regions of blends are analyzed for the attributions of the intra and intermolecular interaction bands.. Through minute analysis, we found that the bands at 1759 and -1743 cm'i in the C=O stretching region relate to free C=O of CAB content, while the bands at 1747 and 1723 cm'i. contributed to the amorphous and the intra-molecular hydrogen bonding (C-He.eO=C) in the helical crystalline structure of PHB component. In O-H stretching vibration region of CAB, three bands at 3587, 3549, and 3485 cm-i related to the free, intra-, and inter-chain interaction. ofself-associated CAB content are correspondingly observed. The band at 3485 cm'i shifts to. 3460 cm'i with an increase in CAB content. Furthermore, the band at 3460 cm'i ofPHB/CAB (50:50 wtO/o) presents the higher wavenumber shift during the heating process. Therefore, the important band at peak 3460 cm-i is possible to relate to the O-H bonded stretching vibration. of the interd-molecular hydrogen bondings (HBs) of PHB--C=OeeeH-O--CAB. From the combination of the DSC, WAXD, and IR results, we reveal that the interactions change together with the cold crystallization behavior in the blend during heating process.. In chapter 2, the effects of intermolecular hydrogen bonding and molecular weight on the. isothermal crystallization kinetic at 117 OC of CAB and PHB are explored. Two kinds of. CABs which are slightly different in molecular weight and number of OH residual were selected for the blend system. IR characteristic bands in the C=O, C-O-C and C-C stretching. and combination vibration regions of the difference structure are calculated. The crystallization rate constant kA from the Avrami plot, the prolonged induction time ti for the crystallization, and the crystallization halftime (t-ti)i are systematically studied. The slowing. down of the kinetics is found to be primarily attributed to the physical crosslinki"ngs between. the PHB chains and the CAB chains formed by the intermolecular hydrogen bondings (HBs). of PHB-C==OeeeH-O-CAB. In both neat PHB and the blends, we reveal the fact that the. -13-.
(19) crystallization involves a series of crystallization process as the first formation of the. intermediate structure between crystals and amorphous melts. Then, lamellae without intramolecular (intra) HBs of PHB-C-HeeeO= C-PHB and eventually lamellae having intra HBs in the order of the increasing crystallization time are formed. Strikingly, our results reveal that this secondary crystallization process occurs at a faster rate than the primary crystallization process, rising to the upward deviation from the Avrami fit. This appears to be. a specific feature inherent in PHB. The multisteps crystallization processes involving the intermediate structure or the less ordered crystal structure are explained in detail.. In chapter 3, we explore the composition fluctuations, hydrogen bonding interactions,. and crystallization of the PHB/CAB blends by using the combined SAXS, WAXD, and DSC methods. The film at a ratio PHB/CAB (50/50 wtO/o) presents two scattering peaks at q - O.2 o. and O.9 in SAXS profiles of blend, which are ascribed to the crystalline structure CAB and. PHB, respectively. The temperature dependence of SAXS profiles shows the thermal behavior of the lamella structure of both PHB and CAB. Two glass transition temperatures (Tgi, Tgu) of PHB/CAB blends are detected by the inflection point of SAXS intensity profiles. and DSC thermograms. Furthermore, CAB has crystalline structure at high temperature after. melting of PHB crystalline in the as-prepared PHB/CAB blends and the correlation length also increases with the increasing temperature. As the result, phase separation occurs first,. then PHB melts and CAB forms crystalline structure. These results are in good agreement with our previous results obtained by IR. The model for cold crystallization process of the. as-prepared PHB/CAB blend sample is proposed.. In chapter 4, the melt crystal behaviors of PHB and CAB blend (80:20 wtO/o) are. studied by IR and NIR imaging spectroscopies. The spectroscopic images,provide information about the spherulite growth in the dynamic blend systems. Through analysis of. the changes of the IR and NIR imaging spectra in the regions of the first and second overtones of C=O stretching vibration, the evolutions of the heterogeneous spherulite during. the time-resolved isothermal crystallization process are examined. Time-resolved imaging and corresponding polarized microscopic.results reveal that the initial nuclei ofPHB quickly form at the starting of the crystallization process. In other words, these PHB domains are able. to segregate from the PHB/CAB blend. For ftrrther exploring the heterogeneous spherulite,. the PCA technique is used to classify the distribution of different morphology of the spherulite. The calculated results with PCA suggest that the low crystallinity parts of the blended spherulite contain a 1arge variation and indicate that those regions are merged with. PHB and CAB contents.. -14-.
(20) References 1.. M. Lemoigne,Ann. Inst. Pasteur, 39, 144-173 (1925).. 2.. Y. Doi, Microbial Polyester, Wiley-VCH, New York, 1990.. 3.. R. H. Marchessault and G. Yu, Crystallization and Material Properties of. Polyhydroxyalkonoates PHAs; Wiley-VCH: Wienheim, 2005. 4.. T. Iwata and Y. Doi, Macromol. Chem. Phys., 200, 2429-2442 (1999).. 5.. K. Sudesh, H. Abe and Y. Doi, Prog. Polym. Sci., 25, 1503-1555 (2000).. 6.. L. L. Madison and G. W. Huisman, .Uricrobiol. Mol. Biol. Rev, 63, 21-53 (1999).. 7.. S. Khanna and A. K. Srivastava, Process Biochem., 40, 607-619 (2005).. 8.. M. Yokouchi, Y. Chatani, H. Tadokoro, K. Teranishi and H. Tani, Polymer, 14, 267L272 (1973).. 9.. A. J. Owen, Polymer, 38, 3705-3708 (1997).. 1O.. J. K. Hobbs, D. R. Binger, A. Keller and P. J. Barham, J. Polym. Sci. Part B: Polym.. Phys., 38, 1575-1583 (2000). 11.. K. L. Singfield, J. K. Hobbs and A. Keller, J. Cryst. Growth, 183, 683-689 (1998).. 12.. P. J. Barham, A. Keller, E. L. Otun and P. A. Holmes, J. Mater. Sci., 19, 2781-2794 (1984).. ,13.. H. D. Keith and F. J. Padden, Macromolecules, 29, 7776-7786 (1996).. 14.. S. Bloembergen, D. A. Holden, G. K. Hamer, T. L. Blnhni and R. H. Marchessault,. Macromolecules, 19, 2865-2871 (1986). 15.. S. Bloembergen, D. A. Holden, T. L. Bluhm, G K. Hamer and R. H. Marchessault,. Macromolecules, 20, 3086-3089 (1987). 16.. T. L. Blulm, G. K. Hamer, R. H. Marchessault, C. A. Fyfe and R. P. Veregin,. Macromolecules, 19, 2871-2876 (1986). 17.. M. Scandola, G. Ceccoru11i, M. Pizzoli and M. Gazzano, Macromolecules, 25,. 1405-141O (1992). 18.. A. A. Mansour, G. R. Saad and A. H. Hamed, Polymer, 40, 5377-5391 (1999).. 19.. N. Yoshie, M. Saito and Y. Inoue, Polymer, 45, 1903-1911 (2004).. 20.. Y. Inoue, N. Kamiya, Y. Yamamoto, R. Chujo and Y. Doi, Macromolecules, 22, 3800-3802 (1989).. 21.. N. Kamiya, M. Sakurai, Y. Inoue, R. Chujo and Y. Doi, Macromolecules, 24, 2178-2182 (1991).. 22.. K. Bhubalan, W.-H. Lee, C.-Y. Loo, T. Yamamoto, T. Tsuge, Y. Doi and K. Sudesh,. -15-.
(21) Polym. Degrad. Stab., 93, 17-23 (2008).. 23. J. Asrar, H. E. Valentin, P. A. Berger, M. Tran, S. R. Padgette and J. R. Garbow,. Biomacromolecules, 3, 1006-1012 (2002). 24. H. Alata, T. Aoyama and Y. Inoue, Macromolecules, 40, 4546-4551 (2007).. 25. Y. Doi, S. Kitamura and H. Abe, Macromolecules, 28, 4822-4828 (1995). ' 26. T. Tsuge, Y. Kikhawa and Y. Doi, Sci. Technol. Adv Mater., 5, 449-453 (2004).. 27. M. Hiramitsu and Y. Doi, Polymer, 34, 4782-4786 (1993).. 28. E. Shimamura, M. Scandola and Y. Doi, Macromolecules, 27, 4429-4435 (1994).. 29. T. Fukui, M. Suzuki, T. Tsuge and S. Nakamura, Biomacromolecules, 10, 700-706. (2009). 30. S. W. Kuo, J. Polym. Res.,15, 459-486 (2008).. 31. G. Q. Chen and R.-C. Luo, in Biodegradable Polymer Blends and Compositesfrom Renewable Resources, L. Yu, Eds.; John Wiley & Sons, Inc.: Hoboken, 2009; p. 191 d-207. 32. P. Greco and E. Martuscelli, Polymer, 30, 1475-1483 (1989).. 33. Y. Kumagai and Y. Doi, Polym. Degrad. Stab.,36, 241-248 (1992). 34. Y. An, L. Dong, L. Li, Z. Mo and Z. Feng, Eux Polym. Z,35, 365-369 (1999). 35. S. A. Madbouly, A. A. Mansour and N. Y. Abdou, Eur. Polym. Z, 43, 3933-3942 (2007). 36. J. A. de Lima and M. I. Felisberti, Eur Polym. J, 42, 602-614 (2006).. 37. L. Finelli, B. Sarti and M. Scandola, J. Macromol. Sci., Part A: Pure and Applied Chemistry, 34, 13-33 (1997). 38. E. D. Paglia, P. L. Beltrame, M. Canetti, A. Seves, B. Marcandalli and E. Martuscelli,. Polymer, 34, 996-1001 (1993). 39. P. Sadocco, M. Canetti, A. Seves and E. Martuscelli, Polymer, 1993, 34, 3368-3375.. 40. E. El-Shafee, Eur. Polym. Z,38, 413-421 (2002).. 41. Y. Azuma, N. Yoshie, M. Sakurai, Y. Inoue and R. Chtij6, Polymer, 33, 4763-4767. (1992). 42. T. Ikejima, A. Cao, N. Yoshie and Y. Inoue, Polym. Degrad. Stab.,62, 463-469 (1998). 43. N. Yoshie, Y. Azuma, M. Sakurai and Y. Inoue,J Appl. Polym. Sci., 56, 17-24 (1995).. 44. J. W. You, H.-J. Chiu and T.-M. Don, Polymer, 44, 4355-4362 (2003). 45. Y. He, N. Asakawa and Y. Inoue, Polym. Int.,49, 609-617 (2000). 46. Z. Qiu, T. Ikehara and T. Nishi, Polymer, 44, 2503-2508 (2003).. 47. L. Guo, H. Sato, T. Hashimoto and Y. Ozaki, Macromolecules, 43, 3897-3902 (2010).. 48. P. Iriondo, J. J. Iruin and M. J. Fernandez-Berridi, Macromolecules, 29, 5605-5610. -16-.
(22) (1996). 49. P. Xing, L. Dong, Y. An, Z. Feng, M. Avella and E. Martuscelli, Macromolecules, 30,. 2726-2733 (1997). 50. T. Furukawa, H. Sato, R. Murakami, J. Zhang, Y.-X. Duan, I. Noda, S. Ochiai and Y.. Ozaki, Macromolecules, 38, 6445-6454 (2005). 51. C. Vogel, E. Wessel and H. W. Siesler, Macromolecules, 41, 2975-2977 (2008). 52. J. Zhang, H. Sato, T. Furukawa, H. Tsuji, I. Noda and Y. Ozaki, Z Phys. Chem. B, 110,. 24463-24471 (2006). 53. C. Vogel, E. Wessel and H. W. Siesler, Biomacromolecules, 9, 523-527 (2008). 54. H. Abe, I. Matsubara and Y. Doi, Macromolecules, 28, 844-853 (1995). 55. Y. Kumagai and Y. Doi, J. Polym. Environ., 1, 81-87 (1993).. 56. S. Godbole, S. Gote, M. Latkar and T. Chakrabarti, Bioresour. Technol., 86, 33-37. (2003). 57. M. Zhang and N. L. Thomas, J. Appl. Polym. Sci.,116, 688-694 (2010).. 58. T. Ikejima and Y. Inoue, Carbohydn Polym.,41,351-356 (2000). 59. V. P. Cyras, M. S. Commisso, A. N. Mauri and A. Vazquez, J. Appl. Polym. Sci., 106,. 749-756 (2007). 60. G. Ceccorulli, M. Pizzoli and M. Scandola, Macromolecules, 26, 6722-6726 (1993). 61. E. El-Shafee, G. R. Saad and S. M. Fahmy, Eur. Polym. J.,37, 2091-2104 (2001). 62. N. Lotti and M. Scandola, Polym. Bull., 29, 407-413 (1992).. 63. J. W. Park, Y. Doi and T. Iwata, Macromolecules, 38, 2345-2354 (2005). 64. J. W. Park, T. Tanaka, Y. Doi and T.- Iwata, Macromol. Biosci., 5, 840-852 (2005).. 65. M. Pizzoli, M. Scandola and G. Ceccoru11i, Macromolecules, 27, 4755-4761 (1994). 66. M. Scandola, G. Ceccoru11i and M. Pizzoli, Macromolecules, 25, 6441-6446 (1992).. 67. A. M. M. Baker and J. Mead, in Handbook ofPlastics, Elastomers, and Composites, C. A. Harper, Eds.; McGraw-Hill: New York, 2002; p 17. 68. J.A. Brydson, Plastics Materials; Butterworths: Oxford, 1589. 69. C. A. Harper and E. M. Petrie, Plastics materials andprocesses : a concise. encyclopedia; Jolm Wiley & Sons, Inc.: Hoboken, 2003.. 70. T. Iwata, A. Fukushima, K. Okamura and J. Azuma, Mokuzai Gakkaishi, 42, 289-292. (1996) 71. D. I. Bower and W. F. Maddams, The vabrational Spectroscopy ofPolymers;. Cambridge University Press: Cambridge, 1989. 72. H. W. Siesler, in 0rientedPolymer Materials; Wiley-VCH Verlag GmbH: 2008; p. -17-.
(23) 138-166. 73.. J. L. Koenig, Spectroscopy ofPolymers; Elsevier: New York, 1999.. 74.. J. Workman, Jr. and L. Weyer, Practical Guide to Interpretive Near-Infrared Spectroscopy; CRC Press: New York, 2007; p 1-22.. 75.. H. W. Siesler, Y. Ozaki, S. Kawata and H. M. Heise, Eds., in Near-Infrared Spectroscopy, Princi les, Instruments, Applications,;WILEY-VCH, Weinheim, 2002.. 76.. C. Sandorfy, R. Buchet and G. Lachenal, in Near-Infrared Spectroscopy in Food Science and Technology, Y. Ozaki, W. F. McClure and A. A. Christy, Eds.; John Wiley & Sons, Inc., Hoboken, 2007; p 11-46.. 77.. H. Sato, Y. Ando, H. Mitomo and Y. Ozaki, Macromolecules, 44, 2829-2837 (2011).. 78.. H. Sato, J. Dybal, R. Murakami, I. Noda and Y. Ozaki, Z Mol. Struct., 744-747, 35-46 (2005).. 79.. H. Sato, K. Mori, R. Murakami, Y. Ando, I. Takahashi, J. Zhang, H. Terauchi, F. Hirose,. K. Senda, K. Tashiro, I. Noda and Y. Ozaki, Macromolecules, 39, 1525-1531 (2006). 80.. H. Sato, R. Murakami, K. Mori, Y. Ando, I. Takahashi, I. Noda and Y. Ozaki, l77brational Spectroscopy, 51, 132-135 (2009).. 81.. H. Sato, R. Murakami, A. Padermshoke, F. Hirose, K. Senda, I. Noda and Y. Ozaki, Macromolecules, 37, 7203-7213 (2004).. 82.. H. Sato, R. Murakami, J. Zhang, K. Mori, I. Takahashi, H. Terauchi, I. Noda and Y. Ozaki, Macromol. Symp., 230, 158-166 (2005).. 83.. H. Sato, A. Padermshoke, M. Nakamura, R. Murakami, F. Hirose, K. Senda, H. Terauchi, S. Ekgasit, I. Noda and Y. Ozaki, Macromol. Symp., 220, 123-138 (2005).. 84.. J. Zhang, H. Sato, I. Noda and Y. Ozaki, Macromolecules, 38, 4274-4281 (2005).. 85.. T. Kondo, Cellulose, 4, 281-292 (1997).. 86.. A. Watanabe, S. Morita, S. Kokot, M. Matsubara, K. Fukai and Y. Ozaki,Z Mol. Struct., 799, 102-110 (2006).. 87.. S. Kokot, B. Czarnik-Matusewicz and Y. Ozaki, Biopolymers, 67, 456-469 (2002).. 88.. D. A. Burns and E. W. Ciurczak, Handbook ofNear-InfraredAnalysis; Marcel Dekker:. New York, 2001. 89.. S. Sagi6, Y. Ozaki, Eds. Raman, InLfrared, and Near-InLfrared Chemical lmaging; John. WileY & Sons, Inc.: Hoboken, 20101 90.. Y. Hu, J. Zhang, H. Sato, Y. Futami, I. Noda and Y. Ozaki, Macromolecules, 39, 3841-3847 (2006).. 91.. E. Wessel, C. Vogel, O. Kolomiets, U. Hoffmann and H. W. Siesler, in Infrared and. -18-.
(24) Raman Spectroscopic Imaging, R. Salzer and H. W. Siesler, Eds.; Wiley-VCH Verlag. GmbH & Co. KGaA, Weinheim, 2009; p 295-345. 92. S. R. Challa, S.-Q. Wang and J. L. Koenig, AppL Spectrosc.,50, 1339-1344 (1996).. 93. C. M. Snively and J. L. Koenig, J. Polym. Sci. Part B.' Polym. Phys., 37, 2261-2268. (1999). 94. C. M. Snively and J. L. Koenig, Macromolecules, 31, 3753-3755 (1998).. 95. C. M. Snively and J. L. Koenig, J. Polym. Sci. Part B: Polym Phys., 37, 2353-2359. (1999). 96. J. P. Bobiak and J. L. Koenig, Appl. Spectrosc.,58, 1141-1146 (2004).. 97. J. L. Koenig, Macromolecules, 36, 4851-4861 (2003). 98. B. A. Miller-Chou and J. L. Koenig, Macromolecules, 35, 440-444 (2002). 99. T. Ribar, R. Bhargava and J. L. Koenig, Macromolecules, 33, 8842-8849 (2000). 100. T. Ribar, J. L. Koenig and R. Bhargava, Macromolecules, 34, 8340-8346 (2001).. 101. A. Gupper and S. G. Kazarian, Macromolecules, 38, 2327-2332 (2005). 102. C. Gendrin, Y. Roggo and C. Collet, J. Pharm. Biomed. Anal.,48, 533-553 (2008).. 103. T. Furukawa, H. Sato, H. Shinzawa, I. Noda and S. Ochiai, Anal. Sci., 23, 871-876. (2007). 104. Y. Ozaki, W. F. McClure and A. A. Christy, Eds., Near-InLfrared Spectroscopy in Food. Science and Technology; Jolm Wiley & Sons, Inc.: Hoboken, 2007; p 47-72. 105. P. Geladi, Spectrochim. Acta Part B: Atomic Spectroscopy, 58, 767-782 (2003). 106. I. T. Jolliffe, Principal ComponentAnalysis, Springer-Verlag, New York, 2002.. 107. P. Geladi, H. Grahn and J. E. Burger, in Techniques andApplications ofH.vperspectral Image Analysis; Jolm Wiley & Sons, Ltd.: 2007; p 1-15.. 108. Y. Roggo, A. Edmond, P. Chalus and M. Ulmschneider, Anal. Chim. Acta, 535, 79-87. (2005). 109. P. Geladi, H. Gralm and M. Manley, in Raman, Infrared, and Near-InLfrared Chemical. Imaging, S. Sasl6 and Y. Ozaki, Eds.; John Wiley & Sons, Inc.: Hoboken, 2010; p. 93-107. 110. T. Nzes, T. Isaksson, T. Fearri and T. Davies, A user-Lfriendly guide to multivariate calibration and classt:17cation; NIR Publications: Chichester, 2002.. 111. A. W. Salamon and K. J. Fielder, in Handbook ofPlastics Analysis, H. Lobo and J. V. Bonilla, Eds.; Marcel Dekker, Inc.: New York, 2003; p 70-99. 112. Y. He, B. Zhu and Y. Inoue, Prog. Polym. Sci.,29, 1021-1051 (2004). 113. T. G. Fox, Bull. Am. Phys. Soc.,1, 123 (1956).. -19-.
(25) 114. M. Gordon and J. S. Taylor, Z Appl. Chem., 2, 493-500 (1952).. 115. P. R. Couctman, Macromolecules, 11, 1156-1161 (1978). 116. P. R. Couchman and F. E. Karasz, Macromolecules, 11, 117-119 (1978). 117. T. K. Kwei, J. Polym. Sci.: Polymer Letters Edition, 22, 307-313 (1984).. 118. T. P. Lodge and T. C. B. McLeish, Macromolecules, 33, 5278-5284 (2000). 119. J. Zhao, M. D. Ediger, Y. Sun and L. Yu, Macromolecules, 42, 6777-6783 (2009).. 120. D. Bower, An Introduction to Polymer Physics; University ofCambridge Press: 2002. 121. P. Ghosh, Polymer science and technology: plastics, rubbers, blends and composites;. Tata Mcgraw-Hill: New Delhi, 2002. 122. L. Alexander, X-ray di:ffraction methods in polymer science; Wiley-Interscience: New. York, 1969. 123. B. Chu and B. S. Hsiao, Chem Rev, 101, 1727-1761 (2001). 124. A. Guinier and G. Fournet, Small-Angle Scattering ofX-rays; John Wiley and Sons, Inc.:. New York, 1995. 125. R. J. Roe, Methods ofX-ray and Neutron Scattering in Polymer Science; Oxford University Press, Inc.: New York, 2000.. 126. P. Debye andA. M. Bueche,l Appl. Phys.,20, 518-525 (1949). 127. V. Luzzati,Acta Crystallographica, 13, 939-945 (1960). 128. G. Porod, Kolloid-Z, 124, 83-114 (1951).. 129. G Porod, Kolloid-Z, 125, 51-57 (1952).. 130. G Porod, General Theory, in Small Angle X-ray Scattering, O. Glatter and O. Kratky. Eds.; Academic Press, Inc.: London, 1982. 131. M. Moritani, T. Inoue, M. Motegi and H. Kawai, Macromolecules, 3, 433•-441 (1970).. -20-.
(26) x /H. H3C. oxl)i,r 11. o/CXc/ C (.) H2. RO. oo OR oo OR OR. RO. --. o. R=H or o. AcH, or o. OR n (b). Figure 1. Chemical structures of (a) poly(3-hydroxybutyrate) (PHB) and (b) cellulose acetate. butyrate (CAB).. -21-.
(27) CAB B o=c. RNc..o. ozzC-O. o/zCNR. -CNN / ".9"IIIilt•/N,--,/.,PHB. R=CH3 or. C3H7. H-C---CH2 - H2C--O. 7. Figure 2. The ideal model of the change of the intra and inter molecular interactions ofPHB. and CAB. -22-.
(28) Oo oc. L4. L4 t. E. L 4 5Jj. 1. ,--:V.---V-N.-.. -",-,,,,,,,,,,,s. G([]i<8. sJ. "-wwvee c. J. rcdb. s4. i x. `. k !1.wwiiiz,z::{i},<; r. $iilll. o. ,s. 4 =-. nyL 4. i`-4. 4. l. j. Figure 3. Crystalline structure ofPHB proposed by Yokouchi et al.8. -23-. --L 4.
(29) Sbl:t"kbc,'"tF's.•y...tig'•"l.•. •k.lee.k,.,,'"tt'lvpe".,. ,". ,tt-. r.ot.t•N/iL!in,-Ve:)t•"•. '--f'. {*,{fiija•ltt'igintpm-,. e,.,te"'ymt. tt. -ev,"el 'e diIil. .eb,tSl. e'. v. mes*ny, 'ifS:•' msuptdi. 'esW*ias•. ls4. ". L. ,keww* •#ut::[-wge-. 53nm. l. idempex".. tsts#w. e2ee5:". •ny,IX:. ,,. sme":: tt. :g:;t. ,•i. ". ptpt.. "*. i. {,metv. ,ts".pt". {-kst" i;,i'itt',ls-kMtth. •--""as. esem•tt:. e. ttt. a Figure 4. The crystalline structure model ofPHB linked by C granted by Sato et al.79. -24-. -HeeeO=C hydrogen bonding.
(30) K. R. K R. X L. T. +. E. L. Spectra Data. Scores. Loadings. Residuals. Figure 5. The PCA equation for an image data matrix, the spectral matrix of size Lx K are reduced to smaller matrices ofthe score matrix (L x R) and the loading matrix (R x K) that are. easier to interpret and contain all the relevant information from the data matrix. Noise and. other disturbances remain in the residual matrix of size L x K. Adapted from Geladi et al.104,1os. -25-.
(31) Scattered lays. s Mlt lncictent vuys. 2e. s". k =es. g ...e. e se. Figure 6. Scattering pattern in a single particle proposed by Guinier.. -26-. 124.
(32) p(r. Fourter traRsferm. q). Imverse Feuster tramsfemi .s. ep. :.. !. A m. g. x ee. sw. :•. x•. r,(r). Fowter tramsferm. I(q). inve'rse Feurier tra,msform Figure 7. Relationship among p(r), r.(r) A(q) and I(g).'25. -27-.
(33) Chapter 1. Intermolecular Interactions and Crystallization Behavior of Biodegradable. Polymer Blends between PoRy (3-hydroxybutyrate) and Cellulose Acetate. Butyrate Studied by DSC, FT-IR, and VVAXD. -28-.
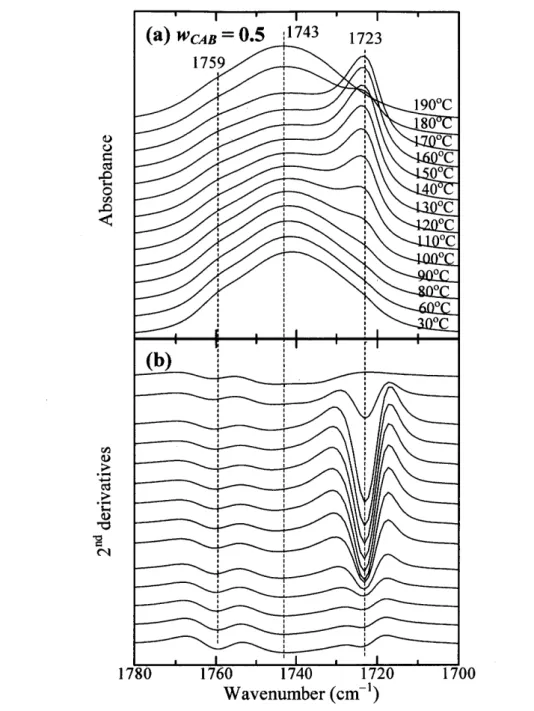
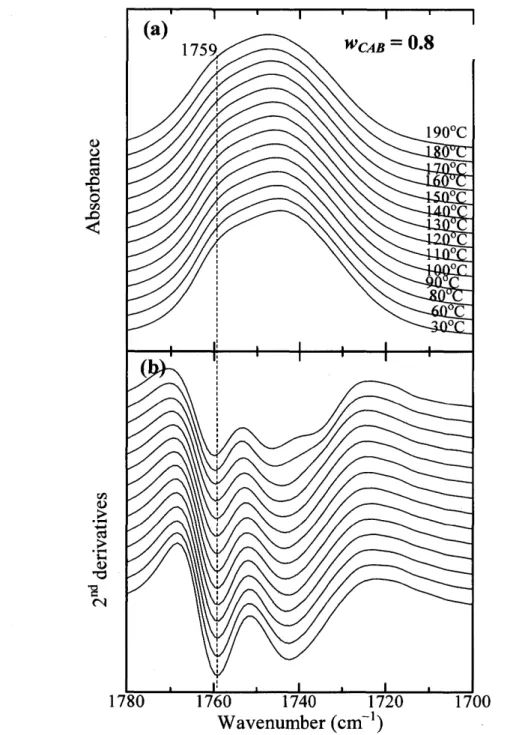
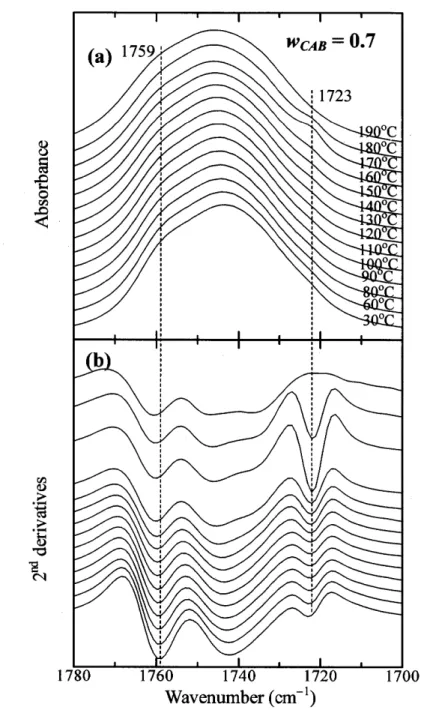
(34) Abstract Relationships between composition- and temperature-dependent intermolecular interactions and cold crystallization behavior ofpoly(3-hydroxybutyrate) (PHB)1 cellulose acetate butyrate. (CAB) blends have been investigated mainly by using infrared (IR) spectroscopy, together. with differential scanning calorimetry, and wide angle X-ray diffraction (WAXD). Weak intermolecular hydrogen bondings between OH groups in CAB and C=O groups in amorphous part of PHB define as inter were detected in OH stretching bands of the blends. These. interactions occur in the blends with high CAB content (wcAB) and highly depend on temperature. For all the blends having O.2 S wcAB S O.7, when temperature is raised (e.g., above. 90eC for the blend with wcAB = O.5) the cold crystallization of PHB was discerned, as evidenced by an increase of the absorbance of the band due to C=O stretching in the crystal field. The crystallization was found to involve the dissociation of inter and transformation of. inter into intramolecular hydrogen bondings within PHB and within CAB as summarized in Table 2 in this text, which promotes the crystallization and enhances stabilization of the. crystals. Consequently, the crystallizaticn of the PHB is influenced by exchanges of the hydrogen bondings as described above with raising temperatures. X-ray diffraction from PHB crystals in the blends show a remarkable decrease of crystallinity with wcAB and eventually. disappear when wcAB ) O.8.. -29-.
(35) 1. Introduction. Recently, the vast wastes of plastic products have become a serious environmental. problem, because the majority of them are made from synthetic polymers that cannot be degraded in environments. Biodegradable polymers are one ofthe most promising alternative substances for solving this serious problem, because oftheir superior biodegradable properties. compared to those ofsynthetic polymers i-3. Besides being degradable, they can be produced. also as renewable sources that are environment-friendly. As a biosynthesized aliphatic polyester and biodegradable thermoplastic, poly(3-hydroxybutyrate) (PHB) (Figure 1(a)) has been attracting a considerable practical attention for the biodegradability, biocompatibility, and. possibility ofthe synthesis from glycerol.4 For these advantages, their crystal structure artd. thermal or crystallization behavior have been extensively studied by using various teclmiques from the academic viewpoint as well as from the view point ofpractical applications.. However, as a biologically produced stereo-regular macromolecule, PHB is highly crystalline and, hence, rigid and brittle,5 which also acts as a kind of defect for some practical applications. It has a high melting temperature relative to its thermally stable temperature range,. which also acts as a defect for its melt processability. From the industrial viewpoint, these. defects are really serious for the wide-scale practical applications. Thus, PHB copolymers. were synthesized such as polyhydroxybutyrate-ran-hydroxyvalerate (PHB-co-PHV)6-8 and graft copolymer of atactic PHBIPoly(methyl methacrylate) (PHB-g-PMMA).9 In addition, several polymers such as poly(ethylene glycol) (PEG) [10],iO poly(ethylene oxide) (pEO),ii. poly(vinyl acetate) (PvAc),i2' i3 poly(4-vinylphenol) (PVPh),i4' i5 poly(vinyl alcohol) (pvA),i6 polylactide (pLLA),i7 and cellulose esters (CE)2' i8-22 have been selected to be blendea' for lowering the melting temperature and enhancing the processability.. In view of actual applications, blending between PHB and CE, especially for amorphous cellulose acetate butyrate (CAB) hold very promising features such as the elongation at break and toughness.2 Miscibility analysis ofPHBICAB blends was investigated. by Scandola et al. using dynamic-mechanical thermal analysis (DMTA) measurements.i8 They reported that the blends ofPHBICAB are miscible in the amorphous states. The result was in agreement with that by Ceccoru11i et al. who further investigated effects of low molecular weight plasticizer on the miscibility of PHBICAB blends.i9 Pizzole et al.,20 who explored miscibility between PHB and two kinds ofCAB in the melt, reported that no interspherulitic segregation was observed, when the blends were crystallized under the given crystallization conditions. Recently, El-Shafee et al.2i confirmed the miscible blend in melts, showing the. -30-.
(36) effect ofthe equilibrium melting-point depression ofPHB crystals upon the addition of CAB. Moreover, it was found that, after crystallization of the PHB component in the blends, CAB. exists in the interlamellar amorphous regions and becomes a major component there, as detected by small-angle X-ray scattering (SAXS).2i In the drawing process ofblend, Park et al.. indicated that the orientation behavior of PHB crystals in the blends changes from c-axis orientation to a-axis orientation with an increase in the CAB content.22 However, in all ofthe. previous studies described above, intermolecular interactions and their effects on crystallization in PHBICAB blends have not been fu11y explored yet. The purpose of the present study is to investigate the intermolecular interactions and. their effects on crystallization behavior of PHB/CAB blends, primarily with infrared (IR). spectroscopy, together with differential scanning calorimery (DSC) and wide-angle X-ray. diffraction (WAXD) as supporting experimental methods, as a fUnction of the blend composition and temperature. The IR results obtained suggest the existence of weak intermolecular interactions between the C=O groups of PHB and the O-H groups of CAB (designated hereafter as inter). Moreover, the estimated crystallinity from WAXD patterns of. the blends suggests that the crystallinity of PHB in the blends is influenced by the intermolecular interactions.. -31-.
(37) 2. Experimental Section. 2.1 Materials and sample preparation. The bacterial PHB (number-average molecular weight, M., is 2.9xl05) and CAB (number-average molecular weight, M., is 6.5xl04) were purchased from Aldrich Chemical Co., Ltd., and were used as received. Chemical structures ofboth samples are given in Figure 1 .. As shown in Figure 1(b), the CAB polymer consists of hydroxyl groups, acetyl groups, and butyryl groups. The weight fraction of each group with respect to the total weight of CAB is. O.O089, O.293, and O.18, respectively. Thus, the number of each group per single CAB chain is 6.5xl04xO.89Å~10-2/17.0 = 34.0 for hydroxyl groups, 6.5Å~104xO.293143.04 = 442 for acetyl groups, and 6.5Å~104xO.18/71.1 == 165 for butyryl groups.. Samples of PHBICAB blends were prepared by mixing the prescribed amount of powders and then dissolving them in chloroform. The as-prepared solutions were cast into. films of about 5 mg in weight in an aluminum pan for DSC measurements. For WAXD analysis, the solutions were cast on copper plates to form thin films with the thickness of. around 200 pm. For IR spectral measurements, thin films specimens of the thickness of around 10 pm were prepared by casting the solutions on CaF2 substrates. All the prepared films were allowed to evaporate solvent at room temperature for forming thin films. Then, the films were put in a vacuum oven at 60 OC for 16 hrs to completely remove the residual solvent. and then naturally cooled down to room temperature for the measurements. The films thus prepared are designated hereafter as "as-prepared films" and used for DSC, WAXD, and IR. measurements.. 2.2 DSC Thermal analyses ofthe blends were performed with a Perkin-Elmer Pyris 6 by sealing the as-prepared films in an aluminum pan, and a pure indium was used as a standard material for temperature calibration of the calorimeter. For a standard thermal characterization of the. blends with DSC, the blends were firstly melted at 190 OC for 1 min to erase the previous thermal history. Then, the DSC thermograms were obtained in the first cooling run from 190 OC to -40 OC at a rate of20 OCImin and in the second heating run from -40 OC to 190 OC ata rate of 20 OC/min. The thermal properties of blends such as the glass transition temperature (Tg), cold crystallization temperature (Tcc), melting temperature (T.), and enthalpy of fusion. (ZVV.) were determined from the thermograms of the second heating run (see Table 1).. -32-.
(38) Moreover, the net cystallinity (X,) of each blend as a whole, including amorphous CAB, was also determined using the following equation (see also Tablel):. x.=MZV[i,l.ii, (1) where ZVilSHB is the enthalpy of melting of pure PHB crystals, i.e., neat PHB having 1000/o crystallinity, (146 Jlg) 23' 24; zVV. is the measured enthalpy of fusion in each blend.. We tried directly to compare the cold crystallization behavior of the blends as. observed by IR spectroscopy with that as observed by DSC. For this purpose, the DSC analyses also were deliberately conducted in the first heating run of the as-prepared samples at a slow heating rate of2 OCImin, which is close enough to the average heating rate used for the IR spectroscopy on the as-prepared sample, as will be detailed in the next section.. 2.3 Measurements of Fourier-transform infrared (FT-IR) spectroscopy FT-IR spectra of the blends in the region of 4000-800 cm-i were collected with a Thermo Nicolet Magna 870 spectrometer equipped with a mercury cadmium telluride (MCT) detector. The normal transmission mode was applied to the spectral measurements. To obtain an acceptable S/N, the spectra were accumulated over 256 scans with a 2 cm'i resolution. The. as-prepared specimens was stepwisely heated from 30 to 80 OC with an increment of 10 OC, and from 80 to 190 OC with an increment of5 OC at heating rate of 1O OCImin in between the. two closet temperatures by using an Instec thermoelectric control unit (HCS302, INSTEC Inc., USA) with an accuracy ofÅ} O.1 OC. During the stepwise heating process, the cell was maintained at each temperature for 3 min after reaching the preset temperature to equilibrate. the specimen at that temperature before the FT-IR measurement and the measurement was conducted for 3 minutes at that temperature. After the measurement the specimen was heated to the next higher temperature, and this process was repeated. An average overall heating rate is. approximately O.9 OCImin.. 2.4 WAXD Measurements WAXD patterns of the as-prepared blend films were measured with a Rigaku RINT2100 X-ray diffiractometer equipped with a scintillation detector (Rigaku PT30). The diffraction patterns were recorded at room temperature from 2e= 1 1 .5 to 350 at a scanning rate. -33-.
(39) ofO.2 O/min. The X-ray beam of Cu-Kct radiation was generated at 40 kV and 50 mA and passed through a Ni filter (wavelength: O.154 nm).. -34-.
(40) 3. Results and discussion. 3.1 DSC Studies. DSC thermograms of the blends with various compositions measured in the first cooling run and the second heating run are shown in part (a) and (b) in Figure 2, respectively.. Hereafter the blend composition wi11 be denoted by weight fraction of CAB, wcAB, too. The pure PHB sample was rapidly crystallized in the first cooling process, while the crystallization. in the blends was suppressed as typically shown for PHB/CAB = 9011O and 80120 (wcAB= O.1 and O.2) (see Figure 2a). The cold crystallization temperature (T..) of the blends, which is clearly observed as an endothermic peak, in the second heating process was slightly shifted to a. higher temperature with increasing wcAB, as obviously seen for the blends with O.2S wcAB S O.7. in Figure 2(b). On the contrary, the endotherm for the cold crystallization was not clearly. discernible for pure PHB. This may be because the first cooling process involves enough crystallization, which in turn suppresses tn' e cold crystallization in the second heating run. On. the other hand, the blends did not undergo enough crystallization in the first cooling process so that they underwent the remarkable cold crystallization in the second heating process.. The DSC thermogram of pure PHB in the second heating run shows double melting-endothermic peaks. The melting temperature (T.) of the blends shifts to a lower temperature with wcAB (Table 1). The melting endotherm cannot be observed for the blends. with wcAB ) O.8, so that the blends are amorphous, which will be due to formation of physically crosslinked network in the blends via inter between PHB and CAB as well as intramolecular hydrogen bondings within CAB, as will be discussed later in section 3.5. The enthalpy ofmelting also decreases with,wcAB (see Table 1).. On the basis ofthe report by Gunaratne et al.25, the double melting thermogram can be explained by the effect ofthermal history, i.e., the crystallization condition ofPHB. In the neat. PHB, the first endothermic peak is due to the melting of the crystals crystallized in the first. cooling process, while the second peak is due to the recrystallization and melting of the crystals. The melting temperature of the blend decreases with wcAB, partly (i) because of an. increased entropy of melting upon mixing PHB and CAB and partly (ii) be,cause of a greater suppression of mobility of PHB component for the cold crystallization with increasing wcAB, that creates less perfect crystallites with enhanced distortions of the intramolecular hydrogen bondings within PHB crystals, as will be detailed later. We think the latter effect (ii) dominates. the former effect (i) on the melting point depression with wcAB, because the entropy ofmelting. of the blends ass'ociated with mixing PHB and CAB chains is expected to be small for the. -35-.
(41) blends with high molecular weights. Although these blends have been reported to be entirely miscible,i9-22 the relationship of Tg vs wcAB is far from that expected to the Fox law.26 The Tg's of blends observed slightly. shift to a lower temperature than pure PHB with wcAB up to wcAB - O.6, followed by a slight increase of the Tg with further increase of wcAB from O.6 to O.7. wnen wcAB > O.7, this low Tg is obscured and the Tg shifts steeply to a higher temperature with wcAB at wcAB > O.8. For the. blend with wcAB = O.9, the thermogram around Tg (shown by the arrow) was highlighted in the inset to Figure 2(b). The characteristic parameters for the thermal properties ofthese blends are. summarized in Table 1. Even though all the blends apparently exhibited,single Tg, The Tg vs wcAB behavior may infer existence of the two Tg's due to the local heterogeneities ofthe blend. composition mediated by a difference in the "self-concentration" of the stiff (CAB) and flexible components (PHB) in the blends.27' 28 Probably the higher Tg for the blends with wcAB S O.7, if it existed, is obscured by the cold crystallization ofPHB.. Figure 2(c) and its inset present a typical DSC thermogram taken in the first heating. process of the as-prepared blend sample with wcAB = O.5 at a slow heating rate of2 OC/min. The experimental conditions chosen here are almost the same as those chosen for the FT-IR. studies to be discussed in the sections 3.2 and 3.5 for a fair comparison of the thermal analyses of DSC and FTIR. It is noted that the cold crystallization of the as-prepared blend sample at the slow heating rate is not so obvious as that found for the same blend sample in. the second heating run shown in Figure 2(b). We interpret the disparity described above is due to the fact that the crystallization occurred sufficiently during the preparation process of. the as-prepared sample, hence suppressing the cold crystallization in the as-prepared sample in the first heating process. As will be shown later in conjunction with Figures 8 and 9, the. FTIR clearly indicated the cold crystallization in the temperature range between 80 and --. 1300C. Based on the FTIR result, we attempted to draw an expected DSC thermogram by. dotted line in the case where the cold crystallization did not occur. The downward deviation. of the real thermogram from that shown by the dotted line is very roughly assigned to be an endotherm due to the cold crystallization and partial melting of the crystals formed. Figure. 2(c) also exhibits the double melting thermogram. The first endothermic peak may be due to the melting of the crystals formed in the preparation process of the as-prepared sample and those formed in the cold crystallization process in the first heating process, while the second. endothermic peak may be due to the recrystallization ofmolten crystals in the first endotherm and melting process of the recrystallized crystals.. -36-.
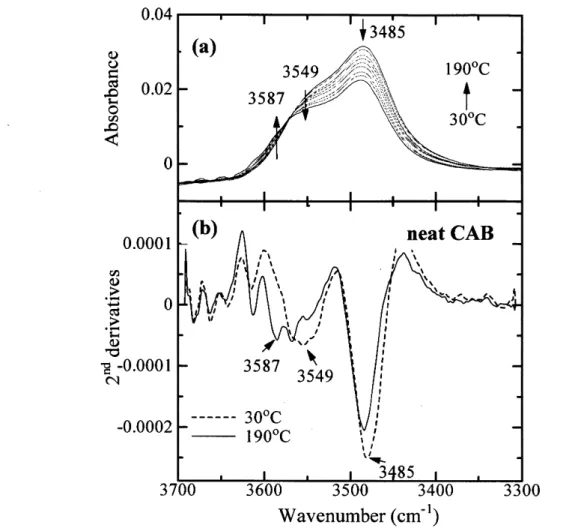
(42) 3.2 Temperature-dependentIRspectralvariationsofpureCAB To explore molecular interactions, specifically hydrogen bondings, of the blends, temperature-dependent IR spectra ofneat CAB were first investigated.. Figure 3(a) presents IR spectra in the OH stretching region of3700-3300 cm'i ofpure. CAB measured in the heating process of the as-prepared sample from 30 to 190 OC. It is. important to note the fact that the OH stretching bands can clarify or focus on the intermolecular and intramolecular interactions ofOH groups within CAB, no matter how small is a number fraction ofOH groups per single CAB chain [34.01(34.0+442+165) == O.053 molO/o] compared with other groups, acetyl and butyry1 groups. The selected second derivative spectra. at 30 and 190 OC are given in part (b). One can easily recognize one broad band at 3485 cm"i and two weak shoulders at 3587 and 3549 cm-i. It is noted that the intensity of the 3485 cm-i. band decreases significantly, as indicated by the downward arrow, and shifts toward a higher. wavenumber of -3489 cm-i with temperature. The intensity of the 3549 cm-i band also decreases, as indicated also by the downward arrow, and shifts towatd a higher wavenumber. On the other hand, the intensity at 3587 cm'i certainly increases as shown by the' upward arrow. The present results together with the previous ones on cellulose and CAB22'29 lead us to assign. the band at 3485 cm-i to the OH stretching mode of inter-chain hydrogen bondings (C=OeeeH-O) (defined as inter CAB-CAB),22 while the band at 3549 cm-i may be ascribed to. intramolecular hydrogen bondings of OHeee-O- (ether) and O-HeeeO==C in CAB (defined as. intra CAB-CAB). This is because the absorbance of these bands (3549 and 3485 cm-i) decrease with temperature, as typically observed for bands associated with hydrogen bondings, and because of the relative peak positions of the two bands relative to that at 3587 cm"i.29 We. should note here that CAB contains much more C=O groups than cellulose and its derivatives contain. The third peak at 3587 cm-i arises from free O-H groups, because it appears at the. highest wavenumber and increases with temperature as shown by the upward arrow in Figure 3(a).29-3i The results in Figure 3 reveal that most of the OH groups of CAB are involved in. the hydrogen bondings, although the fractions of OH groups themselves are small among all the substituent groups.. The gradual intensity decreases in the bands at 3485 and 3549 cm-i together with the. higher wavenumber shift with temperature suggest that both inter CAB-CAB and intra. CAB-CAB become weak and some of them undergo dissociations with temperature. The intensity increase in the free OH stretching band is not so 1arge, qualitatively indicating that a. rather small fraction of the hydrogen bondings are dissociated into the free OH groups,. -37-.
図

+7


Outline
WAXD Measurements
Composition-dependent IR spectra
Composition-dependent Variation of the Characteristic IR Bands due to the C=O Stretching Mode at Melts
Analyses and Discussion of Crystallization Kinetics Based on the C=O Stretching Bands of PHB
Discussion about Consequences of Avrami Analyses. Table 3 compared the results obtained from the Avrami's analyses where the analyses done for the amorphous bands of
Existence of Two Tg's in Amorphous phase of the Blends. Figure 9 sumniarized various characteristic temperatures as evaluated in this work as a function of the blend
Classification of the Imaging Spectra in the Spherulite of PHB/CAB BIends by Principal Component Analysis (PCA)
OO024 OOO12
関連したドキュメント
Keywords: continuous time random walk, Brownian motion, collision time, skew Young tableaux, tandem queue.. AMS 2000 Subject Classification: Primary:
Answering a question of de la Harpe and Bridson in the Kourovka Notebook, we build the explicit embeddings of the additive group of rational numbers Q in a finitely generated group
Then it follows immediately from a suitable version of “Hensel’s Lemma” [cf., e.g., the argument of [4], Lemma 2.1] that S may be obtained, as the notation suggests, as the m A
Definition An embeddable tiled surface is a tiled surface which is actually achieved as the graph of singular leaves of some embedded orientable surface with closed braid
We give a Dehn–Nielsen type theorem for the homology cobordism group of homol- ogy cylinders by considering its action on the acyclic closure, which was defined by Levine in [12]
Our method of proof can also be used to recover the rational homotopy of L K(2) S 0 as well as the chromatic splitting conjecture at primes p > 3 [16]; we only need to use the
The proof uses a set up of Seiberg Witten theory that replaces generic metrics by the construction of a localised Euler class of an infinite dimensional bundle with a Fredholm
This paper presents an investigation into the mechanics of this specific problem and develops an analytical approach that accounts for the effects of geometrical and material data on
