Examining Trustworthiness in Canadian and Japanese Cultural Context: How to quantify the distance between two groups, each consisting of 3-dimensionally estimated objects? (Maximum Likelihood and Bayesian Methods)
36
0
0
全文
(2) 113 Komiyama (1995) ([Yamagishi and Komiyama, 1995]) tested a series of predictions involving US‐Japan contrasts derived from Yamagishi^{1}s the‐ ory of trust that emphasizes the role trust plays in “emancipating”people. from commitment relation. They found that Americans are higher in gen‐ eral trust, Japanese have higher expectations of benefit from maintaining. relations with specific others, Americans consider information role of repu‐. tation more important, and Americans consider honesty and fairness more important.. Trustfulness through experiments. Knowledge on many aspects of trustfulness has been accumulated over the years through carefully designed experiments as well. It started out as an investigation into somewhat different but related topic of cooper‐. ation measured by the contribution to a public good, members of five‐person groups decided whether they would contribute their resource. money to the provision of a public good when expectation of other mem‐ bers’ cooperativeness was manipulated in an experiment in Sato and Ya‐. magishi ([Sato and Yamagishi, 1986]). They found, for instance, trust in other members and the motivation of free‐riding had more effects upon. subjects? cooperation when subjects believe that other members’ cost for. cooperation (the amount of resource money they were required to con‐ tribute) was high. Yamagishi and Sato ([Yamagishi and Sato, 1986]) ex‐ perimentally investigated two motivational bases for not contributing to a. public good‐desire to “free ride” (or greed) and fear of being a “sucker.” They found fear would have a strong effect but greed would not when a public good is produced conjunctively, that is, by individuals working in. union and every member‘. s. contribution is essential. Also the greater mu‐. tual trust existing among friends would make them contribute more than strangers would in this conjunctive condition. On the other hand, they 2.
(3) 114 found greed would have a strong effect but fear would not when a public. good is produced disjunctively or by one or a few member’. s. cooperative. action.. On the validity and raison d?etre of a prisoner’s dilemma (hence‐ forth PD) game and its variants in differentiating trust, assur‐ ance, and cooperation, Hayashi et al. (1999) ([Hayashi et al., 1999]), arguing that many participants treat a prisoner^{1}s dilemma game as an as‐ surance game and respond in a reciprocal manner to the choice or expected. choice of their partner, examined two control-for. bases- general. trust and a sense of. the expectation of a partner^{1}s cooperation in one‐shot prisoner^{1}s. dilemma games and why they expect general trust and a sense of control to play different roles in different societies. They found that a sense of control plays a relatively more important role as a foundation for expec‐ tations in Japanese society and general trust plays the more important. role in American society.Yamagishi et al. (2005) ([Yamagishi et al., 2005]) summarized the major findings discovered by experimental studies using. a prisoner^{1}s dilemma games with choice of dependence (henceforth PD/D) that have been published previously only in Japanese and discussed some. of their implications. They define trustfulness, or an act of trustfulness, as an act that voluntarily exposes oneself to greater positive and negative externalities by the actions of the other (s) , while cooperation as an act that. increases the welfare of the other(s) at some opportunity cost where the former is greater than the latter. PD/D allows each player separately to choose the level of trust she wants to place in the other player, and the behavioral choice to cooperate or defect with the other. That is, it allows the players to make separate decisions to trust and to cooperate, and thus allows the researchers to study the two processes separately. In PD/D,. it is possible for players to choose to cooperate with the others without trusting them. They found that it is cooperation which leads to trust, not. the other way around and demonstrated that separating trust from cooper‐ 3.
(4) 115 ation is critical for building trust relations. Matsuda and Yamagishi (2001) ([Matsuda and Yamagishi, 2001]) examined the relationship between coop‐ eration and trust in interpersonal trust formation through a PD/D and re‐ vealed a more nuanced result obtained through a simple iterated prisoner^{1}s dilemma games. That is, participants in the PD/D adopted “cautious and. unconditional cooperation strategy”rather than tit‐for‐tat strategy. Terai. et al. (2003) ([Terai et al., 2003]) conducted two experiments using the PD/D and found that the cooperation rate was extremely high (95.1%) while the game was being repeated, but only half of the subjects coop‐. erated in the final game, suggesting ‘ shadow of the future ” (Axelrod, 1984) ([Axelrod, 1984]) in play in forming cooperation. Nonetheless, most subjects trusted a partner who had behaved cooperatively toward them. in the repeated games (i.e. under an incentive structure that encouraged such behavior), even in the final game, in which such an incentive basis was absent, indicating that the subjects failed to distinguish the two bases of expecting benign behavior from interaction partners‐trust based on the inferred personal traits of the partner and assurance of cooperation based on the nature of the incentive structure.. On the conditions under which trust is being formed, Yamagishi. and Komiyama (1995) ([Yamagishi and Komiyama, 1995]) through a series of laboratory experiments successfully confirmed: the most standard so‐. lution to problems caused by social uncertainty is commitment formation, i.e., formation of stable and durable relations with reliable partners; high. trusters (those who have a high level of trust in people in general) would be easier to leave a commitment relation that had been formed in order. to reduce social uncertainty. Yamagishi et al. ([Yamagishi et al., 1995]) distinguishing two kinds of. trust- general. and particularistic trust, and. in an experiment simulating buyer‐seller relations, found support for the following: social uncertainty promoted commitment formation; commit‐. ment formation promoted one partner^{1}s trust in the other (which they 4.
(5) 116 called particularistic trust); as a result of the above two effects, social un‐ certainty promoted the general level of particularistic trust in a group; general trust, which was defined as a general belief in human benevo‐. lence, suppressed commitment formation. Kakiuchi and Yamagishi (1997) ([Kakiuchi and Yamagishi, 1997]) examined the development of trusting relationships as investments in relation‐specific assets through a new ex‐. perimental game called “the dilemma of variable interdependency”based on iterated prisoner^{1}s dilemma game. This game will be called later as a. prisoner^{1}s dilemma games with choice of dependence (PD/D) as mentioned. in Yamagishi et al. (2005) ([Yamagishi et al., 2005]). It was invented inde‐ pendently of Van Lange and Visser (1999) ([Van Lange and Visser, 1999]) and was first published in Kakiuchi and Yamagishi (1997) a couple of years before theirs. Mashima et al. (2004) ([Mashima et al., 2004b] ) exam‐ ined the role of trust in relationships between temporary partners through. PD/D and PD and found that trust serves as a signal of the player^{1}s in‐ tention, which in turn promotes mutual cooperation. Cook et al. (2005) ([Cook et al., 2005]) arguing that a series of risk‐taking behaviors is indis‐ pensable to building a trust relation, conducted experiments in Japan and the United States to examine the independent and cross‐cultural effects of. risk taking on trust building. The results of these experiments indicate that the American participants took more risks than did the Japanese, support‐ ing the general claim that Americans are inclined toward risk taking and. trust building. Kiyonari et al. (2006) ([Kiyonari et al., 2006]) provided an answer to whether trusting begets trustworthiness. In two experimen‐. tal games with Japanese and American participants, respectively in Trust and Faith Games and found that trust does not beget trustworthiness, at. least in one‐shot games. Yamagishi et al. (2015) ([Yamagishi et al., 2015]), tackling the problem that attitudinal measures of general trust often fail to predict actual trusting behavior in laboratory testing, proposed that mea‐ sures of attitudinal trust is more successful in predicting behavioral trust 5.
(6) 117 when they tap both the responder^{1}s belief that his/her trust will be hon‐. ored and his/her preference to be a trusting person. They demonstrated that the newly constructed measure including these two responder^{1}s belief better predicted behavioral trust in a trust game. On the characteristics and contrasts of high and low trusters,. Kikuchi et al. ([Kikuchi et al., 1997]) tested and supported a hypothesis that subjects who are more trusting of others in general (high‐trusters) are more accurate than low‐trusters in judging trustworthiness of others. as Rotter (1980) ([Rotter, 1980]) claims through an experiment, indicat‐ ing high‐trusters are shown to be prudent people who pay careful atten‐ tion to information potentially revealing. other^{1}s. lack of trustworthiness.. Yamagishi et al. ([Yamagishi et al., 1998]) tested and confirmed the pre‐ diction that social uncertainty promotes commitment formation between particular partners and high trusters tend to form committed relations less frequently than would low trusters when facing social uncertainty through two experiments conducted in the United States and Japan. Ko‐. sugi and Yamagishi (1998) ([Kosugi and Yamagishi, 1998]) demonstrated that trustful people are more sensitive to information that indicates lack. of trustworthiness in other people through two experiments. Yamagishi et. al. ([Yamagishi et al., 1999]) conducted a series of experiments in Japan showing that high trusters (as measured with a general trust scale) are more sensitive than low trusters to information potentially revealing lack of trustworthiness in others and judge other people^{1}s choice in a one‐shot prisoner^{1}s dilemma more accurately.. On ingroup versus outgroup trust formation, Mashima et al. (2004) ([Mashima et al., 2004a] ) in a PD/D experiment participated by Ameri‐ can and Japanese students, found no evidence of ingroup bias in terms. of trust and cooperation.. However they found that American partic‐. ipants were more sensitive than Japanese counterparts, to information regarding the past trust behavior of other players when they were de‐ 6.
(7) 118 ciding whom they trust and whether or not they reciprocate. trust.. Suzuki et al.. another^{1}s. (2007) ([Suzuki et al., 2007]) tested that expecta‐. tions of generalized reciprocity within. one^{1}s. own group are responsible for. in‐group trust through an allocator choice game in the minimal group. situation.. Participants’ in‐group trust is derived from the general be‐. lief that people treat in‐group members more favorably than out‐group. members—a belief about generalized reciprocity within groups. Kiyonari. et al. (2007) ([Kiyonari et al., 2007]) conducted experiments called Trust and Faith games. In both Trust and Faith Games, one person plays a role of the distributor of 2,. 500JPY. and the other person plays a role of the. receiver with two choices, receiving 1,. 000JPY. for certainty, or receiving. whatever the amount the distributor decides. In the Trust game, both the distributor and the receiver make the decision simultaneously and the distributor does not have the information on receiver^{1}s decision, while in. the Faith game, the distributor makes the decision after learning. receiver^{1}s. decision. In other words, in Faith game, the receiver can expect rewarding and possibly mutually beneficial behavior on the part of the distributor for. his/her decision. They tested and confirmed that a prediction that peo‐ ple show stronger trust of in‐group members than of out‐group members. in the Faith game but not in the Trust game. In Foddy et al. (2009) ([Foddy et al., 2009]), when offered participants a choice between an un‐ known monetary allocation made by an in‐group (university or major) or an out‐group allocator, both of whom had total control over the distribution of an identical sum of money, participants strongly preferred the in‐group allocator. This preference occurred regardless of whether the stereotype of the in‐group was relatively more positive or more negative than that of the out‐group. However, this preference did not persist when partici‐ pants believed that the allocator was unaware of their group membership.. Platow et al. (2012) ([Platow et al., 2012]) evaluated the role that com‐ mon knowledge of a shared social group membership between self and a 7.
(8) 119 to‐be‐trusted stranger provides as a basis for trusting this stranger in two experiments. This common knowledge emerges when the truster knows the. group membership of the to‐be‐trusted other, and believes that this other also knows the group membership of the truster. They show that people are more likely to trust an in‐group member over an out‐group member under. conditions of common group‐membership knowledge rather than private. group‐membership knowledge (i.e. other does not know truster^{1}s group). Yuki et al. (2005) ([Yuki et al., 2005]), on cross‐cultural trust and cooperation, explored differences in depersonalized trust (trust toward a relatively unknown target person) across cultures. Based on a theoreti‐ cal framework that postulates predominantly different bases for group be‐ haviors in Western cultures versus Eastern cultures, it was predicted and. supported by two experiments that Americans would tend to trust peo‐ ple primarily based on whether they shared category memberships, while. Japanese was expected to be based on the likelihood of sharing direct or in‐. direct interpersonal links. Kuwabara et al. (2007) ([Kuwabara et al., 2007]) conducted a variation of the Trust game in two different experimental con‐. ditions:. a. “flags‐on”condition in which everyone^{1}s nationality was publicly. identified during the session, and a “flags‐off”condition in which partic‐. ipants did not know who was Japanese or American using a Web‐based “virtual lab” to study trust and trustworthiness between Japanese and. Americans in real‐time interaction. They found a support for Yamagishi ’ s. structural theory of trust, in that Japanese will form more durable ex‐. change relations compared to Americans. However, they found less support for explanations that focus on cultural differences in trust and trustwor‐. thiness, and for cognitive explanations that point to the effects of a shared social identity between participants and partners with common nationality.. University students from Japan, China, and Taiwan participated in exper‐ iments involving participants from their own society and another society. in real time using an intercultural trust paradigm derived from a game 8.
(9) 120 theoretic and evolutionary approach to social exchange in Takahashi et al.. (2008) ([Takahashi et al., 2008]). They found that Japanese collectivism is based more on long‐term assurance networks, whereas Chinese collectivism provides a more expansive, guanxi‐based approach to building new social. networks. Japanese also showed less in‐group favoritism in both trust and. trustworthiness (or conditional fairness) at the national‐level compared to cultural Chinese. Liu et al. (2011) ([Liu et al., 2011]), using a dyadic game theory paradigm, conducted three experiments—China vs Japan, China vs Taiwan, Taiwan vs Japan—on the social dilemma of trust over the Inter‐. net in real time, involving real money. It was predicted and found that ingroup favoritism in trusting behavior was contingent on historical re‐ lationships between societies. They found Japanese were unique in not displaying ingroup favoring behavior at all, whereas both Chinese and Tai‐ wanese were context specific in their in‐ group favoritism. In Yamagishi. (2011) ([Yamagishi, 2011]), he wrote that collectivist societies produce se‐ curity, but destroy trust: In collectivist societies, people are connected. through networks of strong personal ties where the behavior of all agents. is constantly monitored and controlled; As a result, individuals in collec‐ tivist networks are assured that others will abide by social norms, and gain a sense of security erroneously thought of as “trust;”However, this book argues that this security is not truly trust, based on beliefs regarding the integrity of others, but assurance, based on the system of mutual control within the network. When the political tide in many countries has shifted inward, with skepticism and reluctance to cooperate with other countries,. Romano et al. (2017) ([Romano et al., 2017]) conducted an experimental study in 17 countries designed to test several theories that explain why, who, and where people trust and cooperate more with ingroup members, compared with outgroup members. In addition to the standard finding that participants trust and cooperate more with ingroup than outgroup mem‐ bers, they obtained findings that reputational concerns play a decisive role 9.
(10) 121 121 for promoting trust and cooperation universally across societies. Trustworthiness. Perhaps because trustfulness have been investigated so extensively as described above, it is natural to focus on the receiving end of that trustful‐ ness. We observe upsurge of interest in the constructs of trustworthiness. in the social science research literature recently. Along with it, a recog‐ nition of the importance of developing more contextual understandings of. these constructs ([Li, 2007]; [Doney et al., 1998]) has emerged, with some theorists explicitly asserting that trust always depends on context (e.g. [Hardin, 2002]). For that end, we formed in April 2018 the Trustworthiness Research Alliance at https://www.trustworthiness. ca/index.htm, an international and multidisciplinary group of researchers who investigate trustworthiness and the role that perceptions of the trustworthiness of in‐. dividuals, organizations, and institutions plays in decisions to take the leap of faith we know of as “trust.”. Societal culture has been identified as one important contextual factor. in determining expectations of trustworthiness as “simply put, culture is a. shared agreement (usually implicit) about how to approach the world and each othe7^{f} ’ ([Whitener et al., 2000], p.4). We already described how soci‐ etal culture may matter to trustfulness above, the same can be said for trustworthiness. What remains lacking, however, is an explicit, empirical. examination of the context within which decisions related to trust are made. and direct empirical assessments of trustworthiness. This research explic‐ itly examines the bases for determining trustworthiness in the Canadian and Japanese sociocultural context.. 10.
(11) 122 Trustfulness and Trustworthiness. While related, the two constructs of trustfulness and trustworthiness are. distinctly different. Trustfulness, an abstract construct, is a willingness to. place ones’ self in a vulnerable position to another([Saunders et al., 2014]); Trustworthiness comprises an assessment of another’s likelihood of honor‐. ing that vulnerability. Implicit in the willingness to trust is an appraisal of whether or not another individual is worthy of that trust. This calculation is based on a number of assessments, such as a deter‐ mination of the extent to which the other party is able to, willing to and. responsible enough to be trusted. [Mayer et al., 1995] cite three important characteristics of a potential trustee — the ABI framework.. Ability A degree of trustee competence in the realm in which trust will be extended.. Benevolence An assumption that the potential trustee has the potential trustor’s best interests at heart.. Integrity A perception that the potential trustee is a person who upholds moral standards that are deemed appropriate by the potential trustor.. Trustworthiness, as an assessment of the extent to which one is willing to be vulnerable, focuses on the other party and implicitly suggests that some current or future interaction will occur between the trustor and the trustee.. Being willing to trust another implicitly reflects social decision making and. incorporates a social exchange ideology ([van’t Wout and Sanfey, 2008]). While each party to a social exchange brings expectations based on that individua1^{1}s. personality (e.g. level of dependence versus independence), ex‐. pectations are also based on examples of role exchanges that the individual. has been exposed to (e.g. relationships within a specific societal culture). Social exchanges do not, however, occur in a vacuum—each party to a social exchange brings expectations that are based on personality as well 11.
(12) 123 as expectations that are based on examples of role exchanges that an in‐ dividual has been exposed to. These expectations are based, at least in. part, on the context that these decisions are made within ([Hardin, 2002]; [Li, 2012]). It has been argued that all situational contexts within which people operate are given meaning by culture ([Matsumoto, 2007]). Societal culture has a profound impact in individuals, as individuals are socialized early on to internalize a culture’s values and norms of behavior. Culture therefore functions as a critical context for interactions, as individual behav‐. ior is shaped by what that person has learned is rewarded or punished within. that cultural context ([Bond and Smith, 2018]), and has a fundamental role in shaping how trust develops.. As Markus and Kitayama (1991) ([Markus and Kitayama, 1991]) sug‐ gested for culture and the self, we are interested in observing, for instance, “on average, relatively more individuals in Canadian culture will hold the. integrity to be the dominant components in the ABI framework than will individuals in Japanese culture. Within a given culture, however, we are ready to accept that individuals will vary in the extent to which they are good cultural representatives and consider trustworthiness in the mandated way. 2. Data. Undergraduate students (n=238) at a university in Ontario, Canada and similarly undergraduate students (n=237) at a university in Ibaraki, Japan, were recruited for this study. Of those, two from Canadian sample and three from Japanese sample were listwisely‐deleted because of their extensive missing values. Therefore our sample consist of 236 Canadian. and 234 Japanese undergraduate students. Although students generally have limited organizational experience, their perception of social culture on trustworthiness is within their realm of experience and were considered 12.
(13) 124 an appropriate population for the study. Participants were asked to describe a trustworthy person, friend, family member, colleague, and supervisor by responding and writing down in their. own words to statements such as “A trustworthy person (friend, family member, colleague, or supervisor) is someone who is or does — For Japanese sample, the original English questionnaire items were trans‐ lated into Japanese and another independently back‐translate the Japanese‐. translation of the original items back into English to evaluate the quality of the items translated into Japanese. The Japanese participants were asked. to respond and write down in Japanese to statements such as above. One professional experienced in the field then translate the responses into En‐. glish, and another independently back‐translate the English‐translation of the original responses back into Japanese to compare the validity of English translation of the original responses in Japanese.. Participants’ responses, all in English, were then coded in Canada by two raters independently, and then reconciled to reflect the extent to which the. response reflected the attribute of Ability (A), Benevolence (B), Integrity (I) or something else. This last category was added to the ABI framework, expanding it to include “Other (O) and thus responses were coded accord‐ ing to an “ABIO” framework. These ratings ranged from 0 ” (the attribute is not present in the response) to 5” (the attribute is emphasized in the response). The ratings for 1” (the attribute is slightly present in the re‐ sponse) and 2” (the attribute is somewhat present in the response) were very small, suggesting that there was no meaningful difference between those ratings, and therefore these categories were collapsed, and the final. possible ratings were 0,1,2,3 , and 4. Thus, for each role—trustworthy person, friend, family member, colleague, and supervisor, there was a dis‐ tribution of the relative importance of ability, benevolence, integrity, and other attributes in the response.. A distribution of 0440 (ABIO) reflects the same distribution as 0220 13.
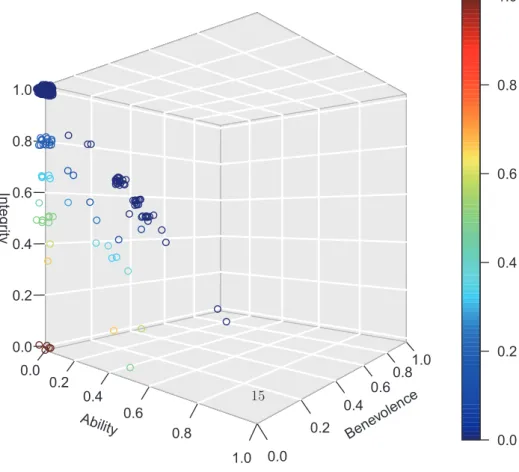
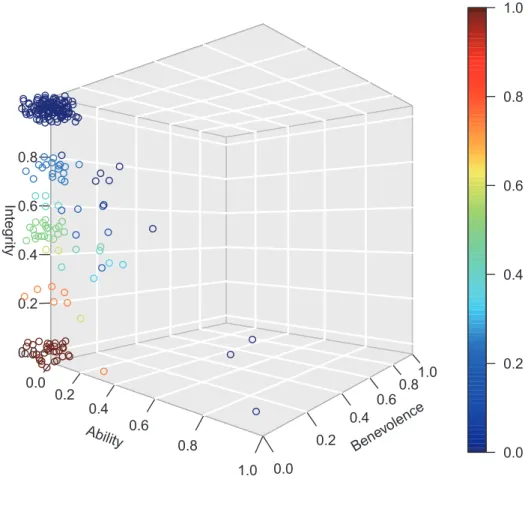
(14) 125 (ABIO) since in both cases A and O are absent.. B. and I are rated as equally important, and. These patterns will be turned into proportionate. responses (or probability) so that the total probability of ABI&O adds up to 1.” An ABIO pattern of 0440 would become (0,0.5,0.5,0) and the ABIO pattern of 0220 would also become (0,0.5,0.5,0) . Similarly, a pattern of 0140 would become (0,0.2,0.8,0) . We present two 3‐dimensional (Ability, Benevolence, Integrity) scatter‐ plots, one for Canadian and the other for Japanese sample with additional. data dimension “Other”represented by a colored vertical bar to the right in Figures 1 and 2.. Since there are overwhelming number of points clustered at the (A, B, I, O). =(0,0,1,0) location and to a lesser degree at the (A, B, I, O)=(0,0,0,1) location in the 3‐dimensional plot, we “jittered”or added a small amount of noise, to all the data to break ties. We immediately notice that both Cana‐. dian and Japanese sample has a many (0,0,1,0) for ABIO pattern. There are 137 Canadian respondents in dark blue clustered around (A, B, I, O). =(0,0,1,0) in Figure 1, while there are almost as many (125) Japanese respondents (in dark blue) with the same response pattern in Figure 2. On the other hand, there are many more Japanese samples with (A, B, I, O) =(0,0,0,1) than Canadian samples: there are 33 Japanese respondents in dark brown clustered around (A, B, I, O)=(0,0,0,1) , while there are only 5 Canadian respondents (in dark brown) with the same response pat‐ tern. This group is potentially troublesome because the ABI framework may not hold for respondents belonging to this subgroup and applicabil‐. ity/universality of the ABI framework is in doubt at least for this subgroup. 3. Methods. Note that for each respondents, we originally record the extent to which. the response reflected the attribute of Ability (A), Benevolence (B), In‐ 14.
(15) 126. Figure 1: Four dimensional “jittered”scatterplot of (Ability, Benevolence, Integrity) for trustworthy person in Canadian sample with “Other”represented by a colored vertical bar to the right.. Other. Trustworthy Person (Canadian Sample). (in probability) .0. 1.0 \bullet. 8. 0.s\Omega 0. \emptyset@t. \overline{\supset}^{0.6-}\circ. \circ 0. \iota_{0.4}^\overlin{\frac{\underlin{\cir(D\neg}{<\cdot}\mathscr{F}(. 6. a. o _{\wp_{\cir }\cir 0. \circ. \circ\circ O\infty\circ 4. 0.2— \circ \circ. 0.0\ovalbox{\t \smal REJECT} 0.0. /. \backslash. \circ. /. 0.2. 0.4. /. \backslash. 15. \backslash. \backslash 0.8 0.6. 1.0. 4bj/ ty^{0.6}0.8^{/}\wedge\backslash_{0.2}9^{o^{\langle\backslash} 0.4e^{ \triangle ft0^{\backslashe^{\langle\backslashC^{\fcircle} } 1.0. 0.0. 2. .0.
(16) 127. Figure 2: Four dimensional ‘jittered”scatterplot of (Ability, Benevolence, Integrity) for Trustworthy Person in Japanese sample with “Other”represented by a colored vertical bar to the right.. Trustworthy Person (Japanese Sample). Other. (in probability) .0. .8. 0.8\circ_{\circ}\circ 0\circ\circ 0^{o_{O}. (\overlin{ud e\frac{supt}\irc(Dneg}.\mathfrk{c} \iota\overline{<}c. ). 6. ©. 0. 0. \circ. \theta_{2ar ow\supset\circ}^{\circ}\circ\circ. \cir \theta\cir ^{\cir \cir }. 4. 0. \circ \backslash\backslash \backslash 1.0 2 0.8. \circ. 0.2. 0.4. \backslash. /. Abj/ity^{0.6}. 0.8^{/}. 0_{\wedge}. 1.0. 16. \backslash_{0.2} 0.0. 0.6. 0.49^{o\lange\backsl h}e^{\triangleft0^{\backsl h O^{\lange\backsl hC^{\fcirle}. .0.
(17) 128 tegrity (I) or something else (O) by ratings of 0,1,2,3 , and 4, then we convert them into four category proportionate responses (or probability) so that the total probability of ABI&O adds up to 1. In other words, our data are quantitative descriptions of the parts of some whole, conveying relative information, or all relevant information in this type of data is con‐ tained in ratios between components. This type of data are thus called “compositional data. Compositional Data. The use of standard statistical methods for the analysis of compositional data that use the usual Euclidean geometry is not coherent. Rather, com‐. positional data follow the so‐called Aitchison geometry on the simplex.. A compositional data point (or composition for short) x=(x_{1}, x_{2}, \ldots, x_{D}) with. D. component can be represented by a positive real vector. The sample. space of compositional data is a. D ‐part. simplex:. S^{D}= \{x=(x_{1}, x_{2}, \ldots, x_{D})\in \mathbb{R}^{D} x_{i}>0, i=1,2, . . , D;\sum_{i=1}^{D}x_{i}=\kappa\}, where. \kappa. is a prescribed sum constraint. In other words, sample space of a. composition consists of the set of all complete rays from the origin, such that the parts are strictly positive.. According to Egozcue (2009) [Egozcue, 2009], compositional data analy‐ sis should respect the following principles: scale invariance The information in a composition does not depend on the particular units in which the composition is expressed;. permutation invariance Permutation of parts of a composition does. not alter the information conveyed by the compositional vector;. 17.
(18) 129 subcompositional coherence Information conveyed by a composition of D. parts should not be in contradiction with that coming from a sub‐. composition containing d parts, d<D.. In Aithison geometry, in order to maintain such desirable properties as scale invariance, permutation invariance, and subcompositional coherence,. the so‐called “Aitchison distance” d_{A}(x, y) between sition. x=(x_{1}, x_{2}, \ldots, x_{D}). and. y=(y_{1}, y_{2}, \ldots, y_{D}). D ‐component. compo‐. is defined as. d_{A}(x,y)=\sqrt{\frac{1}{2D}\sum_{i-1}^{D}\sum_{j=1}^{D}(\ln\frac{x_{i} {x_{j} -\ln\frac{y_{i} {y_{j} )^{2}. ,. (1). which supports the concept of relative scale. If one compares the Aitchison. distance in (1) with the usual Euclidean distance d_{E}(x, y) of. d_{E}(x, y)=\sqrt{\sum_{i- 1}^{D}(x_{i}-y_{i})^{2}. ,. (2). one immediately notices the difficulty of defining the Aitchison distance when at least one of. x_{i}. or. y_{i}. is zero, because \ln(0)=-\infty . This is why. the sample space of a composition consists of the set of all strictly positive complete rays from the origin. Structural or essential zero in compositional data analysis. According to the nature of values, rounded or structural/essential zeros need to be considered.. Rounded zeros occur when either small values of. components are rounded zeros, or a measurement device has incorporated. a detection limit or a threshold value that automatically sets values below. this limit/threshold to zero. Therefore, their replacement by a small pos‐ itive value is reasonable. For rounded zeros, model‐based algorithms have been developed and are available in such statistical package as 18. R..
(19) 130 However, structural or essential zero are result of a structural process,. and thus imputing them does not make sense. Aitchison and Kay (2003) [Aitchison and Kay, 2003] points out: By an essential zero we mean a component which is truly zero,. not something recorded as zero simply because the experimental design or the measuring instrument has not been sufficiently sen‐. sitive to detect a trace of the part. Such essential zeros occur in many compositional situations.. In household budget patterns,. where some households may spend nothing on such commodity. groups as tobacco, alcohol, entertainment, over the period of ob‐ servation.. Structural or essential zeros cannot be analyzed directly within the well‐ established logratio methodology for compositional data. One approach. discussed in Aitchison and Kay (2003) [Aitchison and Kay, 2003] is “to interpret structural or essential zeros in a certain part as indicators of two different subgroups: one group containing observations with a value. of zero in a certain part as indicators of two different subgroups. This. implicitly assumes that the observations originate from two populations, with and without zero in the specific component, with possibly different. distributions of the non‐zero parts (Filzmoser, Hron and Templ, 2018, p.266)” [Filzmoser et al., 2018]. If this is indeed the case, both groups of observations can be analyzed separately. Such an approach makes sense only when there are a very simply zero structures, however. When the zero structure is more complex, one would have to split the data set into. many number of subgroups for all possible patterns of zeros in the data. Consequently, there will be insufficient sample size for analyzing any one. of such a subgroup. From Figures 1 and 2, it is obvious that we are facing situation of structural or essential zeros with our Canadian and Japanese samples. 19.
(20) 131 131 The Dirichlet distribution. Before the logratio methodology was introduced, a standard approach for modeling compositional data was based on the Dirichlet distribution. The Dirichlet distribution is a probability distribution as well—but it is. not sampling from the space of real numbers. Instead it is sampling over a probability simplex. A probability simplex is a bunch of numbers that add. up to 1. For example: (0.65, 0.35), (0.05, 0.25, 0.7), (0.05, 0.2, 0.1, 0.15, 0.35, 0.15). These numbers represent probabilities over D distinct cate‐ gories. In the examples above,. D. is 2, 3, and 6 respectively. When we are. dealing with categorical distributions and we have some uncertainty over what that distribution is, the simplest way to represent that uncertainty as a probability distribution is the Dirichlet.. A. D ‐dimensional. Dirichlet distribution has. D. parameters. These param‐. eters can be any positive number. For example, a 4‐dimensional Dirichlet. may look like this: (0.23, 0.06, 0.32, 0.39). The probabilities just happen to be the mean value of the Dirichlet. So, all samples from it will center around that simplex.. The Dirichlet distribution of order D\geq 2 with positive parameters \alpha_{1} ,. . . . , \alpha_{K}>0 for x=(x_{1}, x_{2}, \ldots, x_{D})\in S^{D} has a probability density. function with respect to Lebesgue measure on the Euclidean space \Re^{D-1} given by. f(x_{1}, \ldots, x_{K};\alpha_{1}, \ldots, \alpha_{D})=\frac{1}{B(\alpha)} \prod_{i=1}^{D}x_{i}^{\alpha_{i}-1}. where. \{x_{k}\}_{k=1}^{k=D}. \sum_{i=1}^{D}x_{i}=1. belong to the standard. D-1. simplex, or in other words:. and x_{i}\geq 0 for all i\in[1, D] . The normalizing constant is the. multivariate beta function, which can be expressed in terms of the gamma function:. B(\alpha)=\frac{\prod_{i=1}^{D}\Gam a(\alpha_{i}){\Gam a(\sum_{i=1}^{D} \alpha_{i}),\alpha=(\alpha_{1},\ldots,\alpha_{D}) 20. ..
(21) 132 The Dirichlet distribution has many advantages: its marginal distribu‐ tions are again Dirichlet distributions; widely applied in Bayesian statistics as prior and posterior; it allows structural or essential zeros in the com‐ position. However, the approach based on the Dirichlet distribution is not. scale invariant. It is also known that this shortcoming cannot be overcome. even by redefining it with respect to the Aitchison geometry. Mixture models. In a mixture model, each observed data point is assumed to belong to a. cluster. Mixture models are used for understanding the group structure of a data set and for flexibly estimating the distribution of a population. The traditional mixture modeling approach to clustering requires the number. of clusters to be specified in advance of analyzing the data. Most statisti‐ cians address them by first fitting several models, with different numbers of. clusters or factors, and then selecting one using model comparison metrics. ([Claeskens and Hjort, 2008]). K ‐means clustering is the most commonly used clustering (or unsupervised machine learning) algorithm for parti‐ tioning a given data set into a set of k groups (i.e. k clusters), where k represents the number of groups pre‐specified by the analyst. It classifies. objects in multiple groups (i.e., clusters), such that objects within the same cluster are as similar as possible (i.e., high intra‐class similarity), whereas objects from different clusters are as dissimilar as possible (i.e., low inter‐ class similarity). The most common method to determine the number of clusters is to use Elbow Method that plots within‐sum‐of‐squares in y ‐axis. against the number of clusters in. x. ‐axis and find the optimal number of. clusters as it appears to be the bend in the knee (or elbow) as seen in Figure 3. We present the result of the optimal 7 clusters by. K ‐means. in. Figure 4. Conditional on the seven clusters from the Elbow Method cho‐ sen by. K‐means. algorithm, Canadian and Japanese respondents form the 21.
(22) 133. Figure 3: Elbow Method: The plot of within‐sum‐of‐squares against the number of clusters for trustworthy person in Canadian and Japanese samples combined Optimal number of clusters. \frac{omeg}- \siaupetvr. \frac{geq}vdsh^ipLntyub-E. 22.
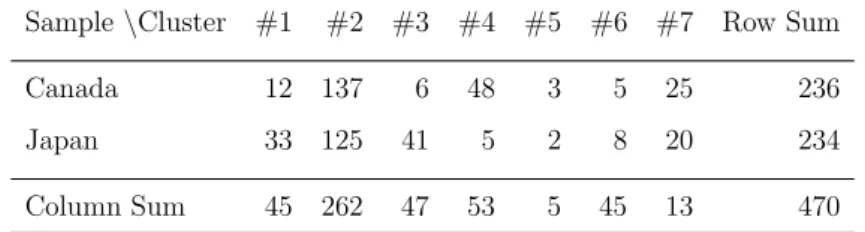
(23) 134 Table. 1: How many Canadian and Japanese subjects fall in the 7 clusters given by. K ‐means. Sample \backsla h Cluster. \# 1. \# 2. \# 3. \# 4. \# 5. \# 6. \# 7. Row Sum. Canada. 12. 137. 6. 48. 3. 5. 25. 236. Japan. 33. 125. 41. 5. 2. 8. 20. 234. Column Sum. 45. 262. 47. 53. 5. 45. 13. 470. following multinomial samples within each cluster as seen Table 1. Conditional on the seven clusters given by. K ‐means. algorithm, we re‐. ject the hypothesis that the two multinomial samples, one consisting of respondents from Canada and the other comprising of respondents from. Japan, come from the same distribution because: df. =6 ,. p ‐value. X ‐squared. =72.741,. =1.119e-13.. Bayesian nonparametric clustering. One potential disadvantage of. K ‐means. clustering is that it requires us to. pre‐specify the number of clusters. Bayesian nonparametric (BNP) models provide a different approach to this problem ([Hjort et al., 2010]). Rather than comparing models that vary in complexity, the BNP approach is to fit a single model that can adapt its complexity to the data. In other words,. BNP models allow the complexity (the number of clusters in our case) to grow as more data are observed.. For example, consider the problem of clustering data. The Bayesian non‐ parametric approach estimates how many clusters are needed to model the. observed data and allows future data to exhibit previously unseen clusters. A finite mixture model assumes that there are with a parameter \theta_{k} . Each observation first choosing a cluster. c_{n}. y_{n}. K. clusters, each associated. is assumed to be generated by. according to Pr\{c_{n}\} and then generating the 23.
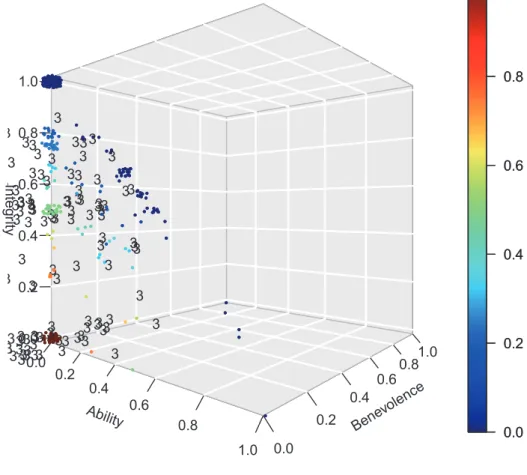
(24) 135 Figure 4: Four dimensional “jittered”scatterplots of (Ability, Benevolence, Integrity) for trustworthy person in Canadian and Japanese samples combined with “Other”represented by a colored vertical bar to the right according to the 7 clusters by TrusMo\mathbb{R}hy Person (. canad\mathfrak{i}anaJapaneseSamplej_{pobability)}^{\alpha h\cdot r}. Trustworhy. K ‐means.. Pe\kappa on(Canadian\ JapaneseSamp1\sqrt[e]\circ th\mathfrak{e}fr. \ovalbx{tsmREJCT}_\#-overlin{supt^06}\a_o1{ u08}\tildecr^{1 ovalbx\tsmREJCT}_{1 cdot\bakslh02{_'/}^t.r06Ab,{y41\wedg} 0naroci2_{9^e\bakslh}{c0^\bakslh} c086|_{\grave1}olbxtsmREJCT}_{0^2468 /\trianglefbps^{06/}4r_81\backslh04^{ 8} \wedg02^{backslh6}9o\ascirbklh0^{Q\cir} pmebakslh|_{\grv1}0obxtsmalREJCT}_{0^82461 \overlin{<facsupt}^Ph\orneim3{q_vat}^04 -6812{@_3t}\ovalbxsmREJCT,:_{Ay} \priedlta^3?04s_{}vh6/^g3 \primebwd_{f}.cot08^/\genarw2_{9vth^o \bcksla}04{h^ 8}\cirbaksl 0{^O h6|_\grave1}0olbx{tsmREJCT 24068\overlin{facsupt}^Phore\im{<0_ }24681ovalbx\tsmREJCT}^{wedgrhaovlbx\tsm REJCT}cdprie^{_024/j\tanglfph^{}*_ rietb068^{/},\psanglf.#:uAw_4ed \bcksah{029^ovrtels}{04\backh ^vrteO9}{sla06\bckh 8^{1} ir|_\backslhovxtmREJCT}024681 \overlin{<facsupt}^Ph\roneim 108642valbox{\tsmREJCT}_0/'prie.cdot\l{ka5} 0^/bcslh\ak084^{ }cdot\. prime_{/}b^06c,ty8\wdgmpse^{backlh}: _10\sbacklh}52^{ 064,\ircse} ovalbx{tmREJCT_0}^8246\overlin{facsupt} ^\Phroneim{<0248^6}1\cdot.nwar 08i_{2'6}^*\psnegbacklhxit_{8}\do.prme: wg|_{av1}0Abx\psi8wedg9^{crbaklsh \i cr^{o}06\bakslh4cdot'_{}^6 \prime.02backslh}1^{ \ovbxtsmalREJCT}_{0^8 246 \overlin{fac^O}suptq\vrhea{8106^pim.}\#7r_ {lA6/ty^0pi4}7{\gam_suvrthe}04{2 /\ng^:i7.8rwedbackslh_{02\vt^onriaglef 0{\bcksh^opi}4{\backslh }08^nwaro 6|_{\gve1}0lbxtsmaREJCT024681 Other. Othef. Trustworthy Person (Canadlan 8 Japanese s_{am}P^{le}A. probabi ity ). Trustworthy Person (CanadIan & Japanese Sample\sqrt{}\cdot pobab\varepsilon lM. 10 00. TrustwoKhyPerson. 10 00. (canadian8JapanesesampleA_{\mathfrak{n}prob}^{\alpha h}:_{br1\dot{r}ty)}^{7}i. TrustworhyPers\circ n(canadjan\ Japanesesamp1\sqrt[e]oth\cdot r_{1}m. Other. Trustworthy Person (Canadian & Japanese Samplf1_{\Pi}pobab-1‐ \phi ). 0 02]. 2^{14}00.
(25) 136 observation from its corresponding observation distribution Pr\{y_{n}|\theta_{c_{n}}\} pa‐ rameterized by \theta_{c_{n} .. Finite mixtures can accommodate many kinds of data by changing the data generating distribution. In this study, the data—conditional on know‐. ing their cluster assignments—are assumed to be drawn from the Dirichlet distributions. Bayesian mixture models further contain a prior over the mixing distribution Pr(c) , and a prior over the cluster parameters: \theta\sim G_{0}.. A convenient choice for the distribution on the mixing distribution Pr(c) in our case is also a Dirichlet.. BNP clustering addresses this problem by assuming that there is an in‐ finite number of latent clusters, but that a finite number of them is used. to generate the observed data. The BNP approach finesses the problem of choosing the number of clusters by assuming that it is infinite, while spec‐. ifying the prior over infinite groupings Pr\{c\} in such a way that it favors assigning data to a small number of groups. BNP clustering with Chinese Restaurant process. Our BNP clustering model uses the Chinese restaurant process (CRP) in an infinite‐capacity mixture model. Each table. k. is associated with a. cluster and with a cluster parameter \theta_{k} , drawn from a prior G_{0} . Each data point is a “customer,” who sits at a table T_{n} and then draws its observed value from the distribution. Pr(x_{n}|\theta_{T_{n}}) .. The concentration parameter \alpha^{1} controls the prior expected number of. clusters (i.e., occupied tables). K+ .. In particular, this number grows loga‐. rithmically with the number of customers. E[K+]=\alpha\log N. for. N:. \alpha<N/\log N. When we analyze data with a CRP, we form an approximation of the joint posterior over all latent variables and parameters. We use this posterior to 1If\alpha is treated as unknown, one can put a hyperprior over it 25.
(26) 137 Table 2: How many Canadian and Japanese subjects fall in the 7 clusters given by CRP mixture BNP clustering with with \alpha=0.3. Sample\backslash Cluster. \# 1. \# 2. \# 3. \# 4. \# 5. \# 6. \# 7. Row Sum. Canada. 152. 25. 43. 8. 6. 1. 1. 236. Japan. 131. 83. 8. 4. 5. 3. 0. 234. Column Sum. 283. 108. 51. 12. 11. 4. 1. 470. examine the likely partitioning of the data: This gives us a sense of how data are grouped, and how many groups the CRP model chose to use. Conditional on the seven clusters given by Chinese Restaurant process mixture BNP clustering with. \alpha=0.3 ,. respondents from Canada and Japan. form the following multinomial samples as seen in Table 2: Conditional on the seven clusters given by Dirichlet process Mixture BNP, we reject. the hypothesis that the two multinomial samples, one respondents from Canada and the other from Japan, come from the same distribution be‐ cause:X‐squared. =60.143. , df. =6. ,. p ‐value. =4.21e-11 .. However, we. are concerned about 108 respondents belonging to cluster #2 in Figure 5 because, as it turns out, this cluster contains 5 Canadian and 33 Japanese respondents with (A, B, I, O)=(0,0,0,1) and it seems this cluster is too broad.. 4. Conclusion and Discussion. Employing two clustering methods—K‐means and BNP with CP—we learned that Canadian and Japanese samples do seem to differ signifi‐. cantly, even though a majority in both samples have—137 Canadian out. of 236 (\approx 58.1% ) and 125 Japanese out of 234 (\approx 53.4% ) samples re‐ sponded with clear and overwhelming importance of integrity shown in Figures 1 and 2. It should be noted that BNP with CP clustering tends 26.
(27) 138. Figure 5: Four dimensional “jittered”scatterplot of (Ability, Benevolence, Integrity) for trustworthy person in Canadian and Japanese samples combined with “Other”represented by a colored vertical bar to the right according to the #2 of 7 clusters by CRP mixture BNP clustering with with \alpha=0.3. Other. Trustworthy Person (Canadian & Japanese Sample_{(}\}_{n} probability) .0. 1. 0e. 8. 3. )b_{3*}^{8*}\cdot 333.. (\cir ovalbx{\tsmalREJCT}.q:\int^{ae}-3\underli {*}\yen^{i3.}g_ {3}.h_0^{3. _:^{*} 3.\cdot .\cdot . K0.4-. \}0.2-3\S. 3. .4. :_{3}. 3. 3_{1}\mathfrak{B} 0.2. 6. §:. $. ‐. 0.4. 3. 3 ^{\cdot} \backslash \backslash 1.0 2 \backslash 0.8 \backslash. /. Abj/jty^{0.6}. 0.8^{/}. 1.0. 27. \backslash_{0.2}. \wedge 0.0. 0.6. 0.49^{e\lange\backsl h}0^{\triangleft0\backsl hO^{\lange\backsl h O^{\fcirle}. .0.
(28) 139 to produce many small clusters regardless of whether they are needed to accurately characterize the data. Interpretability, parsimony, data storage and communication costs all are hampered by having overly many clusters,. however. See, for instance, Lu et al. (2018) ( [Lu et al., 2018]). If one is asked if the proportion of Japanese respondents who think. integrity is the only characteristic that matters for trustworthiness dif‐. ferent from the corresponding proportion of Canadian respondents, we. have. (0.534-0.581)/\sqrt{0581(1-0581)}/236\approx −0.04632/0.03212, which is. about 1.44 via the normal approximation of the binomial distribution. The answer is clearly no and we cannot reject the hypothesis that “about the. same proportion of individuals in Canadian as well as Japanese culture will hold the integrity to be the dominant components in the ABI framework. Since we are ready to accept that individuals will vary in the extent to which they are good cultural representatives and consider trustworthiness. in the mandated way within a given culture, however, we need to find out where the differences come from between these two samples.. For many applications involving compositional data, it is necessary to. establish a valid measure of distance, yet when essential zeros are present traditional distance measures for compositional data are problematic. Re‐. cently Stewart (2017) ([Stewart, eros]) compared measures of distance for compositional data capable of handling zeros, but not satisfying some of the well‐accepted principles of compositional data analysis. She found that. the chi‐square (CS) measure of distance between x=(x_{1}, x_{2}, \ldots, x_{D}) and y=(y_{1}, y_{2}, \ldots, y_{D}) with D component as CS. ( x, y)=\sqrt{2D}(\sum_{i=1}^{D}r_{i})^{1/2} 28.
(29) 140 where. r_{i}=\ begin{ar y}{l 0ifx_{}=yi 0, \frac{(\frac{x_i}\Sgma_{k-1}^Dx_{k}-\frac{y_i}\Sgma_{k-1}^Dy_{k} )^{2}\frac{x_i}\Sgma_{k=1}^Dx_{k}-\frac{y_i}\Sgma_{k=1}^Dy_{k} otherwis. \end{ar y}. allows for essential zeros, and scale and permutation invariant, though not subcompositionally dominant, but the last property may be ap‐. proximately satisfied through simulation studies. We may wish to inves‐. tigate the possibility of employing this distance measure for comparing responses from Canadian and Japanese respondents for future research.. 29.
(30) 141 141 References. [Aitchison and Kay, 2003] Aitchison, J. and Kay, J. (2003). Possible so‐ lution of some essential zero problems in compositional data. In Thió‐. Henestrosa, S. and Martín‐Fernández, editors, Proceedings of the Co‐. DaWork. \zeta 03,. The 1st Compositional Data Analysis Workshop, pages. CD‐ROM. University of Girona, Girona.. [Axelrod, 1984] Axelrod, R. (1984). The Evolution of Cooperation. Basic Books, New York.. [Bond and Smith, 2018] Bond, M. H. and Smith, P. B. (2018). Discovering culture’s influence in studies of individual behavior in organizational. settings: A challenging proposal. International Studies of Management g. organization, 48(4):419-434.. [Claeskens and Hjort, 2008] Claeskens, G. and Hjort, N. (2008).. Model. selection and model averaging. Cambridge University Press.. [Cook et al., 2005] Cook, K. S., Yamagishi, T., Cheshire, C., Cooper, R., Matsuda, M., and Mashima, R. (2005). Trust building via risk taking: A cross‐societal experiment. Social Psychology Quarterly, 68(2):121-142. [Doney et al., 1998] Doney, P., Cannon, J., and Mullen, M. (1998). Under‐ standing the influence of national culture on the development of trust.. The Academy of Management Review, 23(3):601-620.. [Egozcue, 2009] Egozcue, J. J. (2009). Reply to “on the harker variation diagrams. by j.a. cortés. Mathematical Geosciences, 41:829834.. [Filzmoser et al., 2018] Filzmoser, P., Hron, K., and Templ, M. (2018). Applied Compositional Data Analysis With Worked Examples in Springer.. 30. R..
(31) 142 [Foddy et al., 2009] Foddy, M., Platow, M., and Yamagishi, T. (2009). Group‐based trust in strangers: The roles of stereotypes and expecta‐ tions. Psychological Science, 20(4):419-422.. [Hardin, 2002] Hardin, R. (2002). Trust and Trustworthiness. Russell Sage Foundation, New York, NY.. [Hayashi et al., 1999] Hayashi, N., Ostrom, E., Walker, J., and Yamagishi, T. (1999). Reciprocity, trust, and the sense of control: A cross‐societal study. Rationality and Society, 11(1) :27-46.. [Hjort et al., 2010] Hjort, N., Holmes, C., M'uller, P., and Walker, S. G. (2010). Bayesian nonparametrics: principles and practice. Cambridge University Press.. [Kakiuchi and Yamagishi, 1997] Kakiuchi, R. and Yamagishi, T. (1997). General trust and the dilemma of variable interdependency. Japanese. Journal of Social Psychology, 12(3):212-221 . (in Japanese). [Kikuchi et al., 1997] Kikuchi, M., Watanabe, Y., and Yamagishi, T. (1997). Judgment accuracy of other’s trustworthiness and general trust: an experimental study. Japanese Journal of Experimental Social Psy‐. chology, 37(1):23-36 . (in Japanese). [Kiyonari et al., 2007] Kiyonari, T., Foddy, M., and Yamagishi, T. (2007). Effects of direct and indirect exchange on trust of in‐group members.. The Japanese Journal of Psychology, 77(6):519-527 (in Japanese). [Kiyonari et al., 2006] Kiyonari, T., Yamagishi, T., Cook, K. S., and Cheshire, C. (2006). Does trust beget trustworthiness? trust and trust‐ worthiness in two games and two cultures: A research note. Social Psy‐ chology Quarterly, 69(3):270-283.. 31.
(32) 143 [Kosugi and Yamagishi, 1998] Kosugi, Y. and Yamagishi, T. (1998). Gen‐ eral trust and judgments of trustworthiness. The Japanese Journal of. Psychology, 69(5):349-357. (In Japanese). [Kuwabara et al., 2007] Kuwabara, K., Willer, R., Macy, M., Mashima, R., Terai, S., and Yamagishi, T. (2007). Culture, identity, and structure in social exchange: A web‐based trust experiment in the u.s. and japan. Social Psychology Quarterly, 70(4):461-479.. [Li, 2007] Li, P. P. (2007). Towards an interdisciplinary conceptualization of trust: A typological approach. Management and organization Review,. 3 (3). :421-455.. [Li, 2012] Li, P. P. (2012). When trust matters the most: The imperatives for contextualising trust research. Journal of Trust Research, 2(2):101106.. [Liu et al., 2011] Liu, J., Yamagishi, T., Wang, F., Schug, J., Lin, Y., Yu, S., Takahashi, C., and Hang, L. (2011). Unbalanced triangle in the social dilemma of trust: Internet studies of real‐time, real money social. exchange between china, japan, and taiwan. Asian Journal of Social Psychology, 14(4):246-257.. [Lu et al., 2018] Lu, J., Li, M., and Dunson, D. (2018). over‐clustering via the powered chinese restaurant process.. Reducing arXiv:,. 1802. 05392v1:1-9.. [Markus and Kitayama, 1991] Markus, H. and Kitayama, S. (1991). Cul‐ ture and the self: Implications for cognition, emotion, and motivation. Psychological Review, 98(2):224-253.. [Mashima et al., 2004a] Mashima, R., Yamagishi, T., and Macy, M. (2004a). Trust and cooperation: A comparison of ingroup preference 32.
(33) 144 and trust behavior between american and japanese students. Japanese. Journal of Psychology, 75(4):308-315 . (in Japanese).. [Mashima et al., 2004b ] Mashima, R., Yamagishi, T., and Matsuda, M. (2004b). Trust as a signal in relations with temporary partners. Japanese Journal of Social Psychology, 19(3):175-183 . (in Japanese). [Matsuda and Yamagishi, 2001] Matsuda, M. and Yamagishi, T. (2001). Trust and cooperation: An experimental study of pd with choice of. dependence. Japanese).. The Japanese Journal of Psychology, 72(5):413-421 . (In. [Matsumoto, 2007] Matsumoto, D. (2007). Culture, context, and behavior. Journal of Personality, 75(6):1285-1320. [Mayer et al., 1995] Mayer, R. C., Davis, J. H., and Schoorman, F. D. (1995). An integrative model of organizational trust. The Academy of Management Review, 20(3) :709-734.. [Platow et al., 2012] Platow, M. J., Foddy, M., Yamagishi, T., Lim, L., and Chow, A. (2012). Two experimental tests of trust in in‐group strangers: The moderating role of common knowledge of group membership. Eu‐ ropean Journal of Social Psychology, 42(1):30-35.. [Romano et al., 2017] Romano, A., Balliet, D., Yamagishi, T., and Liu, J. (2017). Parochial trust and cooperation across 17 societies. Proceedings of the National Academy of Sciences of the United States of America,. 114(48):12702-12707.. [Rotter, 1980] Rotter, J. (1980). Interpersonal trust, trustworthiness, and gullibility. American Psychologist, 35: 1‐7.. [Rotter, 1967] Rotter, J. B. (1967). A new scale for the measurement of interpersonal trust. Journal of Personality, 35(4):651-665. 33.
(34) 145 [Sato and Yamagishi, 1986] Sato, K. and Yamagishi, T. (1986). Two psy‐ chological factors in the problem of public goods.. THE JAPANESE. JOURNAL OF EXPERIMENTAL SOCIAL PSYCHOLOGY, 26(1):8995 .. (in Japanese).. [Saunders et al., 2014] Saunders, M. N. K., Dietz, G., and Thornhill, A. (2014). Trust and distrust: Polar opposites, or independent but co‐ existing? Human Relations, 67(6):639-665. [Stewart, eros] Stewart, C. (An approach to measure distance between compositional diet estimates containing essential zeros). 2017. Jour‐ nal of Applied Statistics, 44(7):1137-1152. [Suzuki et al., 2007] Suzuki, N., Konno, Y., and Yamagishi, T. (2007). In‐ group bias in trusting behavior: A choice of allocator experiment with. minimal groups. The Japanese Journal of Psychology, 78(1):17-24 . (in Japanese). [Takahashi et al., 2008] Takahashi, C., Yamagishi, T., Liu, J. H., Wang, F., Lin, Y., and Yu, S. (2008). The intercultural trust paradigm: Study‐ ing joint cultural interaction and social exchange in real time over the internet. International Journal of Intercultural Relations, 32:215−228.. [Terai et al., 2003] Terai, S., Morita, Y., and Yamagishi, T. (2003). Trust and assurance of cooperation in ongoing relations: An experimental study using the prisoner’s dilemma with variable dependence. Japanese. Journal of Social Psychology, 18(3):172-179 . (In Japanese).. [Van Lange and Visser, 1999] Van Lange, P. A. M. and Visser, K. (1999). Locomotion in social dilemma: How people adapt to cooperative, tit‐. for‐tat, and noncooperative partners. Journal of Personality and Social Psychology, 77:762773.. 34.
(35) 146 [van’t Wout and Sanfey, 2008] van’t Wout, M. and Sanfey, A. (2008). Friend or foe: the effect of implicit trustworthiness judgments in social. decision‐making. Cognition, 108(3):796-803.. [Whitener et al., 2000] Whitener, E. M., Maznevski, M. L., Hua, W., Saebo, S. R., and Ekelund, B. Z. (2000). Testing the cultural boundaries of a model of trust: Subordinate‐manager relationships in china, norway. and the united states. http://escholarship.org/uc/item/8th9x1fn. UCLA Asia Institute.. [Yamagishi, 2011] Yamagishi, T. (2011). Trust: The Evolutionary Game of Mind and Society. Springer The science of mind, Springer Japan.. [Yamagishi et al., 2015] Yamagishi, T., Akutsu, S., Cho, K., Inoue, Y., Li, Y., and Matsumoto, Y. (2015). Two‐component model of general trust: Predicting behavioral trust from attitudinal trust. Social Cogni‐ tion, 33(5):436-458.. [Yamagishi et al., 1998] Yamagishi, T., Cook, K. S., and Watabe, M. (1998). Uncertainty, trust and commitment formation in the united states and japan. American Journal of Sociology, 104(1):165-194.. [Yamagishi et al., 2005] Yamagishi, T., Kanazawa, S., Mashima, R., and Terai, S. (2005). Separating trust from cooperation in a dynamic rela‐ tionship: Prisoner’s dilemma with variable dependence. Rationality and. Society, 17(3):275-308.. [Yamagishi et al., 1999] Yamagishi, T., Kikuchi, M., and Kosugi, M. (1999). Trust, gullibility and social intelligence. Asian Journal of Social Psychology, 2:145−161.. [Yamagishi and Komiyama, 1995] Yamagishi, T. and Komiyama, H. (1995). Significance and the structure of trust: Theoretical and empiri‐ 35.
(36) 147 cal research on trust and commitment relations. INSS Journal, 2:1−59.. (in Japanese).. [Yamagishi and Sato, 1986] Yamagishi, T. and Sato, K. (1986). Motiva‐ tional bases of the public goods problem. Journal of Personality and. Social Psychology, 50(1). :67-73.. [Yamagishi and Yamagishi, 1994] Yamagishi, T. and Yamagishi, M. (1994). Trust and commitment in the united states and japan. Mo‐ tivation and Emotion, 18(2):129-166. [Yamagishi et al., 1995] Yamagishi, T., Yamagishi, M., Takahashi, N., Hayashi, N., and Watabe, M. (1995). Trust and commitment forma‐ tion. Japanese Journal of Experimental Social Psychology, 35(1):23-34. (in Japanese). [Yuki et al., 2005] Yuki, M., Maddux, W. W., Brewer, M. B., and Take‐ mura, K. (2005). Cross‐cultural differences in relationship‐ and group‐ based trust. Personality and Social Psychology Bulletin, 31:4862.. E‐mail address: [email protected]. 36.
(37)
図

+4


関連したドキュメント
Standard domino tableaux have already been considered by many authors [33], [6], [34], [8], [1], but, to the best of our knowledge, the expression of the
The edges terminating in a correspond to the generators, i.e., the south-west cor- ners of the respective Ferrers diagram, whereas the edges originating in a correspond to the
In this work we apply the theory of disconjugate or non-oscillatory three- , four-, and n-term linear recurrence relations on the real line to equivalent problems in number
H ernández , Positive and free boundary solutions to singular nonlinear elliptic problems with absorption; An overview and open problems, in: Proceedings of the Variational
If condition (2) holds then no line intersects all the segments AB, BC, DE, EA (if such line exists then it also intersects the segment CD by condition (2) which is impossible due
Keywords: Convex order ; Fréchet distribution ; Median ; Mittag-Leffler distribution ; Mittag- Leffler function ; Stable distribution ; Stochastic order.. AMS MSC 2010: Primary 60E05
In Section 3, we show that the clique- width is unbounded in any superfactorial class of graphs, and in Section 4, we prove that the clique-width is bounded in any hereditary
Inside this class, we identify a new subclass of Liouvillian integrable systems, under suitable conditions such Liouvillian integrable systems can have at most one limit cycle, and
