Introduction
The author of this paper has primarily studied the family structure of rural families in the early 20th century, using the data available from the 1901 and 1911 census returns. Briefly summarizing previous research findings, among rural families in Ireland, the nuclear family was the dominant form of family until the mid-19th century. However, the author s theory is that after the mid-19th century, stem families were formed due to the combination of two factors-marriages associated with a dowry and the change in the inheritance system from partible inheritance to impartible-division of succession. By the early 20th century, stem families, facilitated by situational factors favoring their formation, had become a major principle of family formation in Ireland [Y. Shimizu, 2011, 2012, 2013, 2014a, 2014b]. In this paper, the focus of study is shifted from rural families to urban families residing in the city of Dublin, the Irish capital. The
Family Structure in the City
of Dublin in Early 20th Century
キーワード:Dublin, Irish family,Hajnal s theory,
Rate of marriage, fertility and mortality, Simple family household,Family strategy
SHIMIZU Yoshifumi
1purpose of this paper is to identify the features of family structure in the city of Dublin in the early 20th century, based on a comparison with rural families.
1. Theory regarding the family structure in Dublin
The number of previous studies in Dublin history is relatively limited. Early studies include A. J. Humphreys s research into urbanization and families in Dublin [A.J. Humphreys, 1966], J.V. O Brien s research into the history of Dublin as an impoverished city [O Brien, J.V., 1982], and Mary Daly s research on Dublin from a perspective of socio-economic history [Mary Daly, 1984]. More recent studies regarding Dublin include primarily the collection of academic papers edited by F. H. A. Aalen and K. Whelan [F.H.A. Aalen & K. Whelan (eds.), 1992] that deals with research into the city of Dublin. This collection particularly contains L. Cullen s paper discussing the post-medieval history of the city of Dublin [L. Cullen, 1992], J. Prunty s research into the slums of Dublin [J. Prunty, 1998], R. McManus s research into the development history of the city of Dublin and its suburbs in the 20th century [R. McManus, 2002], Seamas O Maitiu s research into urban areas in the Dublin suburbs [Seamas O Maitiu, 2003] and Mel Cousins s research on the relief of the poor in Ireland [Mel Cousin, 2011]. However, almost no previous studies dealt with the history of families in Dublin based on the data available from individual census returns.1)
In this paper, the author s theory regarding analysis of the population
1)Recently, an interesting analysis of urban research was conducted in a seminar class in the graduate school of geological sciences of University College Dublin, using the data available from individual results of the 1911 census returns of Dublin (UCD GPEP Dublin 1911 Census Project, Second City Dublin 1911, 2010 2011). However, this does not address family analysis.
and the family structures in the city of Dublin is set out. Concerning the population structure, the city of Dublin was weak in terms of incentives to attract laborers. Even during the Great Famine that began in 1845, rural residents chose to emigrate to Britain or the U.S, rather than to seek work in Dublin. Thereafter, the trend of emigration to the U.S. continued, the large numbers of emigrants being accounted for by economic prosperity in the U.S. In the early 20th century, while Dublin was recognized as the second largest city after London in the United Kingdom, it was a less industrialized, less urbanized consumer city, unattractive from a labor market viewpoint, with a noticeably sluggish growth in population. The majority of the employees in Dublin were unskilled workers. Meanwhile, in contrast to rural areas, the city showed a demographic structure characterized by high marriage rates, high fertility rates and high mortality rates. Population growth in Dublin was substantially maintained by natural increase. Population inflow to the city was accounted for by migrants from a limited range of geographical areas, mainly adjacent counties within the province of Leinster.
With such a population structure as a background, what principle of family formation did families in the city of Dublin employ as their family strategy? To analyze the urban family structure in the city of Dublin, an effective framework comes from Hajnal s theory of a nuclear family system in northwest Europe, where simple family households were dominant [John, Hajnal, 1982, 452]. John Hajnal pointed out two types of household patterns, the northwest European household formation one and the joint household one.
The household patterns in northwestern Europe can be characterized by three rules of normal household formation behavior. For the simple
Family Structure in the City
household system in northwestern Europe the common rules were:
A Late marriage for both sexes (averages ages at first marriage of, say, over 26 for men and 23 for women).
B After marriage the couple had an independent household (the husband as head of household).
C Before marriage young people often circulate between households as servants.
He added two important explanations to his northwest European model. Firstly under rule A, the fact that a married couple had charge of their own household, implied that upon marriage, (a) a new household was created, or (b) one spouse joined the other in a household in which there had been no married couple, or (c) finally if they took over a farm run by the parents or a parent of them, the parent or parent retired when the young people married. The practice of retirement by contract was common in most of northwest Europe. Secondly under rule C he emphasized the circulation of servants in the northwest European system. Servants, he argued, were found in substantial numbers concentrated at young adult ages throughout preindustrial northwestern Europe. The circulation of servants, providing occupation for young unmarried adults, is likely to have accounted for the late age of marriage, [John Hajnal, 1982, 4523]
For families in Dublin, the simple family household proved more effective as a family strategy, than a more complex form based on the stem family. Meanwhile, families in the city of Dublin also included a considerable number of kin migrating from rural areas. For these migratory families to lead a happy life in an urban area, adaptation to the norms of urban family was more effective than maintaining the norms of rural family. In other words, while a simple family household may have
been based on the nuclear family system. The normative ethos of the rural family2)
continued to be found in some aspects of family structure in the city of Dublin. While adopting the structure of an urban family, families in the city had the potential to form a stem family, depending on family situations. To be specific, family norms, such as patriliny (gender roles of patriarchs and their spouses) and filial piety, which were characteristic of rural families, also constituted the norms of fathers, mothers and children in urban families [A.J. Humphreys, 1966, 235].
Against the background of the population structure in the city of Dublin, rural families in the city in the early 20th century were formed on the basis of the nuclear family system, with a dominant strategy of simple family household form. At the same time, however the normative ethos of rural families; ensured that where situational factors favorable to the formation of stem families existed, then a stem family tended to emerge. This is a theory the author suggests regarding the family structure in the city of Dublin.
The individual data of the 1911 census returns used in this research concern 275,264 residents in 60,346 households in the city of Dublin, and 162,262 residents in 35,835 households in County Dublin (the area excluding the city of Dublin).
2)The term ethos used here includes three aspects: the attitude in life, mental attitude and ethical attitude. In particular, importance is attached to the values characteristic of stem families as internal norms of individual persons.
Family Structure in the City
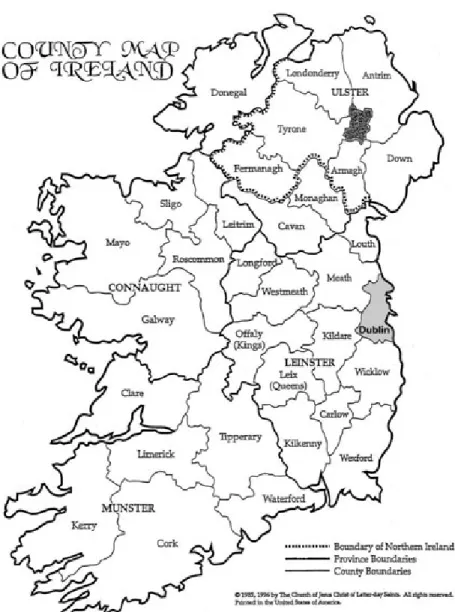
Figure 1.Map of Ireland
Source: Family Search, County Dublin Ireland, jpg in The Church of Jesus Christ of Latter-day Saints
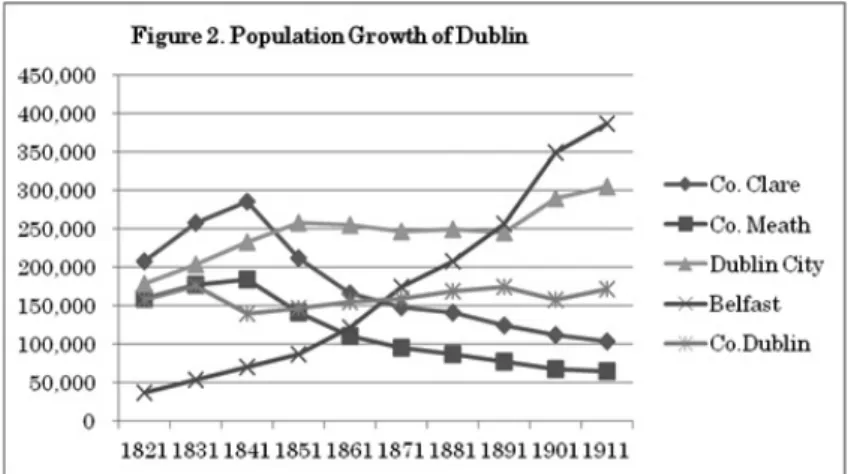
Source: W.E. Vaughan & A. J. Fitzpatrick, 1978, 511.
2 . Demographic features of Dublin
Why was the population growth of the city of Dublin, shown in Figure 2, more sluggish than that of Belfast? It can be explained by examining population growth from the perspectives of natural increase and social increase. The following paragraphs examine the natural population growth of Dublin based on the rates of marriage, fertility and mortality.
Table 1 shows the marriage rates, crude birth rates and crude death rates of Co. Dublin3)
, Co. Clare and Co. Meath in the years from 1865 through 1911. The table indicates that the marriage rates for Dublin were considerably higher than for the other two counties in the table, with the rate in 1865 standing at 7.8. Although this rate declined afterward, it was still high in 1911, with a rate of 6.9. The crude birth rates of Co. Dublin
3)The figures in this table indicate the rates for the entire Co. Dublin, since the data for the city of Dublin and Co. Dublin were not classified in and before 1901.
Family Structure in the City
(including the city) peaked in 1881, and the rate for 1911 was 26.6, considerably higher than the rates of the other two counties, which stood at figures close to 20. As for Dublin s crude death rates, the rates remained high throughout the survey years, with the peak of 25.7 in 1881, and with the rate in 1911 standing at 21.4. For reference, the rate of marriage and the crude rates of birth and death for the city of Dublin on its own, available in and from 1911, were 7.6, 31.7 and 24.5, respectively. These figures were much higher than the rates for the other two counties.
In comparison with the previous 1911, Dublin could see the decrease in marriage rate, reduction of birth rate and decrease in mortality rate, but knowing compared with Co. Clare and Co. Meath and Dublin, we could understand a very high mortality rate. Above these results show that the population structure of Dublin city in 1911 was charactersied by high marriage rate, high fertility rate and high mortality rate. Meanwhile, with respect to the crude death rates, we should particularly focus on the age at death.
According to Table 2, which shows crude death rates by age for 1911, Table 1: Marriage rates, crude birth rates and crude death rates in Co. Dublin, Co Clare and Co. Meath
Source: Annual Report of Registrar General for Ireland. Marriages, births and deaths for 1865, 1871, 1881, 1891, 1901 and 1911.
the immortality rate for under-fives in the city of Dublin was notably high, at 35.3% showing that one in three infants died in the city. Moreover, the mortality of infant under one year was 21.3%. This is an abnormal figure, Table 2: Rate of Mortality by age in Dublin(county and city), Co. Meath and Co. Clare in 1911
Source: Annual Report of Registrar General for Ireland. Marriages, births and deaths for 1911.
Photograph 1. A tenement room on Francis Street in 1913
Source:The National Archives of Ireland, Early 20th Century Ireland
Family Structure in the City
as evident from comparison with the figures for Co. Clare (10.0%) and Co. Meath (8.6%). This high mortality rate in the city of Dublin was partly attributable to the population density in the city.
The population density in Dublin city for 1911 was 114 persons per square kilometer, higher than one of 58 for the city of Belfast. Such a high level of population density in the city of Dublin adversely affected hygiene in the city, resulting in insanitary housing conditions (see Photograph 1.). The high population density can be instanced in Mabbot Street in Northdock Ward: 421 persons resided in 30 houses; among them: This total included 265 residents aged 20 years or above, 82% of whom were born in Dublin, Another instance was Tyrone Street, 778 persons resided in 51 houses;. Within this total were included, 474 persons. Aged 20 years or older, 89% of whom were born in Dublin [M. Crowley, 1971, 21]. Moreover, the high population density also led to the poor condition of the city s drinking water and sanitary facilities [O Grada, Cormac, 2002, 24], reflected in the causes of death. In 1911, the number one cause of death was bronchitis, with a rate of 11.3%, followed by pulmonary tuberculosis, 10.0%; diarrhea and enteritis, 7.8%; pneumonia, 6.8%; and cardiac diseases, 5.2%. In particular, many children under two years died from diarrhea or enteritis. As such, the poor hygiene conditions resulting from the high population density raised the morbidity rate, contributing to high mortality, and hampering the natural increase of the city s population.
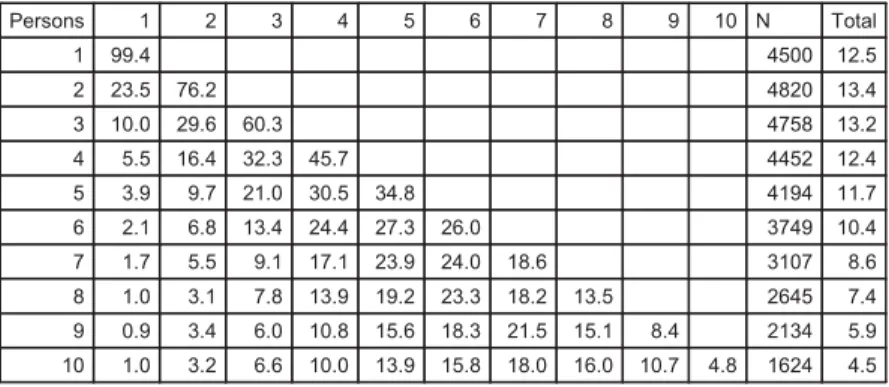
Table 3 indicates the rates of survival of children born in households in the city of Dublin. The leftmost column indicates the number of children born (up to 10 children), and the uppermost horizontal row indicates the survival number of children. For households containing up to six recorded births the survival rate was high. For more than seven recorded births, the
survival rate in households decreased. For a household with up to three siblings the rate of survival was relatively high, standing at 60.3%. However, for a total of six or more than six siblings, the survival rate fell steeply. These features correlate with the high mortality among young children.
However, the high mortality in Dublin was substantially compensated by high fertility in the region. The natural population increase (30,160) for the entire Dublin region (the city of Dublin and Co. Dublin) outnumbered the population growth (28,990) in Co. Dublin during the period from 1901 through 1911. Meanwhile, this natural increase was smaller than Dublin population growth (38,570 persons) during the same 10 year period, into which population drain (9,580 persons) was calculated. Instead, 8,410 persons were required from other neighboring counties to Dublin.
Table 3: Survival Rate of Children in the household in the city of Dublin (1911, %)
Source: Census Returns of Dublin, 1911
Family Structure in the City
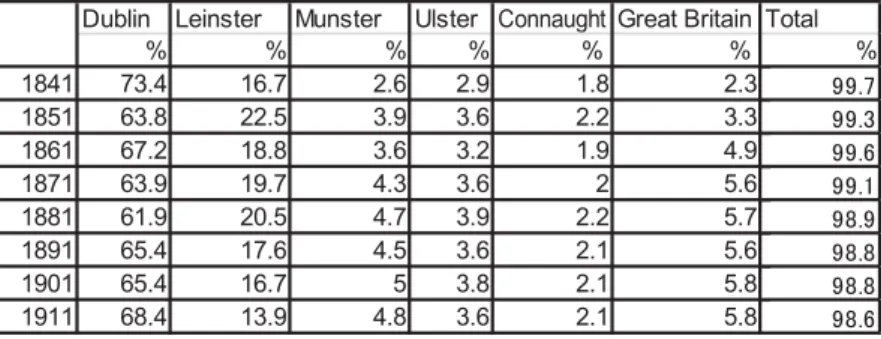
Table 4: Birthplace of residents in Dublin (city and country combined)
Source: Census of Ireland for the Year 1911
The social increasing of population can be explained through the birthplace data for residents in Dublin for the period from 1841 through 1911, which is provided in Table 4.4)
According to the table, out of the residents in Dublin, the proportion born in Dublin remained of the order of 60 or 70 percent in the survey years from 1841 through 1911. While the city s residents from other regions within Leinster temporarily increased to 23% in 1851 in the wake of the Great Famine, the population inflow from within Leinster in subsequent survey years (1420%). consistently remained below that level. Within these figures the largest number was from Co. Wicklow, followed by Co. Kildare, Co. Meath, Co. Wexford and Co. Queen s, in that order. In other words as suggested by the leading order of Co. Wicklow, Co. Kildare and Co. Meath in the population inflow to Dublin, migrants mostly came from nearby areas.
While mass emigration to foreign countries was experienced by Irish people, the population of Dublin actually increased, supported mainly by a natural increase based on the high fertility rates. A flow of migrants from
4)The data on birthplace is used, due to the absence of materials indicating population inflow to Dublin.
specific, limited regions, contributed to the modest population increase. While the major factor in the city s population growth was the natural increase resulting from the region s high birth rates, the increase was kept low by the high mortality rate attributable to high population density and poor environmental conditions. The traditional industries in the city of Dublin, such as cotton, shoemaking and furniture manufacturing, declined, since products in these industries were supplied from Great Britain. As Dublin became less industrialized, increasingly employment in the city was characteristized by consumer services which in this context account for the rise in the number of unskilled laborers with an unattractive labour market, Dublin was unlikely to add greatly to its population.
Preceding paragraphs examined the limited population growth in Dublin. In view of such population structure in Dublin, subsequent sections will aim to define the structure of families in the city of Dublin.
3 . Attributions of household heads
(1) Age attribution of household heads
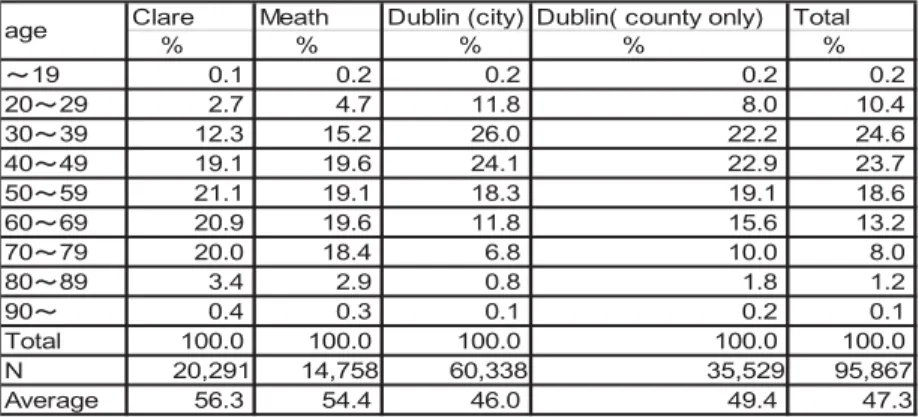
Table 5 shows the age of household heads. According to the table, the highest average age of household heads was 56.3 years for Co. Clare, where the representative farms were mid-sized, followed by Co. Meath featuring large farms (54.4 years), Co. Dublin (in 1911 excluding the city, 49.4 years) and the city of Dublin (46 years). To examine the data in detail, the age of household heads in Co. Clare and Co. Meath bunched in an age range from 40 through 79. In contrast, in families in the city of Dublin, the age of household heads was highest in the range from 30 through 39 (26%), and was progressively lower at older ages: 40 through 49 (24.1%), 50 through 59 (18.3%) and 60 through 69 (11.8%). Regarding the age of household heads,
Family Structure in the City
the concentration in the 3039 age group in the city of Dublin suggests that although residents in the city at the time of marriage were younger than their rural counterparts [A. J. Humphreys, 1966, 88], the marriage age in urban families in the city was still high.
(2) Occupational structure of household heads
Table 6 shows occupation types by household head. Out of the 414 coded categories [K.Schurer & M. Wooollard, 2002, 4652] of occupations engaged in by 0.3% or more of the household heads for Dublin (city band and county combined) totaled 62 types, approximately double the numbers for Co. Clare, 29, and Co. Meath, 32. These results indicate the diversity in the occupational structure in urban areas. To examine the data in detail, the occupation held by the largest number of household heads was unskilled General Laborer, accounting for 13.5%. Aside from General Laborer, occupations held by at least 1% of the household heads included Servant, 2.7% ; Carman, Carrier, Carter, Haulier, 2.2% ; Carpenter, 1.9% ; Tailor, 1.7% ; Commercial Clerk, 1.7% ; Painter, 1.6% ; Messenger, Porter, Table 5: Age of household heads by county in 1911
Source: Census Returns of Co. Dublin, 1911
Code Occupation Dublin (city) % Dublin (co.) % Total % 2 Civil Service(officers and clerks) 0.3 0.4 0.2 3 Civil Service (messengers, & c) 0.4 0.4 0.4
24 Barrister, Solicitor 0.2 0.8 0.4
26 Law Clerk, and others connected with the
law 0.3 0.3 0.3
32 Schoolmaster 0.2 0.4 0.3
54 Domestic Coachman, Groom 0.1 0.6 0.3
55 Domestic Gardener 0.2 1.3 0.6
56 Domestic Indoor Servant 2.7 1.8 2.4
58 Inn, Hotel Servant 0.5 0.1 0.3
60 Office Keeper 0.6 0.2 0.4
62 Charwoman 1.1 0.4 0.9
63 Washing and Bathing Service 0.5 0.7 0.5
67 Broker, Agent, Factor 0.2 0.4 0.3
71 Commercial Traveler 0.5 0.6 0.5
72 Commercial Clerk 1.7 1.3 1.5
75 Bank Service 0.1 0.5 0.3
77 Life, House, Ship & c. , Insurance Service 0.3 0.4 0.4 81 Other Railway Officials and Service 1.0 0.7 0.9 84 Cabman, Flyman, Coachman (not domestic) 0.7 0.7 0.7 85 Carman, Carrier, Carter, Haulier 2.2 1.2 1.8
86 Tramway Company Service 0.1 0.4 0.3
91 Seaman (Merchant Service) 0.4 0.5 0.4
95 Harbour, Dock, Wharf, Lighthouse Service 0.6 0.2 0.4 98 Messenger, Porter, Watchman
(not Railway or Government) 1.3 0.3 0.9
100 Farmer, Grazier 0.1 4.6 1.8
103 Agricultural Labourer, Farm Servant,
Cottager 0.5 4.6 2.0
112 Gardener (not domestic) 0.4 2.2 1.1
114 Groom, Horsekeeper, Horse-breaker 0.3 0.3 0.3 Table 6: Occupations of household heads for Dublin (City) and Dublin (County area only). 1911
Family Structure in the City
126 Printer 1.0 0.4 0.6 135 Fitter, Tuener (Engine and Machine) 0.5 0.2 0.4
167 Builder 1.0 0.6 0.8 168 Carpenter, Joiner 1.9 1.4 1.7 169 Bricklayer 0.8 0.4 0.7 172 Plasterer, Whitewasher 0.3 0.1 0.3 174 Plumber 0.5 0.3 0.5 175 Painter, Glazier 1.6 0.7 1.2 177 Cabinet Maker 0.5 0.2 0.4 192 Coach maker 0.5 0.1 0.3
214 Innkeeper, Hotel Keeper, Publican 0.4 0.4 0.4 215 Lodging, Boarding House Keeper 0.2 0.4 0.3
219 Brewer 0.9 0.1 0.6
223 Milk seller, Dairyman 0.3 0.3 0.3
225 Bucher, Meat Salesman 0.6 0.3 0.5
229 Fishmonger 0.4 0.1 0.3
231 Baker 0.7 0.3 0.6
233 Greengrocer, Fruiterer 0.4 0.2 0.3
236 Grocer, Tea, Coffee, Chocolate Maker,
Dealer 0.8 0.8 0.8
275 Draper, Linen Draper, Mercer 0.6 0.6 0.6
282 Tailor 1.7 0.5 1.2
283 Milliner, Dressmaker, Staymaker 1.0 0.7 0.9
285 Shirt Maker, Seamstress 0.3 0.2 0.3
290 Shoe, BootMaker, Dealer 1.1 0.4 0.8
292 Wig Maker, Hair Dresser 0.4 0.1 0.3
325 Cooper, Hoop Maker, Bender 0.5 0.0 0.3
345 Coal heaver 1.0 0.3 0.7
360 Road Labourer 0.4 0.1 0.3
375 Iron Manufacture 0.4 0.1 0.3
377 Blacksmith 0.5 0.3 0.4
399 General Shopkeeper, Dealer 1.2 0.6 1.0
404 General Labourer 13.5 8.9 11.8
405 Engine Driver, Stoker, Fireman 0.6 0.2 0.5
408 Factory Labourer 0.4 0.1 0.3
Source: Census Returns of Co. Dublin, 1911
Table 7: Household size, Co. Clare, Co. Meath, and Dublin , 1911
Source: Census Returns of Co. Clare, Meath and Dublin, 1911
Watchman, 1.3% ; Shopkeeper, 1.2% ; Charwoman, 1.1% ; Shoe, Boot-Maker, Dealer, 1.1% ; Railway Official and Service, 1.0% ; Printer, 1.0% ; Builder, 1.0% ; Dressmaker, 1.0% ; and Coal heaver, 1.0%. These results imply that large scale manufacturing industries rarely prospered in the city of Dublin. The number of employees in the renowned manufacturer Guinness, one of the city s few large employers, stood at about 2,500 [M. Crowley, 1971, 66].
The analysis in the preceding paragraphs, shows that household heads in the city of Dublin comprised individuals in younger age groups than in rural families. Large numbers of Dublin s household heads engaged in the unskilled occupations characteristic of consumer cities. In the next section, the structure of Dublin s families supported by such household heads is discussed.
4 . Household structure in Dublin
(1) Household size
Family Structure in the City
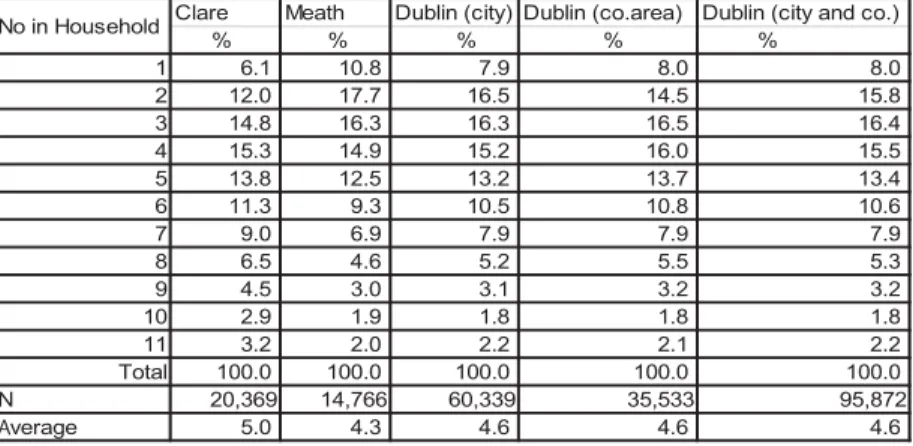
Table 7 shows household size in Co. Clare, Co. Meath, and Dublin. According to the table, the average household size was largest in Co. Clare (5.0 persons) followed by the city of Dublin and Co. Dublin (both at 4.6 persons), and Co. Meath (4.3 persons). To examine distribution of the data, in detail, in Co. Clare, the most common number of household members was four, followed by households with three, five, two and six, in that order. In Co. Meath and the city of Dublin, two-member household were the most numerous grouping, and for higher numbers the proportion fell off, in a manner of negative correlation. Once household size rose to six or more, the proportion of households in Co. Clare exceeded the proportion in Co. Meath and and in the city of Dublin. As pointed out in the previous section, the marriage rate and the birth rate were high in the city of Dublin. The household size in the city for 1911 was low. This implies that children in the Dublin city left their household and took up employment at a relatively early age.
Relations between household size and the number of children can be examined using Table 8. According to the table, in 1911 the average number of children in a single household was 3.5 in Co. Clare, 3.1 for Co. Meath and the city of Dublin, and 3.0 in Co. Dublin. As such, regarding the number of children, a considerable difference is seen between Co. Clare and the other three regions. In Co. Clare, the most common number of children in a single household was two, accounting for 21.0% of the county s households, and this was followed by the rates for households with one, three, four and five children, in that order. Regarding Co. Meath, the city of Dublin and Co. Dublin, one-child households, of the order of 24%, were the largest single grouping The number of children: and the size of household were negatively correlated; the large household decreasing, as the number
of children increased. The data provided in the table concern only children who were actual living in the household at the time of the census survey. Therefore, if the total number of children born in the household was taken into account, their average number in the city of Dublin must have exceeded 4.6.
These results suggest that in the city of Dublin, for children to remain in their household as a family member was less beneficial than in rural families; and that children in the city were likely to leave their household and take up employment relatively early in life, reflecting an underlying family strategy to achieve well-being by maintaining their household at a small size. At the time of the census survey in 1911 in Dublin city, the size of families was relatively small, and the number of children in a single household was smaller than in a rural family. Although the size of households in Dublin at the time of survey was generally small, due to the small number of children, such situations should be deemed as just one Table 8: NUMBER of children in HOUSEHOLDS in Co. Clare, Co. Meath and Dublin, 1911
Source: Census Returns of Co. Clare, Meath and Dublin , 1911
Family Structure in the City
Table 9: Age of children Co. Clare, Meath and Dublin , 1911
Source: Census Returns of Co. Clare, Meath and Dublin, 1911
phase in the lifecycle of the household.
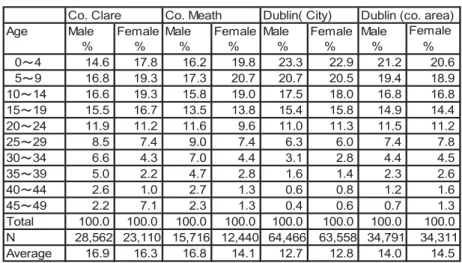
According to Table 9 showing distribution of children by age, the average age of males and females was 16.9 and 16.3 respectively, for Co. Clare; 16.8 and 14.1 for Co. Meath; and 12.7 and 12.8 for the city of Dublin. A noticeable difference is that; the age of children was higher in the counties of Clare and Meath than in the city of Dublin. To examine the data in detail, the distribution of male by age group was similar between Co. Clare and Co. Meath. In the city of Dublin, the proportion of males under 15 years of age was 61.5%, and the proportion of males under 19 years of age was 76.9%. Comparing these rates with corresponding rates for Co. Clare and Co. Meath, it clearly shows that the ages in the city of Dublin were concentrated in younger age ranges. This contrast can be regarded as one of the results of the family strategy adopted by households in the Dublin city, one which encouraged an early departure from the
Table 10: Composition of households in Co. Clare, Co. Meath, City of Dublin and Co. Dublin in 1911
Source: Census Returns of Co. Clare, Co. Meath and Co. Dublin, 1911
household. By way of contrast the data for Co. Clare and Co. Meath show a distribution of relatively large of children aged 30 or over.
This distribution indicates the situation that in these counties children awaited inheritance of household property from their parents who continued to hold patriarchal rights over a long period of time. In contrast, in the city of Dublin where there was no expectation of valuable property from parents, and accordingly, they had to choose to leave their family and take up employment early in life.
(2) Type of household
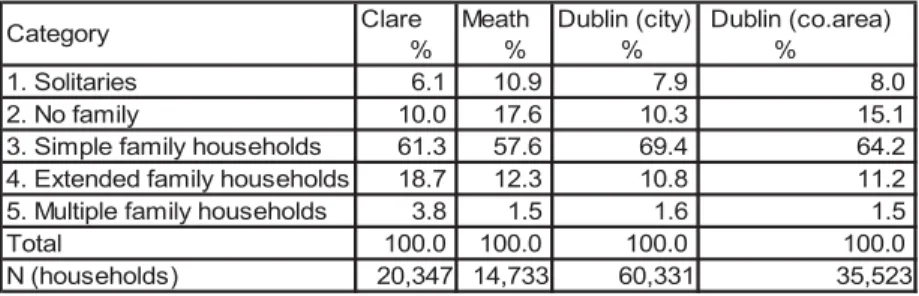
According to Table 10 showing household types based on the Hammel= Laslett model, in Co. Clare, of mid- and mall-scale farms, extended family households accounted for 18.7%, and multiple family households (forming typical stem families) accounted for 3.8% : in combination the two categories totaled 22.5%. Meanwhile, in Co. Meath, the percentages of extended family households and multiple family households totalled only 13.8%, and the percentages of no family (17.6%) and solitaries (10.9%)
Family Structure in the City
were noticeable. In contrast to these two counties (in which towns were few and small), in the city of Dublin, the rate of simple family households accounted for nearly 70%, and the rates of extended family households (10.8%) and multiple family households (1.5%) were close to the percentages for Co. Meath (12.3% and 1.5%, respectively). In Co. Meath, the fact that the rates of solitaries and no family were relatively high clearly indicates weaker family formation and a degree of family disintegration. On the other hand, in the city of Dublin there was a firm pattern of family formation. In Dublin, family formation was one of the family strategies to enhance the level of well-being.
However not all families in the city of Dublin were formed on the basis of the simple family household system. In other words, while families in the city were generally formed on the basis of the nuclear family system, stem families also existed in the city. The next step is to look at families in the city of Dublin from the viewpoint of the class level in the household typology (See Table 11).
Regarding solitaries, the rate of single in Co. Meath was 7.8%, surpassing the rates for the city of Dublin (4.2%) and Co. Dublin (5.1%). As for no family, the rate of co-residence with siblings in County Meath stood at 9.0%, and this was an exceptional figure in comparison with other regions.
As for simple family households in the city of Dublin, the rate of nuclear families comprising a couple and children totaled 42.9%, and couples without children totaled 10.0%. Both of these rates were higher than in other regions. The family types of married couples with/without children were common in the age ranges the twenties through forties. The table also indicates that the rates of widows with children were high
in all of the survey regions. This result is reflected in the average life expectancy of males in Ireland in and around 1911 (46.5 years), a feature itself confirmed in the statistical absence of many household heads on the day of the census survey. Regarding extended family households in the city of Dublin, it was distinctive that the rate of lateral extension (4.0%) was more noticeable than that of upward extension and downward extension. On the other hand, for Co. Clare, the rates of upward extension and downward extension were relatively high, clearly indicating the presence of stem families. As for multiple family households, in Co. Clare, higher rates of upward extension and Table 11: Composition of households in Co. Clare, Co. Meath and Dublin (city and county ) in 1911
Source: Census Returns of Co. Clare, Co. Meath and Co. Dublin, 1911
Family Structure in the City
downward extension indicated a potential tendency to create stem families. In the city of Dublin, the rate of downward extension was high, and this was due to family situational factors; there were many families in which a couple co-resided with the family of their children, and in which a widow co-resided with the family of her children.
Analysis suggests that in the family structure in the city of Dublin, the formation of simple family households featuring both high marriage rates and late marriage was dominant, although marriage ages were not as high as in Counties Clare and Meath. At the same time, depending on situational factors, stem families could potentially be formed in the city, as well.
(3) Numbers of relatives
The data provided in Table 12 is based on a method for counting the number of relatives proposed by R. Wall in 1983 [R. Wall, 1983, 500]. The table shows the structure of the relationships of relatives living in the household to the household head, as well as the numbers of relatives and non-relatives in terms of numbers per 100 households. This method is capable of complementing the problems in household classification based on the Hammel=Laslett model. According to the table, the total number of relatives was largest in Co. Clare, standing at 53.9 persons, followed by 49 persons for Co. Meath, 36.4 persons for the city of Dublin and 35.7 persons for Co. Dublin. These results suggest that urban families in the Dublin city were smaller than rural families. Also, it was confirmed that the form of
simple family household was dominant among families in the city.
To examine the data in detail, families in Co. Clare contained larger numbers of lineal relatives, such as parents, children in-law and grandchildren, and in contrast, families in the city of Dublin contained
relatively larger number of collateral relatives, such as siblings and their spouses, as well as nephews and nieces. The existence of such collateral relatives is correlated with lateral extension and downward extension in extended family households. As for Co. Meath, the data s features can be positioned in between those of Co. Clare and the city of Dublin. While the number of relatives in Co. Meath s households indicated similarity to that of rural households, the composition differed from that characteristic of stem families.
The county households contained large numbers of collateral relatives, such as siblings, nephews and nieces, and the distribution pattern was reflected also in the high rate of no family. Farms worked by family members were prevalent, in Co. Clare, in contrast to Co. Meath, with its larger farms where the employment of farm laborer was commonplace. The number of servants was smallest in the city of Dublin (13.7 persons), and was largest in Co. Dublin (35.1 persons), attributable to the large Table 12:Resident Reratives and other by Relationship Household head per 100 Household (unit=persons)
Source: Census Returns of Co. Clare, Co. Meath, City of Dublin & Co. Dublin, 1911
Family Structure in the City
number of servants residing in middle- and upper-class households in the suburbs of the city of Dublin. Meanwhile, in Dublin, servants aged 30 or less accounted for 85% of all servants in Dublin, and most younger servants were unmarried [D. Connor, G. Mills & N. Moore-Cherry, 2011, 254]. Therefore, these servants can be regarded as lifecycle servants as in Britain. The numbers of lodgers, boarders and visitors were relatively small in rural households. In the other hand, boarders had relatively high figures of 24.2 persons per 100 households for the city of Dublin, and 41 persons for County Dublin. Moreover, the numbers of lodgers and visitors for Dublin were larger than in rural households. As such, co-residence with non-kin can be regarded as a feature of urban households. Urban families tended to temporarily receive, in their household, relatives and acquaintances who at the time of immigration to the city lacked housing arrangements. The large number of non-kin in households in Dublin was directly reflected in the household size in the region.
The analysis in the preceding paragraphs shows that families in the city of Dublin had a smaller number of relatives than had families elsewhere. This situation was reflected in the existence of simple family households ; and by way of servants, boarders or visitors, a relatively large number of non-relatives.
(4) Life course
Figure 3 suggests the life course of households in the city of Dublin. To describe the status of household members from the viewpoint of household head, household members in the city of Dublin got married either on reaching the age range of 15 through 19 or later. In accordance with such marriage, a spouse joined the household. In general the household head at
the time of the census was most likely to be in his/her fifties or sixties. If present, parents of household heads were commonly in higher age ranges beyond the fifties or sixties. The number of children in the household started to decrease, after children reached their late twenties. Some household members were to remain single throughout their lifetime. The household contained servants ranging from their late teens upward through their thirties.
Marriages in the city of Dublin took place at a younger age than in rural areas. Children left their household earlier in life. Household members who were parents of the household head feature mostly in age grouping above the late sixties. As for non-kin, servants aged between 15 and 40 lived in the household, and other non-relatives of various ages were also contained
Source: Census Returns of the City of Dublin, 1911
Family Structure in the City
in the household.
5 . Conclusion
From the evidence of the preceding sections, the outcome was that a simple family household featuring late marriage was basically dominant among families in the Dublin city, and this was based on a family formation in line with the principle of the nuclear family system. These features suggest the Hajnal theory. However, urban society was not composed only of people born in the urban area; it also contained many immigrants from rural areas, some of whom perpetuated the ethos characteristic of rural families. Therefore, if family situational factors worked favorably, stem families could potentially be formed. In such cases, even in urban families.
In specific instances members held patriarchal rights over a long period of time, in line with the ethos of rural families. However, siblings in urban families as a rule did not receive a property inheritance as was common in rural families. As a consequence, children in urban families were likely to leave their household earlier in life and take up employment as an unskilled worker or lifecycle servant. They got married if conditions for marriage were met. Their age at marriage tended to be lower than in rural families, in which children had over time some expectation of patriarchal rights. Young urban couples, in general, created and lived in a new home.
The structure of urban families was based on the population structure featuring high marriage rates, high fertility and high mortality. As a conclusion, the simple family household was a dominant family form, and this implies that the family norms in line with the principle of the nuclear family system constituted one of the most effective family strategies to achieve well-being in urban life. While the nuclear family system was
dominant among families in the city of Dublin, stem families could be formed as well, if situational factors worked favorably for such family formation. However, formation of stem families took place only in one of the phases of the life course of households. No previous studies have been conducted regarding families in urban society such as is attempted in the present study of Dublin. This research is intended to be meaningful, through identifying features of the family structure in the city of Dublin by numerical analysis. Further studies remain to be conducted, such as detailed family analysis by administrative ward in Dublin, and from a perspective of social class analysis of families in both the city and its suburbs.
Acknowledgments
I am deeply to Emeritus Professor Louis M. Cullen of Trinity College Dublin for supporting and correcting this paper. I got lots of help from Associate Professor Arne Solli of University of Bergen for programing and operating of my data. I had benefitted from a grant the 201315, Grand-in-Aid Scientific Research (C), Project Number 25380722.
References
Unpublished Documents
Census Returns of Ireland, Co. Clare, 1901 & 1911, Co. Meath, 1901 & 1911, Dublin, 1911, National Archives Dublin.
British Parliamentary Sessional Papers
Second annual report of the Register General of Marriages, Births and Deaths in Ireland: 1865, HC. 1869, Cd-4, Dublin: His Majesty s Stationery Office.
Eight annual report of the Register General of Marriages, Births and Deaths in Ireland: 1871, HC, 1874, Cd-968, Dublin: His Majesty s Stationery Office.
Eighteenth annual report of the Register General of Marriages, Births and Deaths Family Structure in the City
in Ireland: 1881, HC, 1882, Cd- 3244, Dublin: His Majesty s Stationery Office.
Twenty-eighth annual report of the Register General of Marriages, Births and Deaths in Ireland: 1891, HC, 1892, Cd- 6787, Dublin: His Majesty s Stationery Office.
Thirty-eighth detailed annual report of the Registrar General for Ireland containing A General Abstract of the Numbers of Marriages, Births, and Deaths, detailed annual report of the Register General (Ireland) of Marriages, Births and Deaths in Ireland during 1901, HC, 1902, Cd-1225, Dublin: His Majesty s Stationery Office.
Forty-Eight detailed annual report of the Registrar General for Ireland containing A General Abstract of the Numbers of Marriages, Births, and Deaths, 1911, HC, 19123.Cd. 6313, Dublin: His Majesty s Stationery Office.
Ireland,Census of Ireland 1911: Province of Leinster, City of Dublin, HC,1912, Cd-60492-Ⅱ, Dublin: His Majesty s Stationery Office.
Ireland,Census of Ireland 1911: Province of Leinster, County of Dublin HC. 1912, Cd-6048-Ⅰ, Dublin: His Majesty s Stationery Office.
Published books and papers
Connor, D, G. Mills & N. Morre-Cherry, the 1911 Census Dublin city: A Spatial Analysis,Irish Geography, 442/3, 2011, 245263.
Cullen, Louis, The Growth of Dublin 16001900: Character and Heritage, in F.H.A. Aalen & K. Whelan, Dublin, City and Country: From Prehistory to Present, Dublin: Geography Publications, 1992.
Daly, Mary, Dublin, The Deposed Capital, a Social and Economic History 1860 1914, Cork: Cork University Press, 1984.
Hajnal, John, Two Kinds of Preindustrial Household Formation System,Population and Development Review, 83, 1982, 449494.
Humphreys A., New Dubliners, Urbanization and the Irish Family, NewYork: Routledge 1966.
McManus, R., Dublin 19101940, 2002, Dublin: Four Courts.
O Brien, Joseph,Dear, Dirty Dublin: A City in Distress, 18991916, Berkeley & Los Angeles, California: University of California Press, 1982.
Cousins, Mel,Poor Relief in Ireland, 18511914, Oxford: Peter Lang, 2011. 30 ST. ANDREW S UNIVERSITY SOCIOLOGICAL REVIEW Vol.48 No.1
O Grada, Cormac, Infant and Child Mortality in Dublin a Century Ago, Center For Economic Research, Working Paper Series, 2002, Department of Economics,
University College Dublin.
O Maitiu, S.,Dublin s Suburban Towns 18341930, Dublin: Four Court Press, 2003. Cousins, Mel,Poor Relief in Ireland 18511914, Oxford: Peter Lang, 2011. Prunty, J.,Dublin Slums 18001925, Dublin: Irish Academic Press, 1988.
Schurer, K. & M. Woollard, National Sample from the 1881 Census of Great Britain 5% Random Sample, Working Documentation Version 1.1, University of Essex, Historical Censuses and Social Surveys Research Group, 2002.
Shimizu, Yoshifumi, Household Structure of Co. Clare in Ireland at the Early 20th Century,St. Andrew s University Sociological Review, 2011, 442, 537, (the articles by Shimizu are in Japanese).
Shimizu Yoshifumi, Household Structure of Co. Meath in Ireland, St. Andrew s University Sociological Review, 2012, 452, 138. (the articles by Shimizu are in Japanese).
Shimizu Yoshifumi, Transition of the Irish Household Structure: Comparing Results from the 1901 and 1911 Census Results, with Reference to Two Cases of Glencolumbkill and Clogheen,St. Andrew s University Sociological Review, 2013a 47 1, 134.
Shimizu Yoshifumi, The Irish Household Structure in Co. Mayo in the early 20th Century,St. Andrew s University Bulletin of the Research Institute, 2014a, 392, 1 32. (the articles by Shimizu are in Japanese).
Shimizu Yoshifumi, Changes in Families in Ireland from the 19th Century to the Early 20th Century,St. Andrew s University Sociological Review, 2014b, 472, 124.
UCD GPEP Dublin 1911 Census Project,Second City Dublin 1911, 20102011 Vaughan, W.E. & A.J. Fitzpatrick (eds.),Irish Historical Statistics Population 1821 1971, Dublin: Royal Irish Academy, 1978.
Richard, Wall, (ed.), Family Forms in Historic Europe, Cambridge: Cambridge University Press, 1983.
Family Structure in the City
This paper sets out to illustrate the characteristics of Irish family in the city of Dublin and test the Hajnal s hypothesis, Two Kind of Preindustrial Household Formation System .
My hypothesis is that simple family households were the dominant type in the city of Dublin from the perspective of nuclear family system, but most migratory people in Dublin had the ethos of stem family latently and formed the extended family households and multiple family households at a rate that is very close to neighboring counties, for example Co. Meath.
As the result of above analyzing we had the following conclusion. The families in Dublin, the simple family household proved more effective as a family strategy, than a more complex form based on the stem family. Meanwhile, families in the city of Dublin also included a considerable number of kin migrating from rural areas. For these migratory families to lead a happy life in an urban area, adaptation to the norms of urban family was more effective than maintaining the norms of rural family.
In other words, while a simple family household may have been based on the nuclear family system. The normative ethos of the rural family continued to be found in some aspects of family structure in the city of Dublin. While adopting the structure of an urban family, families in the city had the potential to form a stem family, depending on family situations.
Keywords: Dublin, Irish family,Hajnal s theory,Rate of marriage, fertility and mortality,Simple family household,Family strategy
Family Structure in the City
of Dublin in Early 20th Century
SHIMIZU Yoshifumi