The Application of the Bureau-Shaping Model:
The Case of Indonesian Village Fiscal Transfers Policy
Khairullah ANSHARI
Abstract
This paper examines the relevancy of the bureau-shaping model with the case of Indonesian Village Fiscal Transfers (Dana Desa). Two contemporary government trends—decentralization and deinstitutionalization—are used to address the supporting evidence towards the bureau-shaping model. This paper concludes that the central government tries to maintain its size to be more of a control agency and expands to the bottom from the central level to the local level to the village level. Two propositions need to be empirically tested further. First, current village fiscal transfers change the regency government into more of a control agency rather than a delivery agency. Second, the village government responded to the huge budget increment by choosing to be more of a contract agency by outsourcing towards community instead of increasing their role as a delivery agency.
1.Introduction
In the field of public choice and political economic theory, William Niskanen (1971) offered a “budget-maximizing model” indicating that most bureaucrats act to maximize their bureau budget, but later on Niskanen (1991) dropped the theory that bureaucrats seek for the maximization of discretionary budget. Regarding the complexity of bureaucracy, Patrick Dunleavy (1985, 1991) criticizes Niskanen’s model by saying that it possesses four weaknesses: First, it sees all agencies as one large line bureaucratic system. Second, it makes vast presumptions about bureaucrats’ utility functions. Third, it defines bureaucratic behaviour as possessing a collective, top-single, homogenous character. Finally, it characterizes bureaucracy as a single scaled-up organization. Thus, Dunleavy presents a counter-pass of Niskanen’s budget-maximizing model, which he entitled “the bureau-shaping model.”
The bureau-shaping model proposed that rational bureaucrats have few incentives to perform budget-maximizing strategies. Dunleavy (1991, p.174) noted the following:
There are four reasons why rational bureaucrats should not budget-maximize. First, collective action problems exist within bureaucracies and have an important influence upon overall bureau behaviour. Second, the extent to which bureaucrats’ utilities are associated with budget increases, varies greatly across different components of overall budgets, and across distinct types of agencies. Third, even if some rational officials still budget-maximize, they will do so only up to an internal optimum level. Fourth, senior officials are much more likely to pursue work-related rather than pecuniary utilities.
The four reasons above are the core of the bureau-shaping model. The bureau-shaping model originated in the United Kingdom (UK). Some scholars have tested this model. Research by Marsh, Smith & Richards in the Whitehall (central government) of the UK noted that the bureau-shaping model explanation in the development of Next Step agencies has some weaknesses, namely, an insufficient view in the political scope, mis-specification of bureaucrats’ preferences and oversimplification of splitting between management and policy work (Marsh, Smith, & Richards, 2000).
In the case of the spending cuts in UK’s local government, Cope (2000) marked the local budgeting, when enacted in the political process, involved both the demand (politician) and supply (bureaucrats) side. The bureau-shaping model is only a supply-side model that can explain only half the budget story. Still in UK’s local government, Gains and John (2010) tested the hypothesis of bureau-shaping preferences. Bureaucrats in the policy-making and the policy implementer level liking on doing bureau-shaping preferences. All like to carry bureau-shaping preferences into the time they employ for different tasks. For doing that they should be capable controlling their work organization.
Outside the UK’s local government, other examples of relevant studies have focused on commonwealth nations like Australia, New Zealand and India. In observing Australia’s federal budget, Dollery and Hamburger (1996) pointed out that the direct test of allocative efficiency aggregate data has failed to reflect the bureau-shaping’s explanation of bureau growth during federal budget sectors 1982-83 and 1991-92. Alter-Shaw (2001) researched the 1997 New Zealand Employment Strategy and concluded that the bureau-shaping analysis failed to explain both the variation in officials’ preferences in the Employment Strategy and the influence that Cabinet Ministers had on the resolution of the key policy debates. Another researcher, Perry (1996) tested the validity of the bureau-shaping model in the decentralization experience in Karnataka, India 1987-91. The result contradicts the bureau-shaping hypotheses. First, delivery agency officers’ attitudes related to the changes of agencies’ program budgets. Second, delivery agency officers both state-level averse and district-level more averse the decentralization. The last, officers’ rank, agency type and their work preferences have no correlation that affected by decentralization.
The bureau-shaping model empirical testing from the above explanations indicates that the model is appropriate for explaining bureaucracy internal interaction, but excludes the political interaction with non-bureaucratic bodies. For the cross-country approach of the bureau-shaping model, which is more familiar and applicable in its origin environment in the UK than outside as an example in the commonwealth nations above. The researchers above have witnessed and criticized the relevancy of using the bureau-shaping model in various platforms of bureaucracy from central to local with diversified motions from the UK Next Step Agencies policy, the New Zealand Employment Strategy, the UK’s Local Government Act 2000, Australia’s federal budget, and as well as India’s decentralization.
Regarding the same study foundation, the author examines the applicability of the bureau-shaping model on the case of the Indonesian village fiscal transfers policy. This paper tries to construct the relevancy theory with seeking details support from the case. Village fiscal transfers are an up-to-date rural development policy derived as the major implementation point from Village Law 6/2014. This policy is an extension effort of the Indonesian large-scale decentralization initiative (Lewis, 2015; Saputro, 2015). Village fiscal transfers categorized as “intergovernmental transfers (IGTs) refer to transfer of money from the central government to lower levels of government, or from subnational governments to local government units” (Alam, 2014, p.1).
The village fiscal transfers policy is to provide enormous funds from the national government, adding to the existing amended contribution funding from the regency to the village. As a result, on average, the village budget in the years 2015 and 2016 grew 10 times greater than in the year 2014. Moreover, this increase in budget is not given to an ordinary modern institution. The budget given to village government which is a community-based organization that performs governance functions and is considered as the lowest government agent of Indonesia’s administration
that is closest to their society. The village fiscal transfers policy captivated the attention of national leaders, politicians, local bureaucrats, non-government organizations and, of course, the society. Many have questioned the readiness of the village government for the implementation of village fiscal transfers (Adi & Sangadji, 2015).
The village fiscal transfers case attracts the author’s curiosity in the governance side. The notion is that the fiscal transfers brought contemporary bureaucratic behaviour to the village government. This writing is the first step in cultivating bureaucratic behaviour by implementing the bureau-shaping model in the Indonesian village with the event of village fiscal transfers. This paper clarifies what the bureau-shaping model is; describes the Indonesian village fiscal transfers; and discusses the relevancy and potential research application of the bureau-shaping model components in the Indonesian village fiscal transfers.
2.The Bureau-shaping Model
Niskanen believed that senior bureaucrats fight for utility gain through budget maximization because bureaus tend to behave as oversupplying unit. On the other hand, Dunleavy thought that senior bureaucrats discourage total budget expansion (unless budget for senior bureaucrats) thus choose to shape their bureau to a smaller, central, elite unit which is rated as a positively- valued working environment. Dunleavy have four major arguments about the discourage of senior bureaucrats towards budget expansion (Rowley & Elgin, 1985).
The first Dunleavy’s (1991, p.174) argument highlights the “collective action problems inside bureaucracies”. Dunleavy
(1986; 1991) states the best way to pursue individual welfare is through individual strategy. The budget-maximizing model focuses on hiking the entire agency’s budget. Moreover, a collective budget increment does not have precise implications for any official. Plus, agencies are familiar with sectionalisation work units. It is favourable that officials prefer to choose to increase their section’s budget only rather than the whole agency’s budget because doing so has a better prospect of bringing individual benefits. A comprehensive budget increase might involve dynamic distribution of budget flows to each section, which means varying the individual benefits. Further, rational bureaucrats prioritize individual utility maximizing strategies, as well as senior bureaucrats, who possess the greater power to do individual strategies. Undergoing collective action might be the least desirable choice because bureaucrats must meet the condition that their net utility is derived from a marginal budget increase after addressing any costs associated. The costs are the probability that an individual bureaucrat’s influence or advocacy will be decisive in securing the budget increase and the costs of personally advocating budget increment. Last, after being reduced by those costs, the net utility must be greater than the rate of return on individual efforts to improve the bureaucrat’s welfare.
The second Dunleavy’s argument bureaucrats’ decisions for budget maximization depend on types of budget and types of agency. Dunleavy (1985; 1989b) classifies budget into four types. Core budget, or ‘running cost,’ consists of expenditures
for its own operations, for example, salary. Bureau budget includes all core budget plus monies that are moved to the
private sector. The fund is controlled by according to the bureau’s own decisions. Program budget comprises the whole
bureau budget and monies given to other public sector bodies for implementation, under the agency’s supervision.
Super-program budget is the agency’s program budget, including any expenditure by other bureaus from their own
resources. But the agency can exercise some policy responsibilities. Bureaucrats’ personal utilities are unequally involved in the expansion of different areas of the overall budget. Rational bureaucrats are concerned mainly with their core budget and bureau budget, but most utility considerations are dependent upon bureaucrats’ rank. For instance, bottom- and middle-ranked bureaucrats gain from core budget expansion, top-rank bureaucrats gain from bureau budget increases, and agency patronage gains from the increase of the program budget.
delivery agency carries direct services or outputs for citizens or enterprises. This agency has a clear hierarchy line
and is labour-intensive. The regulatory agency functions to limit or control the behaviour of individuals, enterprises
and other public sector bodies. The cost of its operation is relatively cheaper than that of the delivery agency, because it is patterned majorly on paper-moving and supervision organizations. Another agency type is the transfer agency, which administers government subsidies or entitlement to private individuals or firms. It is a money-moving
organization. The contract agency develops projects in the form of contracts and tenders them out to the private
sector. The contract agency arranges in advance research and development, preparing service specifications, contract management and compliance and other related aspects. The control agency organizes funding allocation for public sector bureaus in the form of grants or intergovernmental transfers. This agency supervises the fund spending.
Bureaucrats consider of budget increment diversity not only on types of budget, but also types of agency. Delivery and regulatory agencies tie bureaucrats up to core budgets. Senior bureaucrats in contract, transfer and control agencies have strong reasons to increase bureau budgets than core budget because the proportion of the agencies’ core budgets are very small than bureau budget in the program budget. For officials in control agencies, an increase in program or bureau budgets might bring an increase in the open core budget. Regarding the control agency task, the expansion of a super-program budget might produce an unprofitable situation in which the control agency cares less due to less utility feedback (Dunleavy, 1989a).
The third Dunleavy’s (1991, p.195&197) argument “variation of time…rank and the bureaucrats’ optimal budget level”.
The budget expanded until it reached a period where it stopped growing. If do continuously growing this budget enter the unmanageable period. This unmanageable period was triggered by constraints like finite capabilities and size of the institutions, very large departments accumulated its inertia, and top management have too broad work scope. A large agency that keeps forcing budget expansion faces the above constraints and risks getting to a point where loses its functions to other (rival) agencies. Rational senior bureaucrats are careful not to push their agency budget to the point that the growth brings the agency into an insecure standing.
The conditions for collective action toward budget increment are also influenced by three aspects of bureaucrats’ rank. First, individuals benefit from budget increases: low ranked bureaucrats realize a bigger benefit than high ranked bureaucrats do. Second, the probability of individual influence for advocacy will rise decisively in parallel with the probability for high ranked bureaucrats. Third, the cost for advocating budget growth increases according to bureaucrats’ rank as well. Using the way of thinking of the demand-and-supply model, the demand side is the discounted marginal utility, and the supply side is the marginal advocacy cost. The cross point that meets the two sides is the optimal budget level, where the marginal benefit resulting from budget increment is equal to the marginal advocacy cost that was taken by bureaucrats for pursuing budget increment. Optimal budget level is like economic equilibrium point where supply and demand are balanced. After passing over the cross point, bureaucrats are discouraged from continuing to pursue budget increase strategies because most likely they will not obtain much benefit anymore. In addition, the bureaucrats’ optimal budget levels vary according to rank of bureaucrats and types of agencies (Dunleavy, 1991).
The fourth Dunleavy’s argument, senior officials choose work-related rather than pecuniary utilities. There are several
reasons for their choice. First, public sectors have established a standardized system for payment that limits individual or collective actions toward enacting welfare-increase strategies, including budget-maximizing strategies. Not to mention, some systems, like personnel, accommodation, finance, and salary systems, are centralized. Another reason for choosing work-related utilities is senior bureaucrats’ perception that budget maximization represents an increasing workload rather than a means for securing pecuniary utilities. Budget increases are found to be
frustrating for senior bureaucrats. Work-related utilities have influenced the individual preferences of bureaucrats who want to work in a small, elite, collegial bureau close to a political power centre. Even so, there is always a money-oriented motivation for bureaucrats in every utility. The search for utility gains are easily constrained by tension and sensitivity among bureaucrats in different bureaus that share the same salary system. All in all, bureaucrats disfavour working in large staffed, large budget routine, conflictual, and low-status agencies (Dunleavy 1986, 1989; Marsh, Smith, & Richards, 2000).
Individual strategies are the most effective way to gain pecuniary utilities; however, bureaucracy is designed to conduct collective action and in so doing, they reduce the odds for individual strategies to succeed. In terms of collective actions, budget expansion provides uncertain implications for individual utilities. Hence, rational bureaucrats prefer to engage the bureau-shaping strategies for work-related utilities. The goal of bureau-shaping strategies is to change a bureaucrat’s bureau closer to staff functions, a collegial atmosphere, and a central location. Regarding types of agency, the bureau that pro for doing bureau-shaping model wants to be more of a control, transfer or contracts agency rather than a delivery agency (Jung, et al., 2001).
Dunleavy (1986; 1991) declares that there are five bureau-shaping strategies (see also Stoker 1995; James 2003). The first bureau-shaping strategy is major internal reorganizations. A change of structure leads the agency to a more
elite function of a policy-making level. Geographical constraints can push the reorganization of agencies into effective agencies that fit with regional policy objectives. Those who do not adapt their functions to the agency’s vision can be transferred to other agencies. The second bureau-shaping strategy is transformation of internal work practices.
Policy-level officials want to advance their work content and status. Sophistication of management can be accomplished by installing high-level, skilled, or professional staffs, but doing so entails reducing bureau personnel and applying new means like computerization, contracting out, and automation of routine work.
The third bureau-shaping strategy is redefinition of relationship with external ‘partners’. Agencies cooperate with
external organizations like subordinate public agencies, contractors, and client interest groups. These relationships can be used to rearrange work relations for transferring routine tasks and intensifying the agency control function. Policy-level officials select auto-pilot control for regular tasks and instead focus on policy-relevant issues. The fourth bureau-shaping strategy is competition with other bureaus. Bureau compete with other bureaus for programs and policy
coverage that fit their ideal image like high content policy-level staff, the control of vital resources that increased bureau prestige and influence. Rather than competing with other bureaus, bureaus openly export problematic and unbeneficial tasks to them. The fifth bureau-shaping strategy is load-shedding, hiving-off and contracting out.
Top-tier agencies could export their responsibilities to other agencies to shape their bureau into an ideal bureau. Load-shedding to subordinate agencies, hiving-off to quasi-government agencies, or contracting out additional functions to the private sector are actions which result in a decrease of the agencies’ core and bureau budgets but preserve program budget (Dunleavy, 1986; Smith, 1998).
3.Research Significance and Methodology
The reasons why this paper choose to examine the bureau-shaping model in the case of Indonesian village fiscal transfers because the model provides explanation about budget type, agency type and the bureaucrats preferences. In the context of village fiscal transfers policy, with using the bureau-shaping model we could see the dynamic of fiscal transfers budget flows to the bottom level government from the changes of central-local budget proportion and budget typology and central-local organization typology that related to village fiscal transfers policy. About bureaucrat`s preferences, in the village fiscal transfers policy, budget increase that flows to other level government
opens the discussion of reaction of bureaucrats. The bureaucrat`s preferences by bureau-shaping model provide the standard to examine the bureaucrats’ reaction towards village fiscal transfers policy. The reaction expected differently among central and local bureaucrats. Moreover, bureaucrats’ reaction based on its preferences might be very different in the village level because their basic foundation is a community-based government organization located in the rural area. Involving the village level bureaucrats with the village fiscal transfers is the new challenge for bureau-shaping model.
This research is the opportunity that enriches and challenges the model. The village fiscal transfers policy is different with the origin case of bureau-shaping model. Originally the model is tested in the British central state or Whitehall in the 1980s where the streamline of motives is central government high budget burden resulting the government to performed agencies and privatization. Distinctively, the village fiscal transfers policy is the situation where the budget of Indonesia’s government increased and flown to the bottom level government with the spirit of decentralization and community-based governance. The geographical distinction between UK-developed country (European/western) and Indonesia-developing country (Southeast Asian) also an addition for contribution to the model coincide as a challenge. James (2003, p.24) adds that “Dunleavy developed the explanatory part of the bureau-shaping model as a general model to explain a range of administrative situations and experiences including inappropriate privatisation, administrative reform and deinstitutionalisation across central and local government”. James’s opinion above is the privilege foundation that bureau-shaping model could be applied in the case of village fiscal transfers policy.
Every model has its privilege and limitation, various research that use bureau-shaping model also show the constraint of bureau-shaping model. The main constraint of bureau-shaping model is the politician side. In UK, Cope (2000) clarify that in budget decision-making the bureau-shaping model provides explanation on the bureaucracy’s side only, it is incomplete without politician’s side. Also, Marsh, Smith, & Richards (2000) adds that in the UK’s Next Steps reform is pushed by politician while the bureaucrats preferences to adopted the reform constrained by the civil servants culture that they have to accept the reform that imposed by politician. The ethos or the sense of duty is also constrained their bureaucrats` preferences. Also, in the case of Australia Federal Budget 1982-83 and 1991-92 suggest that politicians’ preferences are more influential than bureaucrats’ preferences towards the budget changes and bureau’s size. In addition, external factors like economy and international relations influence on government and its bureaus. For the New Zealand Employment Strategy, Alter-Shaw (2001) commented the same thing that the institutional change was opened by politician, bureaucrats only recommended the options that reflected their preferences, but in the end the minister took the decision. The last is the India’s decentralization to Panchayat, bureaucrats` preferences toward peculiar utilities are constrained by political environtment of their work place.
According to above scholars findings that politician side is the constrained in proving the validity of bureau-shaping model. Thus, the author declare that this paper is fully on the bureaucracy side. However, in the future of developing this research, the author should be aware that might have to face to explore the politician side. A combination of other theory might be needed in the future which the author possibly combine with the theory of decentralization. As an example case Alter-Shaw (2001) combines the theory of his research namely bureau-shaping model with budget-maximizing model and historical institutionalism.
In the previous part of this paper, we have discussed the four features of the bureau-shaping model and identified five bureau-shaping strategies. Alongside, Dunleavy believed his theory that bureaucrats want to work in smaller, more central staff bureaus provides a relevant explanation for the development of government. Contemporarily, the model explains two aspects (in Dunleavy, 1991). First, it explains the government growth on the wave of devolution and decentralization, wherein the expansion of government has focused on hiving-off top-tier responsibilities to
lower-tier governments. The central government has a control and transfer format, and the local entities play the role of service delivery. The second aspect is the trend of privatization and deinstitutionalization. Bureau-shaping models present convincing explanations as to why senior bureaucrats support privatization and deinstitutionalization even though this action made budget increases flow to the private-sector or to a more community-based organization, diminishing the role of existing agencies that used to do the service delivery.
These two aspects are the methodology to connect the bureau-shaping model with the case of the Indonesian village fiscal transfers discussed in this paper. They identify the potential of the bureau-shaping model explaining the village fiscal transfers, and vice versa. Multilevel-government analysis of bureaucratic behaviour will be cultivated towards the involvement in the village fiscal transfers policy. Regarding multilevel-government analysis, in this whole paper is a macro-level analysis define as analysis in the national level. The data used for macro-level analysis are from Indonesia’s national financial note from Ministry of Finance and Indonesia’s financial statistics of village government, regency/municipality (city) government, province government and statistics of 70 years Indonesia’s independence from Statistics Indonesia Bureau. The result of this paper is that the firm components will be found for testing the validity of the bureau-shaping model in relation to the milestone action of Indonesia’s decentralization policy towards the development of villages. At the last part of this paper the author breakdowns of micro-level analysis in local government level-village government level responding the implementation of village fiscal transfers policy.
4.The Indonesian Village Fiscal Transfers
After the 1997-98 Asian financial crisis that resulted in the falling of the New Order for Indonesia, the country changed its administration system from a centralized to a decentralized system. Starting from 2001 with the Local Government Law 22/1999, then revised with Law 32/2004, the central government gradually empowered the local government. Indonesia`s administration classified its territory into two layers of local government. The first layer is the province (Provinsi). The second layer is comprised of the regency/district (Kabupaten) and the city (Kota). The
main features of the decentralization are namely the following: apparatus reform dividing civil servants into central officials and local (province/regency/city) officials; devolution and splitting government affairs into absolute and concurrent authorities (Bert et al., 2003); democratizing local politics with the initiative of local head direct election;
and equalizing central-local fiscal relations by fiscal transfers (Skoufias et al., 2011). The idea of decentralization has
been in dispute. Pepinsky and Wihardja (2011) noted that decentralization has had no discernible impact on the country’s economic performance. In contrast, Soejoto et al. (2015) concluded that decentralization not only brought economic growth, but it also increased human development and decreased the total poor population. At the same time, McCulloch and Sjahrir (2008) added that local growth was mostly higher in the poor regencies. Continuously searching for improvements, in 2014, the Local Government Law No.32/2004 proliferated into three laws: the Local Government Law 23/2014, the Local Election Law 1/2014, and the Village Law 6/2014.
The Indonesian term for “village” is Desa. Villages are located under the regency and coordinated according
to districts (Kecamatan) as the representation of regency government. Unlike the higher government units that
categorized as formal government bodies, village governance engages a hybrid system of governance combining
self-governing community with local self-government (Marx and Ghosh 2014; MoHA 2015; Silahudin 2015).
Self-governing communities mean villages constitute community-based organizations which have their own distinctive characteristics of governance depend on their local customs. The ingenuity of individual villages is respected and recognized as part of Indonesia’s administration. Villages employ local self-government mean villages operate own
government functions limited by its territory with an autonomy degree. Altogether, villages are communities that possess own governments operate by the representatives of own village residents. Administratively central government and local governments are authorized to transfer authority or just to delegate some functions to a village. Villages are authorized to finance themselves, but in fact most of their operations depend on financial assistance from the regency government.
The government is aware of the importance of villages. Hence, if we consider the content of Village Law 6/2014, we find two prominent contents. First is the political content: the government highlights the village’s position clearly and definitively by acknowledging four groups of village authority, namely, authorities from its origin, local scale village authorities, authorities by local government and other authorities delegated by central or local government. The second is the financial content; this is the most substantial content of Village Law; it enacted fiscal transfers to finance the operation of village authorities. The Village Law legitimates the central government contributes directly to financing villages via a fiscal transfer called Dana Desa. The prior existing financial resources from the regency
have also increased due to a revision in the counting formula of the regency village allocation fund (Alokasi Dana Desa) and due to the shared regency tax revenues (Bagi Hasil Pajak Daerah dan Retribusi Daerah). As a result, the
village budget hiked ten times on average from village budget fiscal year (FY) 2014 to village budget year FY 2015 (see also figure 2), and has been planned for escalation every year since. Indonesia’s financial expansion to villages is truly paramount. Furthermore, the significance is that the budget expansion is trusted not to ordinary bureaucrats but to village government who can be addressed not only as local bureaucrats, but also as members of community organizations.
5.The Bureau-shaping Model of Indonesian Village Fiscal Transfers Policy
The bureau-shaping model provides explanations for two contemporary trends that are relevant to the case of Indonesia’s regional policy, which includes the village fiscal transfers policy. These trends imply that Indonesia has been enacting strategies for bureau-shaping. First is the trend of decentralized government, and the second is the government decision to deinstitutionalize functions to other bodies.
5.1.Decentralization
Indonesia follows the trend of decentralization. Evidence of this statement is that the development of budget proportion between central and local governments is evolving to an equal proportion (see figure 1). During the years 1969-99, Indonesia’s expenditure/budget comprised two broad groups known as routine expenditures and development expenditures. The routine expenditures included the budget for local governments named subsidy for autonomous area see Shah et al. (1994) and personnel expenses. Capital spending was considered as a central budget
expenditure. Development expenditures are also considered central budget expenditures. Gradually since the year 2000, Indonesia has divided their expenditures into central spending and transfers to local governments. In figure 1 central spending-line is the budget for ministries/central bodies. Transfers for local governments are budget for local governments-line. The conclusion result of central-budget equal proportion is because budget for non-central bodies which is originally disburse by central government is separated from budget for ministries/central bodies. Budget for non-central bodies comprises for nation debt with interest payment and subsidy for electricity, petroleum, social welfare, etc.
The budget equal proportion between central and local governments is not only because of budget expansion to local governments. But also, because the national budget that goes to support village governments has also expanded (see Figure 2). The policy of Indonesian village fiscal transfers suggest that Indonesia is using the bureau-shaping strategies. For the village fiscal transfers policy, Indonesia redefined its relationship with external ‘partners’. Trusted with a huge amount of resources, villages are no longer passive actors in the administration acting simply as consumers of service delivery. Rather villages are old players that have been reactivated to join the production of service delivery directly with new and far higher ammunition. This new role means that both the central and local governments rearrange their relationships with villages. Dunleavy (1991, p.204) noted that “bureaus extend the scope of their patronage of external bodies, but only where this can be achieved in line with preferred image”. To maintain their preferred image, central and local governments should increase their control upon villages.
0% 20% 40% 60% 80% 100%
Budget for Local Governments Budget for Ministries/Central Bodies Budget for Non-Central Bodies
Figure 1. Indonesia’s Government Central-Local Budget Proportion from 1969-2017
Source: Indonesia’s Financial Note FY 1998-99, 2000, 2001, 2003, 2005 2012 and 2017.
Figure 2. Indonesia’s government budget percentage for local governments and villages 2005-17 *For FY 2017, regency village allocation fund has not been calculated. Source: Author combined data from Indonesia`s Village Government Statistics 2005-15 with Indonesia’s Financial Note FY 2009, 2012 and 2017.
85% 88% 90% 93% 95% 98% 100% 2005 2007 2008 2010 2012 2013 2014 2015 2016 2017*
Financial Aids both from Central Gov. and Local Gov. to Villages (Includes Village Fund)
Regency Transfers for Villages/ Village Allocation Fund
Transfers for Local Governments (Provinces, Regencies & Cities)
Further, due to the legal position of villages under the administration of regency, the villages’ main source of finances is regency government providing allocation for the village. Central and provincial government offered some forms of financial assistance, but not all villages received that support. Eventually, starting in 2015, the implementation of Village Law reformed the financial resources for villages where all villages received fiscal transfers from regency government as well drastically-increased resources from the central government, which were the biggest contribution.
Decentralization addressed the government growth towards bottom-level units instead of top-level units. Dunleavy (1991, p.224) suggested that this trend was a shift by the central government that wanted to be more control of transfer agency than of delivery agency. According to Law 23/2014, Indonesia’s government affairs consist of six absolute affairs; concurrent affairs contain twenty four mandatory affairs and eight optional affairs; and general government affairs are government affairs under the authority of the President as head of government. The central government shares almost all affairs with the local government for example education, health, public works, etc. except for six absolute affairs: defence, security, religion, judicial, foreign policy, monetary and fiscal. This sharing of affairs resulted in central bodies operating more as control, regulatory and transfer agencies. Local governments had more of the capacity for delivery agencies. Regulatory, control or transfer agencies do not need a higher core and bureau budget like delivery agencies do. The sharing of many affairs bring the consequence of sharing higher funds to finance concurrent affairs. This situation helps explain why the proportion of Indonesia’s budget increased for local governments and declined for central bodies.
For government affairs account, central government bodies are more control, regulatory or transfer agencies and local governments are delivery agencies. But in the case of village fiscal transfers, multiple types of agencies can exist in a single institution. Throughout local government departments, the character of delivery agency changed for regency. The direct provision of service delivery remains, but when it comes to administering the village fiscal transfers, the regency functions as transfer, regulatory and control agency. The village played as delivery agency. The village position as subordinate unit of the regency arranged the order regency controls and villages deliver. The increase of fiscal transfers to villages optimize village as delivery agency as a result village service delivery is more active and decreasing the burden of regency for service delivery for the society.
The bureau-shaping model features typology of budget. The government growth can be explored deeper with using the budget typology. The result of budget typology of Indonesia’s budget by looking of budget pattern in multi-level governance in figure 3 (for the means of expenditure see appendix). The first is the central government budget decades before 1998, the government core and bureau budget percentage dominates the annual budget than program and super program budget. This is because the budget for central bodies is higher than non-central bodies and local government budget. Further, all civil servants are considered as central government employee whom all paid by central budget. Later on, in the decentralization’s era starting from 2001 the budget structure gradually twisted upside down the core and bureau budget is smaller than program and super program budget. This situation indicates the improving character of central government as control agency that controls transfers of money to local governments and villages that considered as program and super-program budget.
The province, regency/city, and village level has same pattern of budget. The pattern is from highest is the core budget, program budget then bureau budget, respectively. However, the percentage of each type of budget is different in every level and these differences sign the different types of agency. The province as the representation of central government that have the capacity to supervised regency and city have the smallest percentage of core budget that continuously decreasing and have the highest program budget compare to regency/city and village this show the character of province as regulatory agency stronger than as delivery agency. On the regency/city level
and village level shows same pattern as strong delivery agency which the core budget is very high. But regarding village fiscal transfers policy, Regency/city program budget hiked in the year 2015 and 2016. This hiked is related to the change of allocation formula for village allocation fund from the regency and as a result regency transfers for villages increased (see figure 2). The increase of regency transfers could indicates the change of regency city from delivery agency approaching as control agency towards villages.
5.2.Deinstitutionalization
Dunleavy (1991, p.229) defined deinstitutionalization (DE) as “a trend away from modes of service delivery which are formalized, institutionalized, centralized... towards more community-based, de-concentrated delivery... using people in the community instead of employee to deliver services”. DE involves two different aspects. The first is in a single tier of government, where a new separated agency or a new section in an established agency performs activities replacing the prior one. The other aspect involves two tiers of government, where the central government instructs
0% 25% 50% 75% 100% 19 69 -7 0 19 72 -7 3 19 75 -7 6 19 78 -7 9 19 81 -8 2 19 84 -8 5 19 87 -8 8 19 90 -9 1 19 93 -9 4 19 96 -9 7 19 99 -20 00 20 02 20 05 20 08 20 11 20 14 20 17
National Budget Typology
Core & Bureau Budget
Program & Super Program Budget
0% 20% 40% 60% 80% 100%
Total Provinces Budget Typology
0% 20% 40% 60% 80% 100%
Total Regencies & Cities Budget Typology 0% 20% 40% 60% 80% 100% 2008 2010 2012 2013 2014 2015 2016 Total Villages Budget Typology
Figure 3. Indonesia’s government budget annual percentage based on Dunleavy’s budget Typology (in %) Source: Author combined data from Indonesia`s Financial Statistics of Village Government 2008-16, Financial Statistics of Regency/Municipality (City) Government, Financial Statistics of Province Government 2004-2015, Indonesia’s Financial Note FY 1998-99, 2000, 2001, 2003, 2005 2012 and 2017, main websites http://www.bps.go.id and https://www.kemenkeu.go.id/uuapbn.
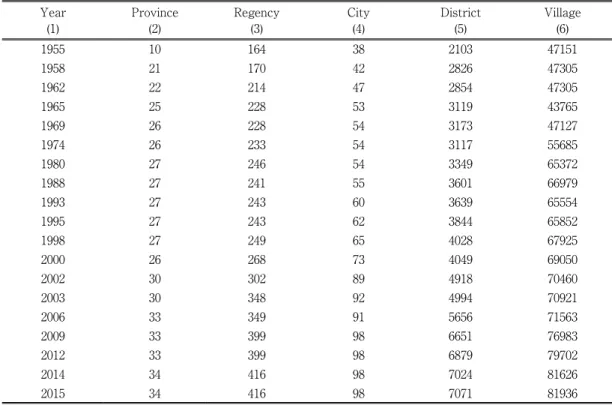
local level established agencies to conduct activities by establishing alternative local agencies. Based on the definition, DE can be found in the development of local governments and villages (see Table 1). The number of all local entities rose in Indonesia from 1955 to 2015. Looking to the growing number of local entities as a quantitative approach and in a vertical view, DE is conducted for a new territorial arrangement. The central government decreased its functions to local governments and villages; and their coverage of administrative areas declined.
Contrary speaking, the growing of new local entities or new bureaus in the government might be said as institutionalization since quantitatively the number of organizations increased. But the author is consistent using the definition of DE which the focus of flowing function to other agency like the principle of decentralization. Regarding the village fiscal transfers policy, the expansion of government functions is expanded horizontal and vertical. For horizontal view, the functions for central policy towards village move from Ministry of Home Affairs (MoHA) to Ministry of Village, Development of Disadvantaged Regions, and Transmigration (MoV) and the Ministry of Finance (MoF). For vertical view, central government shared public service delivery to the prior to local governments/ regency government then to village government that endure the community-based government so it is less institutionalised and more self-govern by the community.
In the vertical view of the central-local-village relation, the fiscal transfers impacted to the rearrangement of the relation/structure and task distribution among institutions involved (see Figure 3). Deinstitutionalization resulted in both the single-tier and two-tier way. Before the village fiscal transfers policy, the power for regulating villages was only in the MoHA. The village regulatory task of MoHA included rule-making, initiation and administration of a national-scale village program, supervision of village governance progress, and so on.
The single-tier deinstitutionalization marked as conducting bureau-shaping strategy of major internal reorganization. In the new arrangement, central level agencies formed to replace the singular MoHA, and shares the responsibilities of village affairs with two other ministries, i.e., MoV and MoF. Dunleavy (1991, p. 239) argued that in the “DE process...
Table 1. The development of local governments and villages years 1955-2015 (in unit)
Year Province Regency City District Village
(1) (2) (3) (4) (5) (6) 1955 10 164 38 2103 47151 1958 21 170 42 2826 47305 1962 22 214 47 2854 47305 1965 25 228 53 3119 43765 1969 26 228 54 3173 47127 1974 26 233 54 3117 55685 1980 27 246 54 3349 65372 1988 27 241 55 3601 66979 1993 27 243 60 3639 65554 1995 27 243 62 3844 65852 1998 27 249 65 4028 67925 2000 26 268 73 4049 69050 2002 30 302 89 4918 70460 2003 30 348 92 4994 70921 2006 33 349 91 5656 71563 2009 33 399 98 6651 76983 2012 33 399 98 6879 79702 2014 34 416 98 7024 81626 2015 34 416 98 7071 81936
senior bureaucrats (in top-tier, established agencies and new organizations), all trying to restructure their own activities... which fit their preferences and ideal image of their bureau.. and tensions between them are bound to occur”. During the first run in early 2015, there was a confusion between MoHA and MoV as to which had the authority to control village affairs, which resulted in tensions between them (Rosarians, 2015). Eventually, the stipulation of government regulation No.11-12/2015 divided their tasks, specifying that the task of the MoHA is village governance/ administration and the task of the MoV is village development (evo, 2015). The MoF’s role is to manage and regulate the village fund distribution mechanism. The province’s role followed the deconcentration principal (see Rondinelli & Cheema, 2007) and served as the representative agent of central government to supervise and guard the success of policy implementation. To ensure success, central level agencies hived-off education and training programs for village government apparatus to province government (Gir/JPPN 2015; MoHA 2016).
The regency has long been financing village government through providing village regency allocation funds and regency tax revenue sharing. Moreover, the MoF mandated the regency to determine village funds for every village since the MoF’s jurisdiction only determines the allocation of the village fund pool for regency scale. The position of transfer agency was stronger for regency. Furthermore, the regency was positioned as the primary top and bottom informant both for central government and village governments. Central government obtained information regarding the village fiscal transfer progress from regency government. Reversely, the regency was obligated to break down, translate, socialize and enforce the overall regulations. These responsibilities made regency perform the regulatory agency type. Nevertheless, regency validated the administration of village fiscal transfers, placing regency as the control agency. Village affairs handles by one agency named Community Empowerment and Village Governance Agency (Badan Pemberdayaan Masyarakat dan Pemerintahan Desa). On this government level, a single agency can be
more than one type under the Dunleavy typology of agency (see figure 4).
MoHA
Province
Regency
District
Village
MoV MoHA MoF
Province Regency District Village Central’s Representative Supervision Function Regulatory, Control and Transfer Task
Coordination Function
BEFORE
AFTER
Figure 4. The central-local-village relationship -= direct relation - - - = indirect relation
MoHA = before: Village Regulatory Task, after:Village Governance Regulatory Task MoV = Village Development Regulatory Task
MoF = Transfer Task
Two tier deinstitutionalization is taking place at the village level. Central government instruction is embodied in the village fiscal transfers for financing village scale authorities, which consist of four clusters: village governance activities, village development (infrastructure), social services (relations), and community empowerment (Eko, 2015). This new village arrangement has impacted on regency authorities that legitimate at the village level since villages fall under the regency’s administration. For purposes of efficiency and effectivity, the regency authorities adjusted their authorities’ components. The adjustment was aimed at reducing the regency authorities as a delivery agency for the villages. Another bureau-shaping strategy of hiving-off regency work to the villages can be a controversial process for regency-level bureaucrats, namely that someone might lose his/her work fields. In contrast, the villages have to bear a high budget increment that could possibly change the organizational behaviour of village government and increase their workload.
Dunleavy (1991) explained that senior bureaucrats generally support deinstitutionalization. At the central level, tensions occurred between MoHA and MoV, but did not last long (Antlov, Wetterberg, & Dharmawan, 2016). Like Dunleavy (1991, p.239) said, the “tensions... bound to occur, but may not produce the overt organizational conflict”. Further, the support of village fiscal transfers from senior central level bureaucrats increased because, according to Dunleavy, transfer blocks of funding in the form of program budgets did not effect changes to senior bureaucrats’ welfare. In this case, the village fiscal transfers were defined as a super program budget from the central government to the village, which did not impact the welfare of central-level bureaucrats. The transfers from the central level did not come from any ministries but from the national budget account. Moreover, the Indonesian decentralization model assigned the central level as the controller to perform as the control, regulatory or transfer agency and the local government as the delivery agency. Dunleavy (1991, p.239) adds that DE has few positive or even negative impacts on central agencies which are already in the configuration of those abovementioned agency types. Besides, the DE process in the village fiscal transfers policy harmonized with the bureau-shaping proposition, integrating the three ministries into a single staff unit with a broad scope of concerns and a low level of public visibility. That unit now manages policy by channelling funds to subordinate public agencies.
The bureau-shaping model provides an explanation for the reactions of the regency and the village. The regency adjusted to the establishment of village-scale authorities by rearranging its authority over their activities at the village level. Dunleavy (1991, p.238) sees this adjustment as an open opportunity towards a major redefinition of work tasks. The impact of village fiscal transfers at the regency level might lead to the bureau-shaping model proposition for regency government in favour of diverting away from delivery agency into more policy control agency in the case of village level public service. In other words, regency controls and villages provide. As for the village, it can be addressed as a new organization that has been reborn of the old organization, with a new task. For the new task and new budget by fiscal transfers of village, Dunleavy (1991, p.239) suspected that new organizations wanted the funding growth to continue with expanding responsibilities and obligations, but they also behaved selectively for their activities rather than wholesale doing all activities. The village might behave selectively with its own preferences for spending the village fiscal transfers. The efficacy of the bureau-shaping model at the regency level and at the village level are open for micro-level testing (see Rhodes, 1986).
6.Further Research: Developing Bureau-shaping Prepositions
Dunleavy’s book Democracy, Bureaucracy and Public Choice provides various evidences that the motives of government growth towards decentralized agencies are for bureau-shaping for central level senior bureaucrats. Likewise, this paper also provides evidence from Indonesia’s decentralization policy as well as the village fiscal
transfers policy that Indonesian’s administration style is expanding on the bottom with the arrangement control, transfer and regulatory agencies on the central level, and delivery agencies on the bottom. Diverting the budget away from central to local is also in line with the bureau-shaping model. The diverted away budget allowed the Indonesian central agencies to maintain their size and provided the chance for development to the local agencies.
Theoretically speaking, the bureau-shaping model should be relevant to any level of senior bureaucrats’ preferences from central to local and even village. Since bureau-shaping model have collections of central level evidences, thus Indonesia’s village fiscal transfers is a case for developing the bureau-shaping model by gathering new evidences at the regency level and village level. Regarding the variations in rank, budget, and agency types, a challenge opens for the relevance of the bureau shaping model on regency government and village government. Whether on those government level, bureaucrats have the bureau-shaping preferences of working in the small staff unit, decreasing the delivery agency task an importing to a more policy level bureaucrats to be more control, regulatory and transfer task. A field research needed to verify the bureau-shaping proposition with the operation, as explained below.
Regency level bureaucrats. First, administering the village fiscal transfers led to the addressing of multiple agency
types in one agency. The research explores the bureaucrats’ preferences when acting in each type of agency and explores to what extent bureau-shaping propositions were implied in the bureaucrats’ strategies. Second, regarding the presence of village scale authorities, it is interesting to explore the regency level reaction of hiving-off and load-shedding power to village government. How do these authorities arrange the new coverage of regency authorities as the delivery agency? Whether the regency level bureaucrats embrace the village fiscal transfers policy by making bureau-shaping propositions or by making this the hard way by competing with village in doing no changes of village scale regency projects. All in all, the broad and simple conclusion hoped to be obtained is that the regency governments, due to the village fiscal transfers implementation, have been behaving as described in the bureau-shaping model.
Village level bureaucrats. Marsh, Smith, & Richards (2000) and Cope (2000) utilized the bureau-shaping model in the
situation of a budget decline. In contrast, the Indonesian village fiscal transfers is a case where the budget obviously increased. This different budget situation is the opportunity to test the relevance of the bureau-shaping model in bureaucrats that deal with high budget availability. The research will explore the village bureaucrats’ preferences and how their preferences influenced the making of the village budget. It is possible for central level agencies to hive-off work to shape an agency into more, smaller elite units of controlling other bodies or to subordinate bodies. But for village government, the author has the notion that they will behave the same way, shifting the village government from a delivery agency into more of a contract agency. The strategies to achieve this notion include outsourcing community work. By sharing the utilization of village fiscal transfers with the community, the village government can shape its agency into more of a policy type rather than a service delivery agency. Nevertheless, continental differences enrich bureau-shaping model application, which varies among different nations and government tier bureaucrats.
7.Conclusion
Dunleavy (1991) explained that bureaucrats prefer to improve their working utilities rather than pursue budget increment utilities. Bureaucrats face severe collective actions in reaching the budget increment. The net utility that one bureaucrat receives from a budget increment should be bigger than the utility received by doing individual strategies. Besides, the net utility is resulted after having been constrained by bureaucrats’ probability influence and advocacy cost. Also, situations that demotivate bureaucrats to pursue budget increment utilities are variations of
their rank, agency types and budget. That is why bureaucrats choose to shape their offices into small elite staff units with a broad scope of policy concerns rather than large-sized work units, routine work, conflictual tasks and close to public visibility. This bureaucrat behaviour mind-set is called the bureau-shaping model.
By using the two contemporary government trends decentralization and deinstitutionalization, the bureau-shaping model can be spotted in the case of village fiscal transfers. On the fiscal side, Indonesia is expanding from central to local then to village. The high increase of local budgets resulted in equal proportions in the central budget. This central-local equal proportion was contributed to also by village fiscal transfers. It seems that the central level maintains its bureau size by permitting the budget to be diverted away to the local governments and villages. On the agency type side, the Indonesian central government defends the arrangement where control is on the top and service delivery is on the bottom. For administering the village fiscal transfers, multiple types of agencies lie in one institution at the regency level. Village fiscal transfer implementation involves two forms of deinstitutionalization. Single-tier deinstitutionalization was in place when the central agency for administering villages, namely the MoHA developed into three ministries, the MoHA, MoV and MoF. Two-tier deinstitutionalization marked in the present of village-scale authorities making the village stronger for public service delivery. The new village authorities open the potential for the regency level to redefine their work task hiving-off, exporting the delivery function to the village and shifting to be more or a policy-advice agency.
Regarding the potential of shifting the character of a delivery agency from the regency level to the village level, further field research should be done at the regency level and village level. The early presumption is that both government levels will comply with the bureau-shaping model, but each in their own way. Regency government rearranges their work to be more in control than delivery by hiving-off some authorities to village government. Village government shifts their function from a delivery agency to a contract agency by doing outsourcing in the form of community work in the utilization of village fiscal transfers.
References
Adi, G. N., & Sangadji, R. (2015). Govt Calls for Prudent, Transparent Spending of Village Funds. Retrieved March 3, 2015, from www.
thejakartapost.com/news/2015/12/28/govt-calls-prudent-transparent-spending-village-funds.html
Alam, M. (2014). Intergovernmental Fiscal Transfers in Developing Countries (Commonwealth Secretariat Local Government Reform
Series 5 ed.). London: The Commonwealth.
Alter-Shaw, R. H. (2001). Shaping the Bureau or Maximising the Budget: Rational Choice, Historical Institutionalism and Bureaucratic Reform in New Zealand. Turitea: Massey University.
Antlov, H., Wetterberg, A., & Dharmawan, L. (2016, 3 1). Village Governance, Community Life, and the 2014 Village Law Indonesia.
Bullletin of Indonesia Economic Studies.
Bert, H., Kaiser, K., Goga, S., & Chakeri, J. (2003). Decentralizing Indonesia: A Regional Public Expenditure Review Overview Report. World
Bank: East Asia Poverty Reduction and Economi Management Unit.
Cope, S. (2000). Assessing Rational-Choice Models of Budgeting From Budget Maximizing to Bureau Shaping: A Case Study of British Local Government . Journal of Public Budgeting, Accounting and Financial Management 12(4) , 598-624.
Dollery, B., & Hamburger, P. (1996). Modelling Bureaucracy: The Case of The Australian Federal Budget Sector 1982-1992. Public Administration, 74, 477-507.
Dunleavy, P. (1985). Bureaucrats, Budgets and the Growth of the State: Reconstructing an Instrumental Model. British Journal of Political Science, 15(3), 299-328.
Dunleavy, P. (1986). Explaining The Privatization Boom: Public Choice Versus Radical Approaches. Public Administration, 64, 13-34.
Dunleavy, P. (1989a). The Architecture of the British Central State, Part I: Framework for Analysis. Public Administration, 67, 249-275.
Dunleavy, P. (1989b). The Architecture of The British Central State. Part II: Empirical Findings. Public Administration, 67, 391-417.
Dunleavy, P. (1991). Democracy, Bureaucracy & Public Choice. Hertfordshire: Harvester Wheatsheaf.
Eko, S. (2015). Regulasi Baru, Desa Baru: Ide, Misi, dan Semangat UU Desa [New Regulation, New Village: Idea, Mission, and Spirit of Village Law]. Jakarta: Kementerian Desa, Pembangunan Daerah Tertinggal, dan Transmigrasi Republik Indonesia [Ministry of Village,
Development of Disadvantaged Regions, and Transmigration].
evo. (2015, March 3). Pembagian Tupoksi dan Kewenangan Dua Kementerian Terhadap Desa [Task and Authority Arrangement of Two Ministries Towards Village]. Retrieved January 5, 2017, from pedekik.com:
http://www.pedekik.com/pembagian-tupoksi-dan-kewenangan-dua-kementerian-terhadap-pemerintahan-desa/
Gains, F., & John, P. (2010). What Do Bureaucrats Like Doing? Bureaucratic Preferences in Response to Institutional Reform. Public Administration Review Vol.70, 455-463.
Gir/JPPN. (2015, July 29). KEMENDAGRI latih 222,279 Aparatur Desa Kelola Duit [MoHA Trained 222,279 Village Apparatus for Money Management]. Retrieved January 5, 2017, from JPPN.com:
http://www.jpnn.com/news/kemendagri-latih-222279-aparatur-desa-kelola-duit
James, O. (2003). The Executive Agency Revolution in Whitehall: Public Interest Versus Bureau-Shaping Perspectives. New York: Palgrave
Macmillan.
Jung, Y.-D., Kim, K., Kwon, Y., Rha, H.-m., Muramatsu, M., & Onishi, Y. (2001). Structural Changes of The Central State Apparatus in Japan and Korea. International Review of Public Administration, 6 (1).
Lewis, B. D. (2015). Decentralising to Villages in Indonesia: Money (and other) Mistakes. Journal Public Administration and Development DOI: 10.1002/pad.1741.
Lowndes, V. (1996). Varieties of New Institutionalism: A Critical Appraisal. Public Administration, 74, 181-197.
Marsh, D., Smith, M., & Richards, D. (2000). Bureaucrats, Politician and Reform in Whitehall: Analysing The Bureau-Shaping Model.
British Journal of Political Science 30(3), 461-482.
Marx, S., & Ghosh, A. (2014). Comparative Review of Village Governance in Cambodia, Indonesia, Papua New Guinea, and the Philipines. Dili:
The Asia Foundation.
McCulloch, N., & Sjahrir, B. S. (2008). Endowments, Location or Luck? Evaluating the Determinants of Sub-National Growth in Decentralized Indonesia. World Bank East Asia and Pacific Region Pacific Poverty Reduction and Economic Management Unit.
MoHA. (2015). Panduan Pelatih/Fasilitator Pelatihan Peningkatan Kapasitas Aparatur Pemerintahan Desa [Manual for Trainer/Facilitator Village Government Apparatus Capacity Improvement Training]. Jakarta: Kementerian Dalam Negeri (MoHA).
MoHA. (2016, March 9). Kemendagri Terus Tingkatkan Kemampuan Aparatus Desa [MoHA Always Improve Village Government Apparatus].
Retrieved January 5, 2017, from Kementerian Dalam Negeri (Ministry of Home Affairs): http://www.kemendagri.go.id/ news/2016/03/09/kemendagri-terus-tingkatkan-kemampuan-aparatur-desa
Niskanen, W. A. (1971). Bureaucracy and Representative Government. Chicago: Aldine Atherton Inc.
Niskanen, W. A. (1991). A Reflection on Bureaucracy and Representative Government. In A. Blais, & S. Dion (Eds.), The Budget-Maximizing Bureaucrat: Appraisals and Evidence (p. 13). Pittsburgh: University of Pittsburgh Press.
Pepinsky, T. B., & Wihardja, M. M. (2011). Decentralization and Economic Performance in Indonesia. Journal of East Asian Studies 11,
337-371.
Perry, H. J. (1996). Bureaucrats, Development and Decentralisation in India: The Bureau-Shaping Model Applied to Panchayati Raj in Karnataka, 1987-91. London: University of London.
Rhodes, R. (1986). The National World of Local Government. London: Allen and Unwin Ltd.
Rondinelli, D. A., & Cheema, S. G. (2007). Decentralizing Governance. Washington, D.C.: Brookings Institution Press.
Rosarians, F. (2015, January Tuesday, 13). Jadi Polemik Jokowi Serahkan Soal Desa Kepada JK [Became a Polemic Jokowi Gives The Village Issue to JK]. Retrieved January Thursday, 5, 2017, from Tempo.co:
https://m.tempo.co/read/news/2015/01/13/078634511/jadi-polemik-jokowi-serahkan-soal-desa-kepada-jk
Rowley, C., & Elgin, R. (1985). Towards a Theory of Bureaucratic Behaviour. In D. Greenaway, & G. K. Shaw (Eds.), Public Choice, Public Finance and Public Policy (pp. 31-50). Oxford: Basil Blackwell Ltd.
Saputro, E. N. (2015). The Political Economy of Fiscal Decentralization. Retrieved March 3, 2017, from www.thejakartapost.com/
news/2015/09/07/the-political-economy-fiscal-decentralization.html
Shah, A., Qureshi, Z., Bagchi, A., Binder, B., & Zou, H.-f. (1994). Intergovernmental Fiscal Relations in Indonesia: Issues and Reform Options
(World Bank Discussion Papers ed.). Washington D.C.: The World Bank.
Silahudin, M. (2015). Kewenangan Desa dan Regulasi Desa [Village’s Authority and Village’s Regulation]. Jakarta: Kementerian Desa,
Pembangunan Daerah Tertinggal, Transmigrasi Republik Indonesia (MoV).
Skoufias, E., Narayan, A., Dasgupta, B., & Kaiser, K. (2011). Electoral Accountability, Fiscal Decentralization and Service Delivery in Indonesia. World Bank: Poverty Reduction and Economic Management Network Unit, Poverty Reduction and Equity Unit.
Smith, M. J. (1998). Theoritical and Empirical Challenges to Central Government. Publis Administration, 76, 45-72.
Soejoto, A., Subroto, W. T., & Suyanto. (2015). Fiscal Decentralization Policy in Promoting Indonesia Human Development.
International Journal of Economics and Financial Issues, 5, (3) 763-771.
APPENDIX: Indonesia’s Multi-Level Governance Budget Typology
Table 1. National Budget Typology (in trillion Rp.)
Fiscal Year Core Budget & Bureau Budget
Program Budget & Super Program Budget
Total
Expenditure
Fiscal Year Core Budget & Bureau Budget
Program Budget & Super Program Budget
Total
Expenditure
Budget for
Central Bodies
Budget for Non- Central Bodies Transfer for Local Gov. (and Village)
Total Program & Super Program
Budget for
Central Bodies
Budget for Non- Central Bodies Transfer for Local Gov. (and Village)
Total Program
& Super Program Budget
1969-70 0.3082 0.0128 0.002 0.0148 0.323 1984-85 13.2481 2.7458 1.7868 4.5326 17.7807 (95%) (4%) (1%) (5%) (75%)<14%> (15%)<200%> (10%)<45%> (25%)<111%> <29%> 1971-72 0.4674 0.0411 0.0002 0.0413 0.5087 1987-88 16.1419 8.1574 2.8112 10.9686 27.1105 (94%)<111%> (6%)<212%> (0.1%)<-75%> (6%)<173%> <114%> (60%)<22%> (30%)<197%> (10%)<57%> (40%)<142%> <52%> 1975-76 2.34 0.0717 0.264 0.3357 2.6757 1990-91 30.9073 12.5771 3.8875 16.4646 47.3719 (87%)<259%> (3%)<80%> (10%)<52700%> (13%)<731%> <287%> (65%)<91%> (27%)<54%> (8%)<38%> (35%)<50%> <75%> 1978-79 3.5983 0.5124 0.5078 1.0202 4.6185 1993-94 44.767 17.0423 6.9087 23.951 68.718 (78%)<54%> (11%)<615%> (11%)<92%> (22%)<204%> <73%> (65%)<45%> (25%)<36%> (10%)<78%> (35%)<45%> <45%> 1981-82 11.6208 0.9153 1.233 2.1483 13.7691 1999-2000 119.72 82.28 29.9 112.18 231.9 (84%)<223%> (7%)<79%> (9%)<143%> (16%)<111%> <198%> (52%)<167%> (35%)<383%> (13%)<333%> (48%)<368%> <237%> 2002 96.3 127.7 98.2 225.9 322.2 2011 461.508 446.7354 412.5079 859.2433 1320.7513 (30%)<-20%> (40%)<55%> (30%)<228%> (70%)<101%> <39%> (35%)<78%> (34%)<3%> (31%)<41%> (65%)<18%> <34%> 2005 170.8 95.4 131.5 226.9 397.8 2014 577.1648 626.4123 573.703 1200.1153 1777.1828 (43%)<77%> (24%)<-25%> (33%)<34%> (57%)<0.4%> <23%> (32%)<25%> (35%)<40%> (32%)<39%> (68%)<40%> <35%> 2008 259.7019 433.6541 292.4335 726.0876 985.7307 2017 758.378 552.0613 764.9251 1316.9864 2080.4512 (26%)<52%> (44%)<355%> (30%)<122%> (74%)<220%> <148%> (36%)<31%> (27%)<-12%> (37%)<33%> (63%)<10%> <17%> 245967% 4312879% 38246155% 8898457% 644003%
Note: ( ): percentage in the FY
annually , < >: percentage of growth in each period, the
underlined
number: percentage growth over the whole period, but the author disregards inflation factor
Table 2. Province Budget Typology (in billion Rp.) Year Core Budget Bureau Budget Program Budget Total Expenditure Personnel Expenditure Goods and Services
Capital Expenditure Unpredicted Expenditure Subsidies Expenditure Interest Expenditure Social Assistance
Revenue Sharing Expenditure
Grants Expenditure Financial Assistance 2004 11850 8904 11558 442 0 40 1838 5339 752 2915 43638 (27%) (20%) (26%) (1%) (0%) (0%) (4%) (12%) (2%) (7%) 2005 12995 9822 12203 348 0 35 2216 7974 940 2667 49200 (26%)<10%> (20%)<10%> (25%)<6%> (1%)<-21%) (0%)<0%> (0%)<-13%> (5%)<21%> (16%)<49%> (2%)<25%> (5%)<-9%> <13%> 2006 16787 13053 18163 479 4 41 2624 9456 1193 2986 64786 (26%)<29%> (20%)<33%> (28%)<49%> (1%)<38%> (0%)<400%> (0%)<17%> (4%)<18%> (15%)<19%> (2%)<27%> (5%)<12%> <32%> 2007 19650 14733 19566 246 91 20 4460 9948 640 6588 75942 (26%)<17%> (19%)<13%> (26%)<8%> (0.32%)<-49%> (0%)<2175%> (0%)<-51%> (6%)<70%> (13%)<5%> (1%)<-46%> (9%)<121%> (100%)<17%> 2008 22038 18943 18897 207 60 27 4671 10596 5386 7785 88610 (25%)<12%> (21%)<29%> (21%)<-3%> (0.23%)<-16%> (0.07%)<-34%> (0.03%)<35%> (5%)<5%> (12%)<7%> (6%)<742%> (9%)<18%> <17%> 2009 24527 23412 24247 197 11 6 11 4254 11977 2950 10183 101874 (24%)<1 1%> (23%)<24%> (24%)<28%> (0.2%)<-5%> (0.1%)<93%> (0.01%)<-59%> (4%)<-9%> (12%)<13%> (3%)<-45%> (10%)<31%> <15%) 2010 27363 26992 25339 150 65 9 3627 13628 4428 10552 112153 (24%)<12%> (24%)<15%> (23%)<5%> (0.13%)<-24%> (0.6%)<-44%> (0.01%)<-18%> (3%)<-15%> (12%)<14%> (4%)<50%> (9%)<4%> <10%> 201 1 24826 33657 26333 191 40 15 4008 17301 7369 12842 126582 (20%)<-9%> (27%)<25%> (21%)<4%> (0.15%)<27%> (0.03%)<-38%> (0.01%)<67%> (3%)<1 1%> (14%)<27%> (6%)<66%> (10%)<22%> <13%> 2012 33846 41370 29970 236 27 26 1402 20956 33609 18004 179446 (19%)<24%> (23%)<23%> (17%)<14%> (0.13%)<24%> (0.02%)<-33%> (0.01%)<73%> (1%)<-65%> (12%)<21%> (19%)<356%> (10%)<40%> <39%> 2013 36467 49557 36569 202 26 36 2267 22612 35964 20048 203748 (18%)<8%> (24%)<20%> (18%)<22%> (0.1%)<-14%> (0.02%)<-4%> (0.01%)<38%> (1%)<62%> (1 1%)<8%> (18%)<7%> (10%)<1 1%> <14%> 2014 38141 51521 36839 168 32 45 1641 31843 33018 26086 219334 (17%)<5%> (23%)<4%> (17%)<1%> (0.08%)<-17%> (0.01%)<23%> (0.02%)<25%> (1%)<-28%> (15%)<41%> (15%)<-8%> (12%)<30%> <8%> 2015 51793 62566 57944 681 981 11 3 3404 36877 37840 26772 278971 (19%)<36%> (22%)<21%> (21%)<57%> (0.2%)<305%> (0.4%)<2966%> (0.04%)<151%> (1.2%)<107%> (13%)<16%> (14%)<15%> (10%)<3%> <27%> 337% 603% 401% 54% -* 183% 85% 591% 4932% 818% 539%
Note: ( ): percentage in the FY
annually , < >: percentage of growth in each period, the
underlined
number: percentage growth over the whole period, but the autho
r disregards inflation factor