1
Chapter One
Introduction
1.1. General Background
“When the sun began to set on Europe’s foreign empires, and former colonies across the globe began in the 1960s to prepare themselves for independence, nobody was that worried about Africa. The anxiety was all for Asia. After all, Africa was a place of great mineral riches and vast agricultural fecundity. Asia, by contrast, seemed to have only problems and population” (Tony Blair‟s Commission for Africa, 2005:16).
That was barely four decades ago. At the time of their independence in the 1950s and 1960s, the level of economic development in most of Sub-Saharan Africa (SSA) was fairly comparable with that of East Asia. In fact, in the 1960s, much of the expectation was for SSA to perform better than East Asia because of its large endowments of natural resources. As a matter of fact, in the early 1970s, many countries in Africa could point to significant progress in initiating a process of economic and social development. Some degree of industrialization had been initiated, levels of school enrolment had increased, new roads had been constructed, the indigenization of the civil service had advanced, and so forth. Furthermore, up to 1975, much of the investment in SSA was financed with domestic savings; thus, savings and investment during the period were relatively highly correlated (Mkandawire and Soludo, 1997).
Unfortunately, despite its enormous potential and good start at the beginning, African development that was promising in the 1960s and early 1970s was not sustainable and suffered a huge set-back due to structural, institutional, political, and policy constraints that will be thoroughly discussed in this thesis. Today Africa is the poorest region in the world and the only continent whose economy is stagnating. Half of the population lives on less than one dollar a day. Life expectancy is actually falling. People live, on average, to the age of just 49. In contrast, from 1975 to 2000, GDP per capita in East Asia tripled or quadrupled while life expectancy rose from 54 years to nearly 70 years (ADB 2001).
As African economies stagnated and even retrogressed in some cases during the last 30 years, most of the countries in East Asia recorded phenomenal economic success and rapid structural transformation from producing and exporting low-valued added primary commodities to high value-added and high-tech economic activities. In SSA, real GDP growth experienced a general decline from about 3% in the late 1970s to about 1% in the following decade recovering only slightly in the 1990s to about 2.1% (Lawrence and Thirtle, 2001; World Bank, 1998). On the other hand, for the rapidly growing East Asian
2 economies per capita income growth has been 7.8% and 9.9% in the 1980‟s and 1990s, respectively (World Bank, 1998; Masware, 2006).
Hence, the East Asian economies1 have achieved a sustained and rapid growth in per capita income, undergone structural change on their economies and diversified their economic base over the last four decades. On the contrary, countries in SSA experienced severe stagnation in the levels of per capita income, extreme poverty and trade volatility as a result of too much dependency on the export of few primary commodities. Accordingly, the annual growth in real GDP per capita of SSA averaged about 0.44% over the period 1975-2004, compared to about 4.1% for East Asian economies during the same period. Although there are considerable differences among the East Asian economies, as a group they consistently outperformed other developing regions since the 1960s, and their achievement has attracted the attention of policy makers everywhere. In other words, East Asia became an undisputed development success and the most dynamic region in the world in its speed of industrialization while SSA remained the poorest and the most marginalized continent in the world.
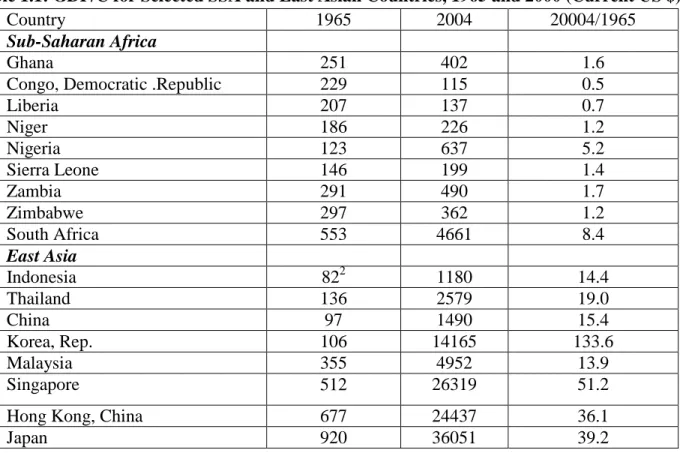
Therefore, the development experiences of East Asian countries are relevant for Africa today, because these countries at their early stages of development shared certain similarities with many African countries. For instance, four decades ago, the per capita income of South Korea was comparable with that of the Sudan in Africa. However, since the 1960s, South Korea has achieved an incredible record of growth to become one of the 26 richest countries in the world and was able to join the trillion dollar club of world economies in 2004 while the Sudan is still one of the 33 Least Developed Countries (LDCs) in sub Saharan Africa (Okafor, 2009). Accordingly, starting from a quite similar per capita income in the early 1960s, East Asia and SSA have experienced a divergent development path and outcome. The growing divergence in income per capita for selected East Asian and SSA countries is clearer in table 1.1 below.
In 1965, for instance, the Korea Republic, China and Thailand had incomes per capita of $106, $97 and 136, respectively, lower than most of SSA countries listed in table 1.1 such as Congo Democratic Republic, Ghana, Niger, Sierra Leone, Liberia, Zimbabwe and Zambia. However, in 2004, Korea, China, and Thailand registered a per capita income of $ 14,165, $1490, and $2,579, respectively. In the same time span, however, Ghana, Niger, Sierra Leon, Zimbabwe and Zambia managed to increase their per capita income only from $251, $186, $146, $297, and $291 to $402, $226, $199, 362, and $490, respectively. In fact, Congo Democratic Republic and Liberia didn‟t even maintain the income per
1
The 10 East Asian economies are China, Hong Kong, Taiwan, Indonesia, Japan, Korea, Malaysia, the Philippines, and Thailand. Japan is included because it made the transition to high-income status in the past four decades.
3 capita they had four decades before and went down from an income per capita of $ 229 and $ 207 in 1965 to $115 and 137 in 2004 respectively.
By the same token, South Africa which is regarded as the best economy in Africa and Singapore in East Asia had an income per capita of $553 and $512 in 1965 respectively, which were fairly higher than almost all East Asian economies except Japan and Hong Kong. In 2004 however, South Africa registered a per capita income of $4,661 whereas Singapore achieved an income per capita of $ 26,319 which was 51.4 times its income per capita of 1965. In other words, Singapore performed almost 5.6 times the performance of South Africa in the same time span. It is also worth to mention Indonesia, which was once considered as one of the poorest countries in East Asia in 1970 with an income per capita of only $82. In 2004 however, Indonesia emancipated itself out of the quagmire of under-development and boosted its income per capita up to $1,180, which was almost 14.4 times the level of its income per capita of 1970.
Figure 1.1 also indicates how SSA and East Asia diverged in income per capita since the 1970s after having more or less the same beginning in the 1960s.
Table 1.1: GDP/C for Selected SSA and East Asian Countries, 1965 and 2000 (Current US $)
Country 1965 2004 20004/1965
Sub-Saharan Africa
Ghana 251 402 1.6
Congo, Democratic .Republic 229 115 0.5
Liberia 207 137 0.7 Niger 186 226 1.2 Nigeria 123 637 5.2 Sierra Leone 146 199 1.4 Zambia 291 490 1.7 Zimbabwe 297 362 1.2 South Africa 553 4661 8.4 East Asia Indonesia 822 1180 14.4 Thailand 136 2579 19.0 China 97 1490 15.4 Korea, Rep. 106 14165 133.6 Malaysia 355 4952 13.9 Singapore 512 26319 51.2
Hong Kong, China 677 24437 36.1
Japan 920 36051 39.2
Source: World Development Indicators Database
2
4 Figure 1.1: Income per capita in SSA and East Asia (1975-2004)
Likewise, as shown in table 1.2, SSA‟s share in world exports fell from about 3.7% in 1980 to 1.5% in 2002, while East Asia‟s share in world exports increased from 17.9% to 23.3% in the same period. Similarly, Sub-Saharan Africa‟s share in world imports fell from 3.1 % in 1980 to 1.4% in 2002, while East Asia again increased its world import share from 13.1% to 20.8% in the same time span.
Table 1.2: Shares of SSA and East Asia in World Merchandize Trade, 1980-2002
Year Export Import
World East Asia SSA World East Asia SSA
1980 100 17.9 3.7 100 13.1 3.1 1985 100 15.6 2.5 100 15.2 2.1 1990 100 16.9 1.9 100 15.9 1.6 1995 100 21.6 1.5 100 21.9 1.6 2000 100 24.3 1.5 100 21.1 1.3 2002 100 23.3 1.5 100 20.8 1.4
Source: UNCTAD Hand Book of Statistics, UNCTAD database
In line with this, though many developing regions, particularly East Asians have been transformed from exporters of primary products to manufactured products in the last three decades, Africa hardly benefited from the boom in manufactured exports. Standing at around 30 per cent in 2000, the share of manufactured exports in the continent‟s total merchandise exports had increased by only 10 percentage points compared to 1980. The continent‟s share in world merchandise exports fell from 6.3 per cent in 1980 to 2.5 per cent in 2000 in value terms (Table 1.3).
GDP/C 0 5000 10000 15000 20000 25000 30000 35000 B en in B ur k-Fa so B ur un di C en tra l A fri ca R ep . C on go D R C on go R E th io pi a G ab on G am bi a M au rit iu s N ig er R w an da S en eg al S ou th A fri ca Ta nz an ia U ga nd a Zi m ba bw e H on g K on g In do ne si a K O R E A R E P U B S in ga po re Ta iw an GDP/C
5 Similarly, Africa‟s share of total developing-country merchandise exports fell to almost 8 per cent in 2000, only a third of its value in 1980, while the share of world manufactured exports remained a little below 1 per cent. In contrast, East Asia‟s performance has been important with respect to both total merchandise exports and manufactures. Its share of global merchandise exports increased from 18 per cent in 1980 to 22 per cent in 2000, while its share of total developing-country merchandise exports increased from almost 60 to 72 per cent over the same period. Similarly, its share in global manufactures trade increased threefold, reaching 21.5 per cent in 2000 (Table 1.3). The value of East Asia‟s total exports recorded 7 per cent average annual growth over the period under review, compared to a mere 1 per cent for Africa.
Table 1.3: Export Structure of Africa and East Asia by Product Category, 1980 and 2000
Region 1980 2000
All Merchandise3 Manufactures4 All Merchandise Manufactures Africa share in:
Global exports 6.3 0.8 2.5 0.8
Developing Countries 20.3 7.8 7.9 3.0
Developing Asia share in:
Global exports 18.1 7.1 22.4 21.5
Developing Countries 58.5 66.9 72.0 79.0
Source: UNCTAD (2003)
Among all developing regions in the world, it is Africa that has the lowest share of manufacturing exports to total merchandise exports as shown in figure 1.2; whereas, East Asia has achieved a radical economic structural change and becomes “center of excellence” in manufacturing within the developing world.
3
This refers to standard International Trade Classification (SITC) 0–9.
4
6
Figure 1.2: Developing Regions' shares of Manufacturing to Total Exports, 2002-2006
Source: UNCTAD (2008a)
Figure 1.3 below further demonstrates how the manufacturing sectors in SSA and East Asia experienced two extremes measured in terms of share of manufacturing value added to GDP.
Figure 1.3: Manufacturing Value Added in SSA and East Asia, 1975 and 2004
What is more important is that the ratio of exports to GDP increased continuously in all East Asian countries in the past four decades as shown in table 1.4. It is salient, for example, how Thailand increased its ratio of exports to GDP from 13% to 16%, to 21% and to 31 and finally to 52 %.
Developing Regions' shares of Manufacturing Exports to total Merchandise Exports, 2002-2006
0 10 20 30 40 50 60 70 80 90 100
Africa East Asia South
Asia Latin America Re gion Sha re (% ) Share
Manufacure Value added in SSA and East Asia
0 10 20 30 40 50 60 70 80 Burk inafa so Came roon Cong oDR Cong o R. Ethio pia Ghan a Keny a Maur itius Nige ria S. A frica Ugan da Zimba bwe China Indon esia Kore a R. Malay sia Philip pines Sing apor e Thail and Countr y Sh ar e of M VA D to G D P 2004 1975
7 Table 1.4: Increases in Exports with Respect to GDP in East Asian Countries (in %)
Exp/GDP Period 1961-70 1971-80 1981-90 1991-97 1998-2001 China N/A 5.6 10.3 19.1 20.6 Hong Kong 55.6 64.1 90.0 116.8 114.6 Korea 5.5 22.8 30.9 25.1 37.5 Singapore 105.9 113.1 138.4 135.0 140.8 Indonesia 11.1 23.1 22.7 23.2 42.1 Malaysia 42.9 44.2 53.3 75.3 104.2 Thailand 13.8 16.3 21.6 31.6 52.4 Philippines 11.4 15.4 16.4 22.5 48.2
Source: Sandee and Wengel (2004)
Generally, the value-added export oriented activities that have driven many dynamic developing economies are conspicuously absent in SSA. Linkage between local industries remains minimal and mostly superficial. The technological level of the existing industrial activities remains generally low. Likewise, the average ratio of manufactured exports to total exports in East Asia has been recorded as 70.1%, while it was only 14.6% for SSA. Similarly, the average number of exports goods from East Asia has reached about 202 items, while it stands at about 64 items for SSA (Table 1.5).
Table 1.5: Export Structure and Growth Performance of SSA and East Asia, 1975-2004
Description SSA East Asia
Number of Export Goods 64 202
Share of Manufactured Exports to Total Exports (%) 14.6 70.1
Growth in Exports (%) 4.8 9.4
Growth in Real GDP per Capita (%) 0.44 4.1
GDP per Capita 1669.4 8070.7
Source: Own Calculation based on data from WDI for countries listed in table 1.10
Despite Africa‟s huge natural resources endowment and abundant cheap labor force, FDI inflow to Africa is extremely low compared to other regions of the developing world. For instance, table 1.6 below indicates that SSA‟s share of the global FDI in 2005 is only 1.8 % compared with East Asia‟s 16.2% of the same. Moreover, SSA‟s FDI inflows continued to be geographically concentrated in a few countries such as South Africa, Nigeria, Angola and Sudan. Of course, SSA‟s share of the world total FDI has increased from 0.5 % ($ 6.3 billion) in 2000 to 1.6 % ($ 17.2 billion) in 2005. This was partly attributed by the policy measures undertaken in many African countries in adopting new laws and measures to attract more FDI, which continues to gain in importance in international economic transactions and as an instrument of international economic integration.
8 Table 1.6: FDI Inflow to SSA and East Asia (in billion’s current US $)
Year FDI Inflow in billion‟s US$ Shares in (%)
World East Asia SSA World East Asia SSA
2000 1518.7 141.4 6.8 100 9.3 0.5 2001 794.8 98.4 14.2 100 12.4 1.8 2002 737.6 88.3 10.2 100 12 1.4 2003 641.6 92.3 13.0 100 14.4 2 2004 751.7 141.8 10.7 100 18.9 1.4 2005 1116.9 163.1 17.2 100 14.6 1.5
Source: Own calculation based on World Indicators Online
East Asia‟s success on one hand and SSA‟s low performance on the other hand raise some crucial questions: Was the nature of the policy package in East Asia very different from Sub-Saharan Africa? Were the effects of government interventions very different in East Asia? What might account for these differences between East Asia and Sub-Saharan Africa? In considering these questions, this thesis critically examines the factors explaining the gap between the East Asian and SSA performance based on theoretical and empirical approaches. Indeed, while at the beginning of this period the industrial base of the economies in this region was small, they transformed into industrialized countries within a relatively short period of time. What accounts, then, for the growth miracles in East Asia? Some economists argue that their rapid growth is explained by their ability to imitate foreign technologies. By adopting technology developed abroad, these countries managed to improve their production functions substantially in a short period of time. In other words, these countries achieved a very rapid growth in total factor productivity (TFP). On the other hand, recent studies revealed that their exceptional growth can be traced to large increases in measured factor inputs: increases in labor-force participation, increases in the capital stock, and increases in educational attainment (Mankiw, 2003:234). However, although countries in East Asia had higher investment rates than others, they had also a spectacular productivity growth far better than other developing countries (Thomas and Wang, 1997).
Overall, East Asia's success was attributed to: (i) mobilization of domestic savings for investment including human capital and physical infrastructure; (ii) a large FDI inflow appropriately used as an alternative source of foreign currency and a big factor in capital formation; (iii) shifting resources from less productive sectors to more productive sectors (vertical diversification); (iv) export-led growth, especially the rapid growth of manufactured exports; (v) stable macroeconomic and institutional environments instrumental in creating confidence among policy makers (World Bank, 1993; Stiglitz et al, 2006) ; and (vi) Japan‟s role as a leader in East Asian development (Kwan, 1998).
9 On the other hand, Sachs et al. (2004) have identified the main factors contributing to SSA`s weak economic performance and poverty as: (i) a level of physical and human capital so small that it fell below the threshold needed to start modern production; (ii) very low levels of savings; (iii) high rates of population growth; (iv) a very low rate of diffusion of technology from abroad; (v) unfavorable economic policies; (vi) narrow based economies; and (vii) the absence of a strong economy to take the lead/absence of a leading goose that may lead the flocks in the continent (the concept of the flying geese model will be discussed in detail in chapter 2). Furthermore, it was a well known fact that the macro-economic policies followed by most of the SSA countries until the 1990‟s were unfavorable to macro-economic growth: Imports and exports subject to severe restrictions and under state ownership or control; high walls of tariffs and export taxes that restricted international trade; over-valued exchange rates; wide margins for marketing parastatals; and price and quantity controls that were aimed primarily at reducing food prices for urban consumers.
One of the most remarkable features of growth in most East Asian countries is that it was accompanied by rising economic equality (Gerber, 2005). Since the pioneering 1950s work of the economist Simon Kuznets, it was thought that growth in developing countries would first result in falling economic equality, followed later by rising equality (a U-Curve relationship between income and equality).While Kuznet‟s work was based on measurements from a large number of countries, the East Asian experience has called into question the idea that economic growth in developing countries follows a “Kuznet‟s curve,” in which equality first declines and then rises. Although the conditions that led to greater income equality were rooted in the unique historical experiences of each country, it is also evident that each of the East Asian countries had a similar set of highly visible wealth-sharing mechanisms such as land reform, free public education, free basic health care, and significant investments in rural infrastructure.
For instance, according to Leipziger and Thomas (1997:6), large land reform schemes in both Korea and Taiwan eradicated the landholding classes and made wage income the major source of advancement. In fact, in Taiwan and Korea, land was a scarce asset, and both regimes were prescient in redistributing land to small farmers. These rural constituencies are still government supporters. Again, Korea managed, over the 1965-85 period, to close the gap between urban and rural incomes. Special rural development programs such as the Saemaul Movement, agricultural price supports, and a relatively large rural investment program were prominent features of Korean development. Similarly, public housing investments in Singapore and Hong Kong were early priorities of governments bent on maintaining a national consensus on development policies. For instance, in Singapore, early support and trust were built on the housing policies led by the Housing and Development Board. Through its efforts, begun during the First Five Year Plan, public housing construction was one of the plan‟s top priorities. As a result, owner-occupied housing rose from less than 10 percent in 1970 to 80 percent in 1980
10 (Leipziger and Thomas, 1997:25). These policies didn‟t equalize income by themselves, but they provided people with the tools they needed to raise their individual incomes and gave hope for the future.
Nevertheless, it doesn‟t mean that all East Asian countries have experienced economic growth accompanied with relative income-equality. There are some cases such as China where income inequality has risen rapidly in the past decades across regions, between rural and urban sectors, and within provinces. The largest gains in China have been registered by the leading coastal areas. Even within urban areas, growth in inequality has been fueled by the declining role of subsidies and entitlements, the increase in wage inequality and the layoffs during restructuring.
For all regions, however, it is Africa where income is most unequal as measured by a Gini coefficient of 0.51 (Table 1.7). Uneven distribution of income in turn has perpetuated poverty and alienation in SSA. Increasing income inequality in Africa is mainly caused by concentration of the handful of economic establishments including the few industrial plants and modern infrastructure in one or two urban conglomerations. Inequality has existed not only along lines of region, class, and ethnicity, but also gender and hence modern formal sector employment in Africa has continued to be a largely male domain (Mkandawire and Soludo, 1999). Moreover, where regions were conterminous with ethnicity, uneven development could only fan the flames of ethnic conflicts.
The success of East Asian countries in shifting from producing low productive primary commodities to more productive manufactured products reflects the fact that even latecomers are able to specialize in high growth areas if some of the pre-conditions are fulfilled. Thus, as Masuyama and Vandenbrink (2001) noted, unless a country diversifies into critical supporting industries, the development of few industries alone will not produce growth in the economy.
Table 1.7: Income Inequality Measures by World Regions Region Gini Coefficient Share of top 20 % Share of Middle
Class
Bottom 20 %
Africa 0.51 50.6 34.4 5.2
East Asia and Pacific 0.38 44.3 37.5 6.8 South Asia 0.32 39.9 38.4 8.8 Latin America 0.49 52.9 33.8 4.5 Industrialized Countries 0.34 39.8 41.8 6.3
Source: Deininger and Squire (1996)
Nevertheless, Sub-Saharan African countries have still remained dependent on export earnings from a narrow base of a few agricultural and mineral commodities for foreign exchange earnings (Table 1.8)
11 and have had to endure the consequences of all the problems resulting from the fluctuation of commodity prices in world markets. About 17 of the 20 most important export items of Africa are primary commodities or resource-based semi-manufactures.
In 1965 for instance, primary products accounted for 92% of Africa‟s exports, and in 1988 it was still 88%. On average, world trade in these products has been growing much less rapidly than manufactures. In fact, world trade in other primary commodities that account for an important proportion of total exports of Africa, particularly agricultural products such as coffee, cocoa, cotton and sugar, has been sluggish, with the average growth of trade in such products in the past two decades barely reaching one-third of the growth rate of world trade in all products (UNCTAD, 2003). World prices for many of the commodities that Africa exports declined between 1990 and 2000: cocoa, cotton, sugar and copper declined by over 25%, coffee by 9% and minerals overall by 14% (WTO, 2001). As noted by Ng and Yeats (2002), one-half of the traditional products in SSA experienced average price changes of 50 % or more during the 1990‟s.
Theoretical analysis suggests that agricultural commodity prices fall relative to manufacturing products because of relatively inelastic demand and because of the lack of differentiation among producers. More specifically, primary commodities have both a low price and income elasticity5 of demand which means that when supply increases, prices can drop dramatically, and demand grows only slowly with income growth. Indeed, during the past three decades the share of agricultural products in global merchandise exports has more than halves falling from about 18 per cent in 1970 to less than 8 per cent in 2000 (Razzaque et al., 2007). Apart from this, primary products are land-based activities and subject to diminishing returns, and there is a limit to employment in diminishing returns activities set at the point where the marginal product of labor falls to the minimum (subsistence) wage (Thirlwall, 2003).
On the demand side, the development of synthetic substitutes further displaces agricultural commodities as intermediate inputs, reducing the growth in demand. This drastic decrease of the SSA presence in world trade was not only the result of the deterioration of the terms of trades (due to low income elasticity of demand) in primary commodities, but also of the loss of competitiveness in manufactures.
5
Price elasticity of demand is the measure of responsiveness in the quantity demanded as a result of change in price of the same commodity. Similarly, income elasticity of demand measures the responsiveness of the demand of a good to the change in the income of the people demanding the good.
12 Table 1.8: Main Exports of Selected Sub Saharan Africa Countries
COUNTRY EXPORTS
Angola Oil, Diamonds, Minerals, Coffee, Fish, Timber
Benin Cotton, Palm oil
Botswana Diamonds, Copper, Nickel, Beef Burkina Faso Cotton, Animal Products, Gold Burundi Coffee, Tea, Sugar, Cotton, Hides Chad Cotton, Oil, Livestock, Textiles
Congo, Dem. Rep Diamonds, Copper, Coffee, Cobalt, Crude oil
Congo, Rep. Oil, Timber, Plywood, Sugar, Cocoa, Coffee, Diamonds Cote d‟Ivoire Cocoa, Coffee, Tropical woods, Petroleum
Equatorial Guinea Petroleum, Timber, Cocoa
Ethiopia Coffee, Hides, Oil seeds, Beeswax, Sugarcane Gabon Crude Oil, Timber, Manganese, Uranium
Kenya Tea, Coffee, Horticultural products, Petroleum products
Mali Cotton, Gold, Livestock
Mauritius Sugar, Clothing, Tea, Jewellery
Niger Uranium, Livestock products
Nigeria Petroleum, Petroleum products, Cocoa, Rubber Rwanda Coffee, Tea, Hides, Tin ore
Senegal Fish, Peanuts, Petroleum products, Phosphates, Cotton South Africa Gold, Diamonds, Metals & Minerals, Cars, Machinery Sudan Oil, Cotton, Sesame, Livestock & Hides, Gum Arabic Zambia Copper, Minerals, Tobacco
Source: Osakwe (2007)
Consequently, Africa is the region that has the highest export concentration index in the world followed by South Asia while East Asia is one of the leading regions next to the developed economies that have the lowest export concentration index as shown in figure 1.4 below. Thus, it is not surprising to note that SSA is the most affected region from the adverse effects of export earnings instability that led the region to further under-development.
13 Figure 1.4: Export Concentration Index by Regions/Economies of the World, 2006
Source: UNCTAD (2008a)
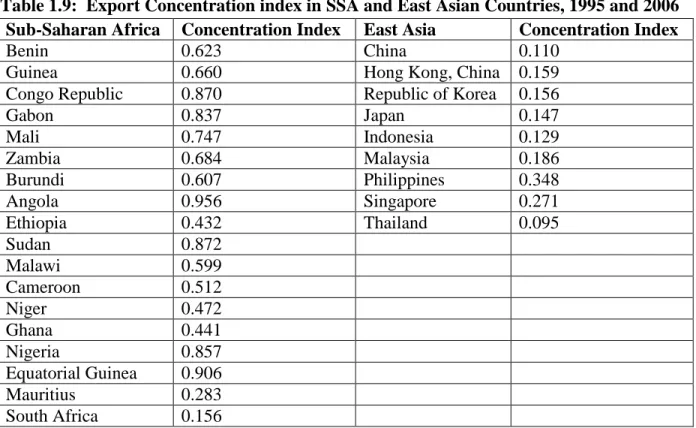
It is evident from table 1.9 and figure 1.5 that export concentration in SSA is very high while it is very low in East Asian countries. Indeed, it is obvious that such high export concentration in a few commodities (low diversification) in Sub-Saharan Africa was one of the root causes of the region‟s poor economic performance compared to other developing regions of the world. Hence, as Pinaud and Wegner (2004) noted, African economies still lack proper “shock-absorbers” to withstand internal (e.g. drought, floods, and political instability) and external (e.g. volatility of commodity prices and exchange rates) shocks alike. Even at the time of writing, Africa‟s relatively better economic growth rates for the last few years which were fuelled by the large increases in commodity prices suddenly crashed in late 2008. For instance, oil price which surged past $140 in early 2008stood below $40 per barrel at the end of 2008. This was also true for the price of copper and cobalt which were around one-third of their recent peak (Herbst and Mills, 2009). As a result, various development projects may be discontinued and economic growth in many parts of SSA may be massively slashed.
Though the recent worldwide financial crisis is partially responsible, African governments are not without blame. As Herbst and Mills (2009:2) noted, “the commodity boom produced something akin to the proverbial seven fat years for some African countries. But there was very little effort to diversify production while the going was good.” Thus, this situation provides a wake-up call to SSA policy makers to re-evaluate the economic strategies and policies they have followed in the past with little achievement. Accordingly, the capacity for smoothing shocks depends mainly on the ability of African policy makers to diversify their economies. By the same token, the Economic Report on Africa (ERA) 2004 argues that a very serious improvement is required in internal conditions, especially on the supply side, if the continent is to improve its position in the international economy. Furthermore, the Economic Report on Africa (2007) presents the theme of diversification as a new paradigm for Africa‟s
0 0.05 0.1 0.15 0.2 0.25 0.3 0.35 0.4 Developed Economies Developing Economies
Africa South Asia Latin
America
East Asia
14 development and the report argues that diversification is a prerequisite to achieving positive development in the continent.
Table 1.9: Export Concentration index in SSA and East Asian Countries, 1995 and 2006 Sub-Saharan Africa Concentration Index East Asia Concentration Index
Benin 0.623 China 0.110
Guinea 0.660 Hong Kong, China 0.159
Congo Republic 0.870 Republic of Korea 0.156
Gabon 0.837 Japan 0.147 Mali 0.747 Indonesia 0.129 Zambia 0.684 Malaysia 0.186 Burundi 0.607 Philippines 0.348 Angola 0.956 Singapore 0.271 Ethiopia 0.432 Thailand 0.095 Sudan 0.872 Malawi 0.599 Cameroon 0.512 Niger 0.472 Ghana 0.441 Nigeria 0.857 Equatorial Guinea 0.906 Mauritius 0.283 South Africa 0.156
Source: UNCTAD Hand Book of Statistics, 2008
Figure 1.5: Export Concentration Index in SSA and East Asian Countries, 2006
Export Concentration Index in Sub-saharan Africa and East Asia
0 0.2 0.4 0.6 0.8 1 1.2 Be n in G u in e a C o n g o G a b o n M a li Z a m b ia Bu ru n d i An g o la Et h io p ia Su d a n M a la w i C a m e ro o n N ig e r G h a n a N ig e ri a Eq u a to ri a l M a u ri ti u s U g a n d a Z im b a b w e Ke n y a Se n e g a l So u th C h in a H o n g R e p u b li c J a p a n In d o n e s ia M a la y s ia Ph il ip p in e s Si n g a p o re T h a il a n d Country C o n c e n tr a ti o n I n d e x Concentration Index
15 In the light of these considerations, the aim in this thesis is, therefore, to thoroughly examine how and why export diversification policy plays a critical role in such situations. More specifically, this thesis is intended to examine the role of policy, institutional, and political factors on export diversification and thereby economic growth. The study assumes that lack of physical and human capital, weak physical infrastructure, and poor trade facilitation services together with other policy, political and institutional constraints have posed major impediments to export diversification, economic transformation and growth in Sub-Saharan Africa. Towards this, this study uses panel data from 41 countries from East Asia and SSA for the period 1975 to 2004. The lists of countries included in this study are shown in table 1.10 and the selection criterion was mainly the availability of complete data throughout the study period. Table 1.10: List of Countries Icluded in the Study
Sub-Saharan Africa East Asia
Benin, Burkina-Faso, Burundi, Cameroon, Central Africa Republic, Chad, Congo Democratic Republic, Congo Republic, Cote Devoir, Ethiopia, Gabon, Gambia, Ghana, Kenya, Madagascar, Malawi, Mali, Mauritania, Mauritius, Mozambique, Niger, Nigeria, Rwanda, Senegal, Seychelles, Sierra Leone, South Africa, Sudan, Tanzania, Uganda, Zambia, and Zimbabwe
China, Hong Kong, Indonesia, Japan, Korea Republic, Malaysia, Philippines, Singapore, Taiwan, and Thailand.
However, from the outset it should be noted that diversification is one of the key measures for structural solution‟s not a panacea for SSA‟s deep rooted economic problems (De Ferranti et al, 2002). In line with this, the study will examine and assess export diversification based on its vertical and horizontal dimensions as defined below.
1.2. Defining Vertical and Horizontal Export Diversification
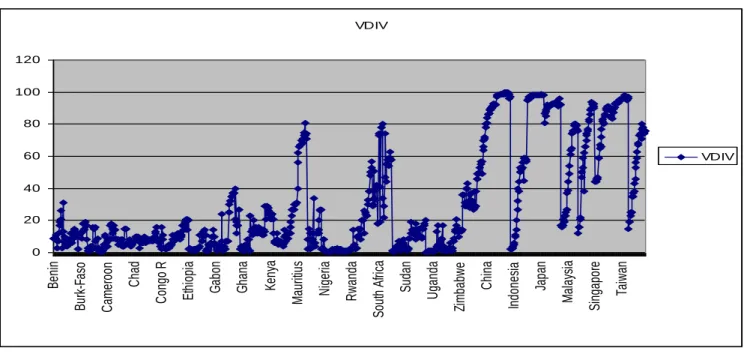
There are two well-known forms/dimensions of export diversification from the supply side that may take place in developing countries, namely, horizontal and vertical diversification. Matthee and Naude (2007) define horizontal export diversification as an increase in the number of export sectors, and vertical diversification as a shift in the composition of exports from primary to manufacturing products. Thus, horizontal diversification can be materialized through (i) a larger mix of diverse and complementary activities within agriculture; and (ii) a movement of resources from low value agriculture to high value agriculture. On the other hand, an economy is said to be vertically diversified if and only if that country starts processing and exporting value-added products from commodities that would have previously been exported in raw form. Thus, vertical diversification involves a radical change in export structure and export of innovative products by means of value-added ventures such as processing and marketing. Likewise, vertical diversification can also be linked to better learning
16 possibilities that, in turn, may produce greater dynamic externalities than horizontal diversification. In other words, through forward and backward linkages, production of a diversified export structure is also likely to provide a stimulus for the creation of new industries and expansion of existing industries elsewhere in the economy (Hirschman, 1958).
While both horizontal and vertical diversification are targeted at attaining three interrelated objective; stabilizing earnings, expanding export revenues, and upgrading value added; requirements for the two may vary considerably in terms of technological, managerial and marketing skills. Accordingly, vertical integration may require more advanced technology, skills and initial capital investment than horizontal diversification. Hence, significant amount of investment in human capital through education and a high rate of physical capital formation either by raising domestic savings or through FDI are pre-requisites for a country to achieve vertical diversification. Most often, vertical diversification occurs when a country starts processing commodities that were previously exported in raw form (Cramer, 1999). For-example, vertical diversification takes place by moving up the value chain to produce manufactured products as seen in Korea, China, and Malaysia. This, therefore, put into question the policy advice of some researchers such as Ownes and Wood (1997) who proposed that Africa‟s emphasis should be on horizontal diversification through increasing the number of primary export products. On the other hand, horizontal diversification is achieved by producing non-traditional exports such as cut flowers that have started to be produced in Kenya, Uganda and Ethiopia to supplement or partially replace the traditional exports like coffee and tea. The goals, dimensions and forms of export diversification are clearly shown in table 1.11 below.
Table 1.11: The Goals, Dimensions and Forms of Export Diversification at Country Level
Dimension/Goal Stability-Oriented Growth-Oriented
Based on existing commodities Add new commodities Based on existing commodities Add new commodities Horizontal Diversification
Adjust export shares based on co-variation of export earnings from individual commodities Add new commodities based on co-variation of export earnings from individual commodities. Adjust export shares based on growth rates of export earnings from individual commodities. Add new commodities based on growth rates of world prices and market niche. Vertical Diversification
Adjust export shares based on a
commodity‟s ability to be marketed in raw or processed forms in both international and domestic markets.
Add new
commodities based on their flexibility to be marketed in raw and processed forms, and to serve international and domestic markets. Introduce or expand value-added activities and import substitution. Choose new commodities based on value-added and import substitution potential. Source: Ali, Alwang and Siegel (1991)
17 1.3. Statement of the Problems
Over the past thirty years, most developing regions, especially East Asia have diversified their exports both vertically and horizontally, and achieved very significant and dynamic structural changes in the economy. Nevertheless, SSA is not part of this transformation and most of the countries in this region have still remained dependent on export earnings from a narrow base of a few agricultural and mineral commodities for foreign exchange earnings and have had to endure the consequences of all the problems resulting from the fluctuation of commodity prices in world markets. This implies SSA economies still lack proper “shock-absorbers” to withstand internal (e.g. drought, floods, and political instability) and external (e.g. volatility of commodity prices and exchange rates) shocks alike. Thus, the capacity of smoothing shocks depends on the ability of African policy makers to diversify their economies.
1.4. Research Objectives
The overall objective of this study is first to illustrate both theoretically and empirically what factors influence vertical and horizontal export diversification across countries and over time for a panel data of 41 countries from South East Asia and SSA and assesses the trends. Next, the study will empirically examine the explicit impacts of vertical and horizontal export diversification on economic growth, and recommend which dimension of export diversification will have strong contribution to growth. The core assumption is that, the development experiences of East Asian countries are relevant for Africa today, because these countries at their early stages of development shared certain similarities with many African countries. In doing so, this study has employed a two-stage (hierarchical) system of regression models which are separately estimated. Hence, this thesis has the following four specific objectives:
(i) It identifies the key factors explaining patterns of vertical and horizontal diversification for East Asian and SSA economies;
(ii) It shows the nexus of relationships between export diversification and economic growth; (iii) It estimates the impact of vertical and horizontal export diversification on economic growth
of the two regions, by taking policy, political and institutional factors into account; and (iv) By identifying the main determinants of export diversification and economic growth both for
East Asia as well as Sub-Saharan Africa, it figures out the specific areas in which the differences occurred and how they were related to particular policy regimes and institutional arrangements, including changes in these over time.
18 1.5. Research Questions
Research questions derived from the above objectives are the following:
(a) What are the main determinants of vertical and horizontal export diversification?
(b) If diversification can have a positive impact on a country‟s growth and development prospects, what are the policy options available to support that process?
(c) Although Africa is undoubtedly endowed with rich natural resources and was at a similar level of economic development to East Asia in early 1960‟s, it is quite evident that the region is the lowest performer among all developing regions in the world while East Asia has been the most dynamic region over the last three/four decades in achieving a high level of vertical and horizontal export diversification, and by extension, structural change in the economy. Why has Africa not diversified out of primary commodities and structurally changed its economy so as to achieve sustainable growth?
(d) Which form of export diversification (vertical or horizontal) can more likely trigger economic growth and given priorities in Africa and why?
(e) Within physical capital, what is the impact of domestic capital and foreign capital on export diversification and growth?
(f) What other factors cause the growing divergence in economic growth over time and across countries in East Asia and SSA?
(g) What is it that East Asian governments have been doing right and which those African governments are failing to accomplish?
(h) Since countries in SSA are heterogeneous in the level of economic, political and social development, what are the levels of export diversification and growth performance of “low-income SSA” and “middle-“low-income SSA” separately?
(i) What are the areas in which SSA countries must pay significant attention to and draw lessons from East Asia‟s development paradigm especially with regard to diversification, economic transformation, and sustainable economic growth?
Thus, in order to address the above research questions, the following propositions/ assumptions have been made and tested in this study; based on the theoretical analysis and literature review presented in chapter 2, chapter 3 chapter 4, and in sub-chapter 5.1, and 6.1.
19 1.6. Research Hypotheses
(a) A higher value of domestic capital and investment on education (human capital) raises the steady-state level of output per effective worker and thus they can positively and significantly induce vertical and horizontal diversification and economic growth;
(b) FDI can increase export diversification and economic growth not only it can be used as an alternative source of capital formation but also through its effect in making domestic companies more efficient and stimulating sectoral and product diversification;
(c) Since the levels of human capital and FDI are below the threshold level in SSA, their contribution to economic growth may not be satisfactory in SSA compared to East Asia;
(d) While vertical and horizontal diversification are both expected to stimulate economic growth, it is however vertical export diversification which may have a more dynamic and strong spillover effect on the economy and contribute more to economic growth;
(e) Natural resource endowment negatively affects economic diversification through the “Dutch Diseases” effect6;
(f) Since the theory of “absolute convergence” and “conditional convergence” predict that poorer countries typically grow faster in income per capita to catch-up with developed countries, it is expected that „initial GDP/capita‟ is inversely related with growth- rate;
(g) Macroeconomic stability such as low inflation rate, openness, and a flexible and stable exchange rate system in a given country may create favorable conditions for export diversification and thereby to economic growth;
(h) Political Instability is inversely related with export diversification and growth due to the fact that rate of saving and investment tends to be low in countries with frequent wars.
1.7. Significance of the Study
(i) Previous studies in this field have mostly treated „export diversification‟ in aggregate forms, but this study is expected to fill the gaps in the literature by examining diversification from its vertical and horizontal dimensions and figure out which one can contribute more to growth. Thus, this study will contribute to the enhancement of knowledge in this area;
(ii) This study is also timely, given the increasing attention being given by African policy makers and UN agencies in their reports such as the Economic Report on Africa (2007) which presents the theme of diversification as a new paradigm for Africa‟s development and claims that it is a prerequisite to achieving positive development in the continent;
6
The “Dutch Disease” was named after the experience of the Netherlands, where increased oil and gas revenues in the late 1950s resulted in the appreciation of the Dutch Guilder and loss of export markets and de-industrialization.
20 (iii) This study decomposes physical capital into domestic and foreign capital and analyzes their separate effects on vertical and horizontal export diversification and economic growth, taking human capital and other relevant variables into consideration. This is also another approach to identify which form of capital (domestic, foreign, or both) is more important and should be given priority in the development process;
(iv) Unlike most of the empirical studies on export diversification that used either conventional cross-sectional country growth analysis without looking at the time effects or a typical time series analysis of a single country without looking at the cross-sectional effects, this study has employs a panel data and attempts to figure out both the cross-sectional country effects as well as the time effects which may cause divergence in income per capita growth over time and across countries.
1.8. Organization of the Thesis
This thesis is divided into seven chapters, including this introduction. Chapter 2 deals with the theoretical framework for the link between export diversification and economic growth;
Chapter 3 examines fundamentals of structural change and the means and sources of economic transformation in East Asia based on perspectives of various schools of thought;
Chapter 4 highlights Sub-Saharan Africa‟s Economic Structure and investigates the various structural, economic, political, institutional and social factors that contribute to SSA‟s weak economic performance;
Chapter 5 deals with the first step of the hierarchical empirical analysis and identifies the main determinants of vertical and horizontal export diversification. Towards achieve this, research methodology and estimation techniques including a model of the factors explaining vertical and horizontal export diversification will be developed. In line with this, the data types and sources together with the empirical results and main findings will be discussed in detail;
Chapter 6 deals with the second step of the hierarchical empirical analysis and examine the explicit impact of vertical and horizontal export diversification on growth in income per capita based on panel data drawn from East Asia and SSA. In doing so, the main determinants of economic growth will be identified based on economic theory and previous empirical work. Besides this, the research methodology and the growth model will be discussed; alternative econometric estimation techniques will be employed; and ultimately the regression results and main findings will be presented.
Chapter 7 finally provides concluding remarks and highlights policy considerations and some avenues for future research.
21
Chapter Two
Theoretical Framework and Previous Empirical Studies on the Nexus of
Relationships between Export Diversification and Economic Growth
The concept of international trade as an engine of “economic growth” and “welfare” dates back to the time of Adam Smith (1723-90). Smith, in his famous book An Inquiry into the Nature and Causes of the Wealth of Nations (1776), stressed the importance of trade as a vent for surplus production and as a means of widening the market, thereby improving the division of labor and raising the level of productivity (Smith, 1776). However, since openness of the 1980s, trade liberalization and outward oriented policies have become popular policy prescriptions among economies and policy makers for achieving economic growth. Parallel to the outward-orientation paradigm, another hypothesis related to structural changes in exports and increased diversification of exports has gained even greater popularity in the literature (e.g. Ali and Siegel, 1991; Amin Gutierrez de Piners and Ferrantino, 1997). Hence, the question that has to be asked is what are the theoretical reasons why export diversification is conducive to economic growth?
Firstly, the traditional argument for export diversification is based on its role in reducing export earnings instability caused by cyclical fluctuation in international commodity prices. Many countries that are dependent on commodities often suffer from export instability arising from inelastic and unstable global demand, so export diversification is one way to alleviate these particular constraints. It is worth to mention here the fundamental theoretical difference between land-based activities, such as agriculture and mining, and industrial activities on the other. According to Thirlwall (2003), land-based activities, which developing countries tend to specialize in, are subject to diminishing returns and produce goods with a low income-elasticity of demand, while industrial activities which developed countries tend to specialize in, are subject to increasing returns and produce goods with a higher income elasticity of demand. The implications of these differences are profound and go a long way to account for the differences in living standards that have arisen between developing and developed countries. On the production side, diminishing returns depresses the level and growth of productivity, and means that there is a limit to the profitable employment of labor in these activities. On the demand side, in a trading environment, a low income elasticity of demand for land-based products compared to industrial products mean that the balance of trade for the countries that produce highly concentrated land-based goods is more likely to deteriorate relative to countries trading industrial products (Thirlwall, 2003). This may implies slower growth in the poor countries relative to the rich, unless relative price changes can act as an efficient balance of payments adjustment mechanism. As a whole, primary product prices are much more cyclically volatile than industrial goods‟ prices. This volatility has, therefore, a number of
22 potentially detrimental consequences for an economy that concentrates only on a few primary products. Firstly, it can lead to a great deal of instability in the foreign exchange earnings and balance of payments which makes investment planning and economic management much more difficult, especially as many developing countries rely heavily on trade taxes for government revenue. Another consequence of volatility is that a collapse of commodity prices can cause severe debt service problems for developing countries that have previously borrowed heavily when prices were higher and export earnings were buoyant. Consequently, a large part of the debt problem faced by debtor countries in Africa and Latin America in the 1980s, which still lingers today, was the result of large falls in commodity prices in the 1980s compared to the 1970s. According to Thirlwall (2003), using 1975=100 as the base, the UN composite price index of 30 primary commodities stood at 166 in 1980, falling to 123 in 1982 and to 116 in 1985. With such falls, there was no way in which debtor countries could service their debts in foreign currency without a vast increase in export volume or a compression of imports. Therefore, because of its impact on domestic demand, export instability could discourage necessary investments in the economy by risk-averse firms, increase macroeconomic uncertainty, and be detrimental to longer term economic growth. Export diversification could therefore help to stabilize export earnings in the longer run (Ghosh and Ostry, 1994; Bleaney and Greenaway, 2001). With a similar line of reasoning, Love (1983) explains that the more highly concentrated a country‟s exports, the lower is the probability that fluctuations in one direction in some of its exports will be offset by counter fluctuations or stability in others. Hence, which has tended to be equated with the expansion of manufactured exports the need for diversification. By the same token, Labys and Lord (1990) state that export diversification offers a means by which countries can combat earnings uncertainty, when these earnings derive from a few primary commodities, and at the same time increase their revenues from investment in the production of products with market growth potential. Studies have also revealed that unstable export earnings make it difficult for a country to plan capital imports, destabilize consumption, and can adversely affect export earnings trends (Maizels, 1987). Generally, several authors have shown that in the presence of uncertainty and risk aversion, diversification would be a better policy option than specialization in many developing countries in which financial markets are imperfect and underdeveloped and where access to borrowing is limited (Turnovsky, 1974; Ruffin, 1974).
Secondly, relatively new arguments mainly derived from the endogenous growth theory are based on the fact that export diversification is beneficial not only for offsetting export earnings fluctuations, but also that export diversification has a very strong and dynamic comparative advantage. Hence, the dynamic elements of export diversification include demand and supply changes, industrial capability, risk aversion, environmental considerations, and changes in commercial policies (Ssemogerere et al., 1994). The argument on the demand side is that exporters facing autonomous factors such as rising incomes and changes in taste would push countries to diversify their exports towards more income-elastic ones. Similarly, the supply side argument emphasizes that production
23 structure adjustment to changes in production technology and input mix, better land utilization, the introduction of new skills, and changes in the availability of imported inputs are some of the factors that enable a country to diversify into a different mix of high-valued and competitive export products. In short, endogenous growth theory suggests that export diversification affects long-run growth with its accompanying increasing returns to scale and dynamic spillover effects as a result of new techniques of production, management, or marketing practices potentially benefiting other industries (Amin Gutierrez de Pineres and Ferrantino, 2000).
Endogenous growth models such as Matsuyama (1992) emphasize the importance of learning-by-doing in the manufacturing sector for sustained growth. Related to export diversification, there could be knowledge spillovers from new techniques of production, new management, or marketing practices, potentially benefiting other industries (Amin Gutierrez de Pineres and Ferrantino, 2000). Similarly, Agosin (2007) develops a model of export diversification and growth and finds that countries below the technological frontier widen their comparative advantage by imitating and adapting existing products. Likewise, Glyfson (2002) examines the link between physical capital (investment), human capital (investment in education), and other institutional factors with export diversification and economic growth using the following model:
Figure 2.1: Six Determinants of Growth
The model above explains that there are about six different kinds of producible capital that are needed to sustain economic growth. First, saving and investment are obviously necessary to build up physical capital (infrastructure). Second, education is needed to build up human capital. Third, macroeconomic stability encourages the accumulation of financial capital, i.e. financial depth, which helps lubricate the wheels of production and thus increases economic efficiency and growth. Fourth, increased trade with
Investment
Stability
Diversification
Democracy
Growth
24 the rest of the world helps technology transfer as well as strengthening the capital base of domestic activity. Fifth, increased democracy may be viewed as an investment in social capital by which is meant the infrastructural glue that hold society together and keeps it working harmoniously. Sixth, diversification is expected to stabilize income by expanding the possibilities to spread investment risks over a wider portfolio of economic sectors. Moreover, through forward and backward linkages, production of a diversified export structure is also likely to provide stimulus for the creation of new industries and expansion of existing industries elsewhere in the economy. Furthermore, the model
indicates that factors that are good for growth are also good to stimulate export diversification. The structural models of economic development propose that countries should diversify from
primary exports into manufactured exports in order to achieve sustainable growth (Chenery, 1979; Syrquin, 1988). Similarly, the Prebisch-Singer thesis postulates that „vertical export diversification‟ could reduce declining terms of trade for commodity-dependent countries. Al-Marhubi (2000) in a conventional cross-sectional country growth regression adds various measures of export concentration to the basic growth equation and finds that export diversification promotes economic growth, and these findings are robust for different model specifications. In a dynamic cross-country panel model, Lederman and Maloney (2007) also find evidence in support of diversification-led growth. Likewise, Amin Gutierrez de Pineresand Ferrantino (1997) and Herzer and Nowak-Lehmann (2006) examine the link between export diversification and economic growth in Chile, and their findings suggest that Chile has benefited greatly from diversifying its export base. Models in the product cycle literature (Vernon, 1966; Krugman, 1979; Grossman and Helpman, 1991) also imply a link between export diversification and growth.
Furthermore, Hausmann and Rodrik (2003), Hausmann, Hwang, and Rodrik (2006), and Hausmann and Klinger (2006) analyze the benefits of export diversification and exports in general for economic growth, both empirically and theoretically. In their framework, economic growth is not driven by comparative advantage but by countries’ diversification of their investments into new activities. An essential role is played by the entrepreneurial cost-discovery process. According to the model of Hausmann and Rodrik (2003), entrepreneurs face significant cost uncertainties in the production of new goods. If they succeed in developing new goods, the gains will be socialized (information spillovers) but the losses from failure end up being private. This leads to an under-provision of investments into new activities and a suboptimal level of innovation. The bottom line‟ is that, according to Hausmann and Rodrik (2003), the government should play an important role in industrial growth and structural transformation by promoting entrepreneurship and creating the right incentives for entrepreneurs to invest in a new range of activities.
Hausmann, Hwang, and Rodrik (2006) develop an indicator that measures the productivity level associated with a country‟s export basket. This measure is significantly positively affecting economic growth. In other words, countries that produce high-productivity goods enjoy faster growth than
25 countries with lower-productivity goods. The authors develop a model based on the cost-discovery process that supports their empirical findings. The key is that the transfer of resources from lower-productivity to higher lower-productivity goods with the presence of elastic demand of these goods in export markets generates higher economic growth.
Hausmann and Klinger (2006) develop a model of structural transformation in the product space and empirically show that the speed of structural transformation depends on current export goods being closely related to other goods of more sophistication and higher value. They find that the product space is very heterogeneous, and it is desirable for a country to have a high density of product spaces based on its productive capabilities. It is often the case in many developing countries that they have specialized in exporting certain goods but are not able to transfer those assets and skills to the production of more sophisticated goods. This might be another argument for export diversification since it might allow countries to acquire skills and assets that could be relevant for goods in a nearby production space. In other words, there might be knowledge spillovers from export diversification (Amin Gutierrez de Pineres and Ferrantino, 2000).The basic thrust underlying such a hypothesis is based on “product cycle” models. In this context, innovative activity by the north (developed countries) leads to an increasing diversity of products, while imitative activity by the south (LDCs) leads to an increasing diversity of products being produced and exported from low-wage locations (Amin Gutierrez de Piners and Ferrantino, 1997).
By the same token, the product life cycle theory of Vernon (1966) argued that as the result of imitative activities, the comparative advantage of many developing countries has shifted from the export of primary products to manufactured products over time. This happens because these goods go through a product life cycle. Once the product is invented, then over time it becomes more standardized as consumers and producers gain familiarity with its features. Accordingly, standardized manufacturing routines are increasingly common, using low-skilled and semi-skilled labor in assembly type operations. Moreover, in the catching-up product cycle theory, industrial structure evolves as an economy develops, from the simplest (imported) technology to more and more sophisticated functions of the production cycle. The sequential upgrading of production technology and industrial structure is called the “flying geese” model because the industrial structure evolves in a pattern resembling the V-formation of a flock of flying geese (Kwan, 1998). This same flying geese model is typically used to describe the relationship among the economies in the East Asia region. The image captures the connections between the industrial structures of the Asian economies at different stages of development and the dynamic, sequential nature of their development. Japan leads the East Asian flock, followed by Korea and Taiwan, and then the other, later-developing economies of the region. Thus, the flying geese model depicts the latecomers replicating the development experience of the economies ahead of them. Generally, the product cycle theory emphasizes that the commercial success of consumer durables depends on product development mainly based on cost-cutting mass production and the use of known
26 technology, rather than on technological breakthroughs. In this case, the East Asian development experience is a good example of how late-comers can develop through imitation, as long as they put the necessary pre-conditions in places, such as human capital, physical capital, infrastructure, and so forth. Thus, the volume of total exports in real terms is determined by the three main factors: the world demand for exports of the given commodity, the competitiveness of the given product and the degree of export diversification of that country (Athukorala, 1991). For instance, in the 1960s, agricultural export performance was similar in Indonesia, the Philippines and Thailand, both in nominal and real value terms. But in the decades since then, the three countries have shown different performances in agricultural exports. The most important factor resulting in the differences is the ability to diversify and adjust agricultural exports when the market conditions change (Athukorala, 1991).
The development of modern portfolio theory in the field of finance by Harry Markowitz has stimulated much parallel literature devoted to applying the idea of diversification to the realm of trade. Brainard and Cooper first applied Markowitz‟s portfolio theory to trade, with the basic argument that an optimal export portfolio is achieved by exporting a set of products that together minimize the risk of export earnings instability, while achieving the maximum level of export earning returns. Secondly, the goods selected in each portfolio are measured in terms of return and variation in return, or risk, and then the overall portfolio is assessed. An optimal portfolio results in the highest return and lowest risk, and can be used to maximize and stabilize export earnings (Brainard and Cooper, 1968). Likewise, research has primarily focused on diversification away from primary commodities and many scholars have concluded that a portfolio optimization strategy is a valuable tool to mitigate risk and increase return (Dawe, 1996).
There are other empirical works which show how export diversification induces growth. Agosin (2005) conducted a cross country study on the effects of export diversification on growth in a group of Latin American and Asian countries and found that after controlling for other variables that affect growth, export diversification alone and in interaction with per capital export volume growth is highly significant in explaining per capita GDP growth over the 1980-2003 period. Similar empirical research findings by Sachs and Warner (1997), or more recently by Gylfason (2004) and De Ferranti et al. (2002) suggest that export concentration is indeed statistically associated with slow growth, in particular when export concentration reflects the predominance of primary products, as is usually the case. Herzer et al (2004) also found a long-run statistical association between growth and export diversification on the basis of time-series data from Chile.
By the same token, Feenstra et al (1999) evaluate the link between increased product variety and productivity using sectoral data for South Korea and Taiwan. To measure product variety they use disaggregated exports from both South Korea and Taiwan to the United States. Moreover, they consider two types of industries: primary industries, which rely heavily on natural resources and secondary industries which rely on differentiated manufactures. Finally, they find that the changes in relative