Evaluation of a Short-Form of the Food Frequency
Questionnaire for Japanese Working Women
Ayumi Kobayashi , Yukiko Miyazaki , Jung-Su Lee, Yasuhiro Matsumura , Reiko Suzuki
and Kunihiko Hayashi
1 School of Nursing, Faculty of Health Science, Gumma Paz College, 1-7-1 Tonya-machi, Takasaki, Gunma 370-0006, Japan 2 Faculty of Health Care, Takasaki University of Health and Welfare;501 Nakaorui-machi, Takasaki, Gunma 370-0033, Japan 3 School of Public Health, Graduate School of Medicine, The University of Tokyo, 7-3-1 Hongo, Bunkyo-ku, Tokyo 113-0033, Japan 4 Faculty of Health and Nutrition, Bunkyo University, 1100 Namegaya, Chigasaki, Kanagawa 253-8550, Japan
5 Division of Medical Nutrition,Department of Healthcare,Tokyo Healthcare University,3-11-3 Setagaya,Setagaya-ku,Tokyo 154-8568, Japan
6 Department of Laboratory Sciences, Gunma University Graduate School of Health Sciences, 3-39-22,Showa-machi,Maebashi,Gunma 371-8514, Japan
Abstract
Background & Aims:To evaluate the reproducibility and relative validity of a short-form food frequency question-naire (SF-FFQ) for intake of 11 food items and breakfast in Japanese working women.
M ethods:The subjects were 40 female nurses. Reproducibility was evaluated by comparing the SF-FFQs (SF-FFQ1 and 2)measured twice at 5-to 7-month intervals. The relative validity of the SF-FFQs was assessed by using the mean weight (mDR, g/day) or mean frequency (mfDR, times/week) of the two 7-consecutive-day dietary records.
Results:The kappa statistics (K), proportions in corresponding categories, and the Spearman s rank correlation coefficient (ρ)for the reproducibility were 0.16-0.75,0.40-0.90,and 0.27-0.86. For the relative validity,the median (range) of energy-adjusted ρbetween SF-FFQ2 and mDR for 11 food items was 0.36 (0.00-0.66)and 0.28 (−0.25-0.81)for shift workers. The agreement between SF-FFQ2 and mfDR in corresponding categories was 90% for both breakfast frequency and main staple food. Theρbetween SF-FFQ2 and mfDR of breakfast was 0.56 and 0.50 for shift workers, and the K of main staple foods was 0.74 and 0.52 for shift workers.
Conclusions:This SF-FFQ has good reproducibility and relative validity for most food items regardless of work schedule.
Introduction
In recent years, the relationship between dietary habits and health has drawn increasing attention. It is known that hypertension, coronary heart disease, stroke,some cancers,diabetes,and many other diseases are correlated with nutrition and eating habits. For example, among Japanese women, higher intake of soybean products may correlate with lower breast cancer incidence than in the United States and Eur-ope.
However,more recently,breast cancer incidence in Japan has continued to increase by age-adjusted death rate and the prevalence of breast cancer has also in-creased. The shift in dietary habits toward a more Western dietary pattern,represented by high intake of, for instance, red meat and fats may be one of the reasons. In addition, with the societal advance of women, Japanese women s dietary habits may have changed. As of 2013,the labor-force participation rate of Japanese women aged 15-64 years old was 62.4%, which was the highest recorded since 1968. Working women may buy fat-rich processed foods or eat outside the home when pressed for time, and this in turn has affected the dietary habits of women in general. Article Information
Key words:
food frequency questionnaire, diet record, relative validity, reproducibility Publication history: Received: October 27, 2014 Revised: November 28, 2014 Accepted: December 22, 2014 Corresponding author: Ayumi Kobayashi
School of Nursing,Faculty of Health Science,Gumma Paz College, 1-7-1 Tonya-machi, Takasaki, Gunma 370-0006, Japan
Because women s participation in the workplace will continue to increase, defining the dietary habits of working women to clarify their connection with health is a useful goal. Additionally, the dietary habits of working women influence not only their own health but also that of family members because Japanese women often assume the task of providing meals for the family. However, very few dietary surveys have targeted Japanese working women.
In an epidemiologic study, a food survey method must reflect actual food intake,be easy to understand, and place little burden on the subject. Of the variety of methods available for surveying food intake, the Food Frequency Questionnaire is comparatively well known, allows collection of information on usual or average diet over an extended period,and is frequently used in large-scale epidemiological investigations. It must be developed for each target population because dietary habits vary greatly depending on participants characteristics of the ethnic, social, and cultural back-grounds. The reproducibility and validity must also be evaluated because invalid information on dietary intake may lead to false conclusions about the relation-ship between food items and health.
The purpose of this study was to evaluate the reproducibility and relative validity of a short form of the food frequency questionnaire (SF-FFQ) used to assess intake of Japanese working women.
M ethods
SubjectsSubjects were recruited from among the 698 cohort members of the Gunma Nurses Health Study(GNHS), 40 of whom participated in both surveys conducted in August-October 2007 and February-April 2008. GNHS is the pilot study of the Japan Nurses Health Study (JNHS), a large cohort study by Hayashi et al.. The JNHS is a cohort study of female nurses aged 25 years, initiated at the end of 2001 to obtain scientific evidence that may play a role in improving the health of women in Japan. The GNHS was initiated in 1999 to test the feasibility of the JNHS and its subjects are female nurses aged 20 years.
Study design
The study design is outlined in Figure 1. We surveyed the subjects with the SF-FFQ twice, 5-7
months apart, in summer-fall (August-October 2007; SF-FFQ1) and in winter-spring (February-April 2008; SF-FFQ2). The participants were asked to start recor-ding their dietary intake for 7 consecutive days(7-day DRs) at the same time for both SF-FFQ1 and 2. At that time,we made a schedule for the subjects engaged in work with a midnight shift (shift workers) to include at least one midnight shift within the 7 days because we wanted to confirm whether it was possible to use the SF-FFQ with women whose working hours were irregular. We collected a total of 14 days of diet records (DR).
Short form of the food frequency questionnaire An SF-FFQ consisting of 11 food or food group items (food items) and two questions about breakfast was used. The ultimate purpose of this SF-FFQ is to assess the relation between food intake and health pertaining to Japanese working women. The selected food items included the five major nutrients of carbo-hydrates, protein, lipid, vitamins, and minerals, and are frequently consumed by Japanese people.
Our SF-FFQ includes the four isoflavone-rich foods of tofu (bean curd),natto (fermented soybeans), miso soup, and soy milk products, because we paid specific attention to the association between soy iso-flavone intake and estrogen-related health conditions such as menopausal symptoms and breast cancer. Soy isoflavone has attracted attention because of its
resem-blance to the female hormone estrogen. It not only
functions similarly to a female hormone, but also suppresses excessive secretion of estrogen and may help
prevent breast cancer. Because soy products are
commonly used in Japanese meals, the intake of soy isoflavones among Japanese women is higher than in Western populations, and up to 700 times that of
Caucasians in the United States. The SF-FFQ also
included milk/dairy products and green/yellow vege-tables because they supply calcium as well as soybean products and their intake is recommended, especially for women,in Health Japan 21. We also asked about fish and fruit because increased intakes are recom-mended in the dietary guidelines published by the Ministry of Agriculture,Forestry and Fisheries;Minis-try of Health, Labour and Welfare; and MinisFisheries;Minis-try of Education, Culture, Sports, Science and Technology. Additionally, an inverse association has been found between fish and n-3 fatty acid intake and cancers of Evaluation of the FFQ for Japanese Working Women
tion.
In this SF-FFQ,we divided meat into beef,pork, and chicken to distinguish between red and white meats because red meats such as beef and pork have been linked to an increased risk of heart disease and
several kinds of cancer. Additionally, the SF-FFQ
asked the staple breakfast food and frequency of intake because it has been reported that people who have breakfast regularly have a lower risk of type 2 diabetes
mellitus and that skipping breakfast has harmful
effects on health.
The SF-FFQ was used to ask about average intake frequency of 11 food items and breakfast for the preceding year. Five or six frequency categories were used (1.no intake;2.about 1 day/week;3.2 or 3 days/ week;4.4 or 5 days/week;5.almost every day;6.twice a day or more). We also asked which of the staple foods,rice or bread,was most often eaten for breakfast. Diet record (DR)
Participants were asked to record all dishes and food items they ate or drank each day (midnight to midnight). They were also asked to record the weight or volume of each as accurately as possible. They wrote down the state of the item at the time it was weighed, for example, wakame (fresh) or wakame (dried), (wakame is a type of edible seaweed)and the method of cooking,for example, spinach (boiled) or spinach (stir-fried) . For purchased,pre-cooked meals, such as boil-in-bag or frozen foods, they attached the package contents label to the diary diet record when-ever possible. They were asked to indicate products purchased from chain stores by product name, and to photograph their meals if they ate outside the home. This was to enable the content and amount of what they actually ate to be faithfully reflected in the data as much as possible. The subjects were provided with a digital cooking scale.
An registered dietitian and a nourishment epidemiology researcher input the recorded contents of the DR into the computer software Excel Eiyokun ver.
4.5 (Kenpakusya, Tokyo, Japan) for every target
person. In accordance with the Standard Tables of Food Composition in Japan (fifth revised edition), we calculated mean intake(g)and energy intake(kcal) per day according to the 11 food items for two 7-day periods (14 days in total).
Food consumed between 4:30 a.m. and 10:30 a.m was recorded as breakfast was eaten . The breakfast intake frequencies of DR1 and 2 were added and divided by two to give the average breakfast intake frequency each week. In addition, the intake fre-quencies of rice or bread for breakfast were simi-larly handled and the average intake frequency per week for each was calculated.
Statistical analyses
To assess reproducibility, we calculated kappa statistics, the proportions of corresponding categories,
between SF-FFQ1 and 2.
To evaluate the relative validity of the SF-FFQ, we used the mean intake from the two 7-day DRs (mDR)(g/day)and SF-FFQ2 because SF-FFQ2 asked for the average food intake situation over the preceding year and this investigation period overlapped with the mDR. To clarify the intake situation, frequency cate-gories from SF-FFQ2 were converted to weekly intake as 0, 1, 2.5, 4.5, 7, and 14 (times/week), then mean, standard deviation (SD),median,and 25-75% interval were shown with the mDR. In addition, ρ values between the mDR and the SF-FFQ2 for the 11 food items were calculated. For the intake frequency of miso soup in SF-FFQ2, ρwas calculated with the intake of miso in the mDR. Although in the past, most validity studies have been analyzed for nutrient intake,we compared each dietary survey method at the level of the individual food items because we could know which SF-FFQ was able to measure the intake of target food items well. In addition to the crude ρ values, we computed ρvalues with an adjustment for total energy intake by the residual method.
For items where validity was relatively low by the method using mDR and SF-FFQ2,we tried to identify relative validity between the mean frequencies (times/ week)according to the DRs(mfDR)and SF-FFQ2. In this approach, the frequency based on mfDR was counted by two methods:counting the number of days in which the target food item was eaten,and counting the number of days in which the target food item was eaten in the same or greater amount as the cutoff level. The frequencies counted using the two methods were classified into five categories that were the same as the SF-FFQ2 ( No intake :0 or more and less than 1; 1 day/week : 1 or more and less than 2; 2-3 days/ week :2 or more and less than 4; 4-5 days/week :4 or more and less than 6; Almost every day : 6 or
more). Agreement was calculated, including the
responses in corresponding categories(%),correspond-ing and adjacent categories (±1), and the extreme categories (lowest and highest categories or in reversal
categories). The Kruskal-Wallis test was used to
determine the difference in the intake frequencies of food items based on mfDR by frequency categories of SF-FFQ. In addition, ρ was estimated between the answers of the SF-FFQ2 and the five frequency cate-gories classified by mfDR.
Next, to evaluate the relative validity of the SF-FFQ for breakfast, we assess the level of agreement between the responses of the SF-FFQ2 and the categor-ization of breakfast intake estimated from mfDR. We counted the frequencies of the 14 day rice and bre-ad intakes for breakfast and divided them into the three categories where more rice than bread , rice and bread equally , and more bread than rice , then we compared responses on the SF-FFQ2 with mfDR for the main staple food eaten for breakfast.
We evaluated the relative validity of the SF-FFQ for shift workers. We considered a person engaged in
rotating-shift work with a midnight shift at the time of either or both of the SF-FFQ1 and SF-FFQ2 to be a shift worker.
We considered entry deficiencies (missing data) for the intake frequency of the 11 food items in the SF-FFQ to be 1. No intake . We considered entry deficiencies for the intake frequency of breakfast to be 5. Almost every day because all participants for whom there was a blank about the intake frequency of breakfast answered the question about which staple food they usually ate,rice or bread. We considered it to be rice and bread equally for entry deficiencies of the staple food eaten for breakfast. The significance level was set at p<0.05. The statistical analysis used JMP ver. 8.0 (SAS Institute Inc., Cary, NC, USA). Ethics
This study was conducted according to the guide-lines laid down in the Declaration of Helsinki and all procedures involving human subjects were approved by the institutional review board of Gunma University, Gunma, Japan (Approval No.19-11). Written infor-med consent was obtained from all subjects.
Results
1. Subjects characteristics
The subjects mean age and age range at the time of the summer-fall (August-October 2007, SF-FFQ1 and DR1) survey was 49.7 years (range, 31-70 years). Their mean body mass index (BMI) and BMI ranges were 22.5 kg/m (range, 17.7-30.8 kg/m ). The sub-jects mean daily energy intake and range were 1,751 kcal (range, 971-2,470 kcal). Twelve (30%) subjects were shift workers.
2. Reproducibility
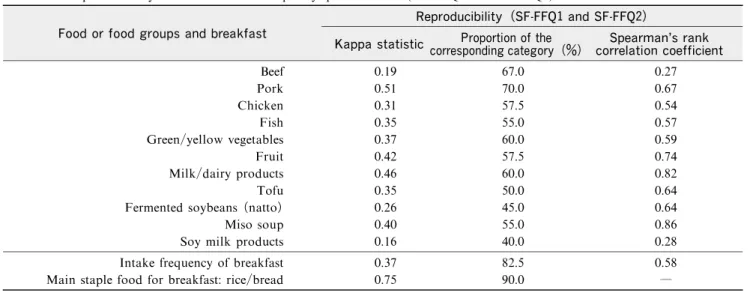
We examined the reproducibility of the dietary intake of the 11 food items estimated by SF-FFQ1 and 2. The kappa statistics ranged from 0.16 (soy milk products) to 0.51 (pork). The range of proportions of corresponding categories was 40.0% (soy milk prod-ucts) to 70.0% (pork). The range ofρwas 0.27 (beef) to 0.86 (miso soup). Beef (ρ=0.27) and soy milk products(ρ=0.28)had poor associations. Conversely, fruit(ρ=0.74),milk/dairy products(ρ=0.82)and miso soup (ρ=0.86) had strong associations (Table 1). Table 1 Reproducibility between two food frequency questionnaires (SF-FFQ1 and SF-FFQ2) n=40
Food or food groups and breakfast
Reproducibility(SF-FFQ1and SF-FFQ2)
Kappa statistic corresponding category(%)Proportion of the correlation coefficientSpearman s rank
Beef 0.19 67.0 0.27 Pork 0.51 70.0 0.67 Chicken 0.31 57.5 0.54 Fish 0.35 55.0 0.57 Green/yellow vegetables 0.37 60.0 0.59 Fruit 0.42 57.5 0.74 Milk/dairy products 0.46 60.0 0.82 Tofu 0.35 50.0 0.64
Fermented soybeans (natto) 0.26 45.0 0.64
Miso soup 0.40 55.0 0.86
Soy milk products 0.16 40.0 0.28
Intake frequency of breakfast 0.37 82.5 0.58
Main staple food for breakfast:rice/bread 0.75 90.0 ―
Table 2 Intake frequency(times/week)based on SF-FFQ2, daily intake (g/day)based on mDR , and their correlation
with 11 food groups for all subjects. n=40
Food or food groups
SF-FFQ2(times/week) Mean SD Median 25%-75% mDR(g/day) Mean SD Median 25%-75% Spearman s rank correlation coefficient
Crude Energy-adjusted Beef 0.7 0.5 1.0 0.0-1.0 8.7 7.6 6.8 3.0-13.4 0.05 0.00 Pork 2.1 1.3 2.5 1.0-2.5 21.4 13.6 18.6 11.2-29.5 0.50 0.51 Chicken 1.6 1.1 1.0 1.0-2.5 13.9 9.4 13.8 7.2-19.4 0.11 0.11 Fish 3.8 2.5 2.5 2.5-4.5 24.5 16.5 20.6 16.1-31.3 0.34 0.32 Green/yellow vegetables 6.9 3.5 7.0 4.5-7.0 72.8 50.5 82.9 55.6-110.6 0.45 0.36 Fruit 5.3 3.0 4.5 2.5-7.0 132.3 76.4 139.7 68.1-181.0 0.68 0.66 Milk/dairy products 6.0 3.5 7.0 4.5-7.0 155.3 84.9 143.2 77.0-232.2 0.62 0.63 Tofu 3.3 2.3 2.5 2.5-4.5 25.1 18.4 22.1 12.6-31.9 0.33 0.26 Fermented soybeans (natto) 3.8 2.3 2.5 2.5-7.0 12.5 11.6 9.8 5.8-15.3 0.56 0.51 Miso soup 5.4 3.7 4.5 2.5-7.0 7.6 4.1 7.4 3.7-11.1 0.57 0.54 Soy milk products 1.7 1.8 1.0 0.0-2.5 9.5 26.1 0.0 0.0-0.0 0.34 0.25 (a)mDR=mean intake weights from two 7-day diet records (b)SD=standard deviation
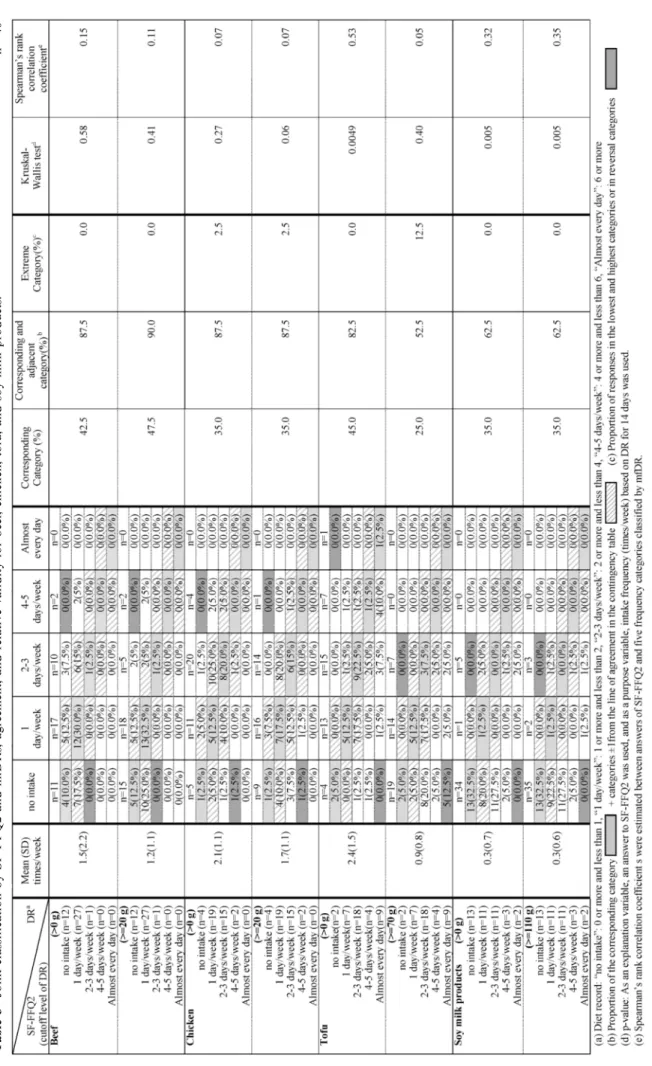
T a bl e 3 Jo in t cl as si fi ca ti o n b y S F -F F Q 2 an d m fD R s, ag re em en t, an d re la ti ve v al id it y fo r b ee f, ch ic k en , to fu , an d so y m il k p ro d u ct s. n
For the intake frequency of breakfast, the kappa statistic was 0.37,the proportion of the corresponding category was high (82.5%),and ρwas 0.58. The staple food for breakfast had excellent agreement in the kappa statistic (0.75) and the proportion of the corre-sponding category was high (90%) (Table 1).
3. Relative validity 1) 11 food items
Table 2 shows the intake frequency(times/week) based on SF-FFQ2, daily intake (g/day) based on mDR, and the ρvalues for the 11 food items for all
subjects (n=40). The median (range) of
energy-adjusted ρ between SF-FFQ2 and mDR was 0.36 (0.00-0.66). Beef(0.00)and chicken (0.11)had almost no correlation, and tofu (0.26) and soy milk products (0.25) had poor correlations in energy-adjusted ρ.
Where four food items had low energy-adjusted ρ, we tried to identify relative validity between the fre-quencies (times/week) according to SF-FFQ2 and mfDR (Table 3). We set the cutoff level with a lower limit level from the range of the portion size shown in meal balance guides when we counted intake fre-quency. Beef and chicken were 20 g,tofu was 70 g,and
soy milk products was 110 g. For beef, 42.5% and
47.5% were in corresponding categories, 92.5% and 95.0% were in corresponding and adjacent categories,
respectively, and 0% were in extreme categories when we did not set a cutoff level (20 g)in DR and when we set it, respectively. Kruskal-Wallis tests were not sig-nificant and ρwas less than 0.2 for both. For chicken, 35.0% was in corresponding categories, 87.5% was in corresponding and adjacent categories, and 2.5% was in the extreme categories for both. Although neither Kruskal-Wallis test was significant, the p-value when we set a cutoff level (20 g) in the DR was 0.06. ρwas less than 0.1 for both. For tofu,45.0% and 25.0% were in corresponding categories,82.5% and 52.5% were in corresponding and adjacent categories,and 0% and 12. 5% were in the extreme categories, respectively. The Kruskal-Wallis test was significant when we did not set a cutoff level in the DR. ρwas 0.53 when we did not set a cutoff level in the DR and 0.05 when we did set it. For soy milk products, corresponding categories, corresponding and adjacent categories, and extreme categories were 35.0%, 62.5%, and 0%, respectively, irrespective of whether we set cutoff levels. Kruskal-Wallis tests were significant and ρwas 0.32 and 0.35, respectively.
2) Breakfast
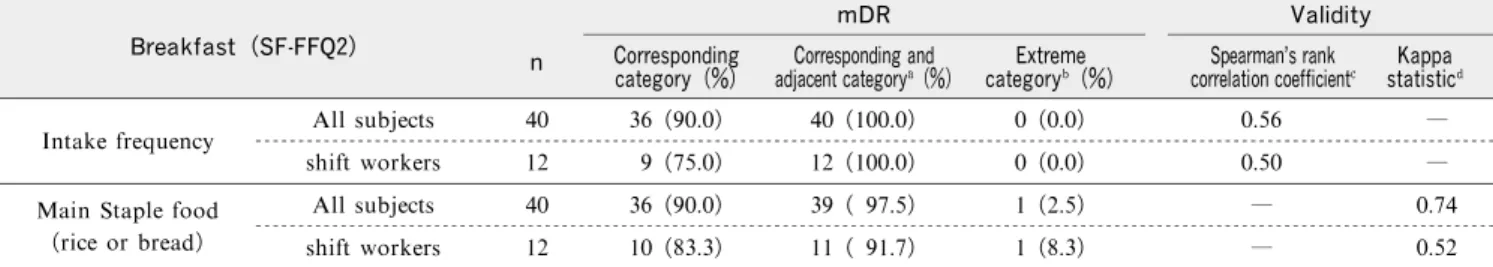
Table 4 shows agreement between the categoriza-tion of breakfast intake estimated from the SF-FFQ2 and mfDR, and the validity for all subjects (n=40). Table 4 Agreement between the categorization of breakfast intake estimated from the SF-FFQ2 and mfDRs and validity
Breakfast(SF-FFQ2)
n
mDR Corresponding
category(%) adjacent category(%)Corresponding and category (%)Extreme
Validity Spearmans rank
correlation coefficient statisticKappa
All subjects 40 36 (90.0) 40 (100.0) 0 (0.0) 0.56 ―
Intake frequency
shift workers 12 9 (75.0) 12 (100.0) 0 (0.0) 0.50 ―
All subjects 40 36 (90.0) 39 ( 97.5) 1 (2.5) ― 0.74
Main Staple food
(rice or bread) shift workers 12 10 (83.3) 11 ( 91.7) 1 (8.3) ― 0.52
(a) Responses in the corresponding categories + (categories±1 from the line of agreement) (b) Responses in the lowest and highest categories or in reversal categories
(c) Spearman s rank correlation coefficient were estimated between answers of SF-FFQ2 and five frequency categories classified by DR for 14 days.
(d) Kappa statistics were estimated between answers of SF-FFQ2 and five frequency categories classified by DR for 14 days.
Table 5 Intake frequency(times/week)based on SF-FFQ2, daily intake of 11 foods or food groups (g/day)based on mDR ,
and their correlation for rotation-shift workers. n=12
Food groups SF-FFQ2(times/week) Mean SD Median 25%-75% mDR(g/day) Mean SD Median 25%-75% Spearman s rank correlation coefficient
Crude Energy-adjusted Beef 0.8 0.5 1.0 0.3-1.0 9.9 8.4 8.1 3.7-17.2 0.17 −0.25 Pork 2.3 1.7 2.5 1.0-2.5 24.6 14.1 25.0 14.4-32.3 0.60 0.64 Chicken 1.8 1.5 1.0 1.0-2.5 14.9 11.0 13.2 6.2-22.0 −0.07 0.18 Fish 3.3 2.0 2.5 2.5-4.5 20.4 13.7 18.6 13.0-24.1 0.54 0.25 Green/yellow vegetables 7.5 3.2 7.0 5.1-7.0 107.3 67.2 105.7 56.1-147.3 0.63 0.40 Fruit 4.8 3.9 4.5 1.0-7.0 154.2 86.3 141.1 91.2-216.2 0.73 0.81 Milk/dairy products 5.5 3.7 5.8 1.9-7.0 122.6 81.3 101.5 53.9-209.0 0.49 0.46 Tofu 2.7 2.3 2.5 1.0-4.0 21.5 15.6 21.7 12.7-28.6 0.37 −0.15 Fermented soybeans (natto) 3.2 2.1 2.5 1.4-4.5 9.1 7.9 6.8 3.3-14.3 0.28 0.28 Miso soup 4.8 3.9 4.5 1.4-7.0 6.9 4.6 5.7 3.0-10.5 0.49 0.41 Soy milk products 1.0 1.3 1.0 0.0-1.0 6.0 20.6 0.0 0.0-0.0 0.52 0.06 (a) mDR=the mean intake weights from two 7-day diet records (b) SD=standard deviation
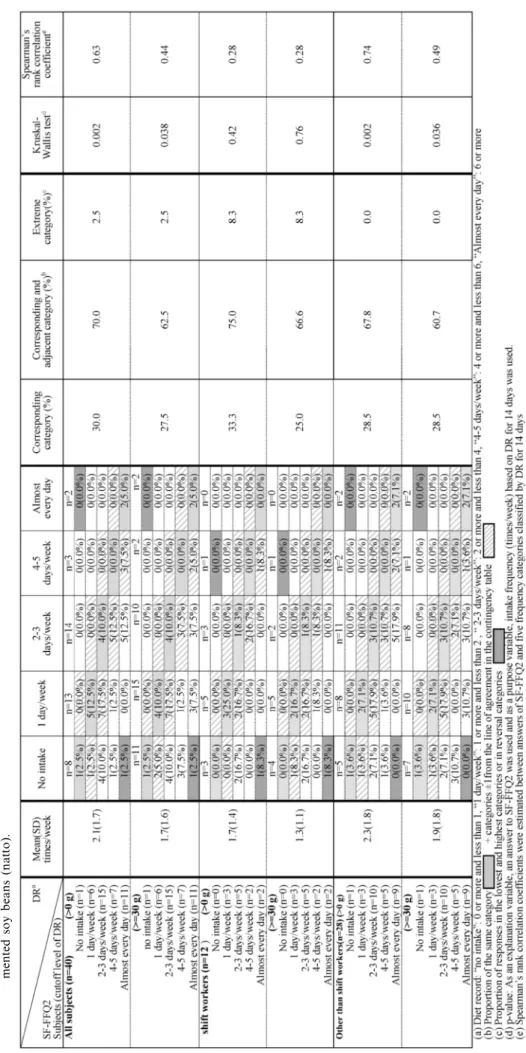
T a bl e 6 C o m p ar is o n am o n g al l su b je ct s, ro ta ti n g sh if t w o rk er s, an d o th er t h an s h if t w o rk er s fo r jo in t cl as si fi ca ti o n b y S F -F F Q 2 an d m fD R , ag re em en t, an d re la ti ve v al id it y o f m en te d so y b ea n s (n at to ).
The mean intake frequencies (times/week) (standard deviation) of breakfast based on SF-FFQ2 and the mfDRs were 6.7 (1.1) and 6.6 (1.1). 90.0% of all sub-jects were in corresponding categories,100.0% were in corresponding and adjacent categories, and 0% were in the extreme categories.ρwas 0.56 and regarded as in fair association.
For the main staple food for breakfast, 77.5% of all subjects answered rice in the SF-FFQ2 and 72.5% of all subjects ate rice more than bread in the mfDR. Of all subjects, 90.0% were in corresponding cate-gories, 97.5% were in corresponding and adjacent categories, and 2.5% were in the extreme categories. The kappa statistic was 0.74 and regarded as in fair agreement.
3) Relative validity when shift workers used the SF-FFQ
Table 5 shows the intake frequency(times/week) based on the SF-FFQ2,daily intake(g/day) based on mDR, and the ρvalues for the 11 food items for shift
workers (n=12). The median (range) of
energy-adjusted ρbetween the SF-FFQ2 and mDR was 0.28 (−0.25-0.81). The four items of beef, chicken, tofu, and soy milk products were less than 0.2 for energy-adjusted ρ. The ρof the natto fell to 0.28 (for shift workers) from 0.51 (for all subjects).
Table 6 shows the comparison between all sub-jects and the shift workers for the joint classification by SF-FFQ2 and mfDR, agreement, and the relative validity of natto. Non-shift workers were better than shift workers in terms of agreement and relative valid-ity regardless of whether we set cutoff levels, and the same or better than all subjects. Mean (SD) (times/ week) of intake frequencies based on mfDR was 2.3 (1.8) for non-shift workers and 1.7 (1.4) for shift workers when we did not set cutoff levels. In a similar manner, they were 1.9 (1.8) for non-shift workers and 1.3(1.1)for shift workers when we did set cutoff levels. Table 4 shows the agreement and relative validity for breakfast when shift workers used the SF-FFQ. For intake frequency,the same category was 75%,there were no extreme category, and ρwas 0.50. For the main staple food, the same category was 83.3%, extreme category was 8.3%,and the kappa statistic was 0.52.
Discussion
We evaluated the reproducibility and relative validity of the SF-FFQ used to assess the intake of 11 food items and breakfast for Japanese working women. Our result showed that medium to high reproducibility was shown (ρ: 0.54-0.86) for nine food items (pork, chicken,fish,green/yellow vegetable,fruit,milk/dairy products, tofu, natto, and miso soup) and the intake frequency of breakfast. In addition, medium to high validity was shown (energy-adjusted ρ:0.32-0.66) for seven food items (pork, fish, green/yellow vegetables, fruit, milk/dairy products, natto, and miso soup) and
the intake frequency of breakfast.
For beef,the reproducibility(0.19 for kappa statis-tic,ρ=0.27)(Table 1)was low. Colditz et al.reported that reproducibility of responses for individual food items on a semi-quantitative food frequency question-naire was high for habitually and frequently eaten
foods. Mean intake frequency for beef was 1.5 when
we did not set a cutoff level or 1.2 times/week when we set a cutoff level of 20 g/day(Table 3). Reproducibi-lity for beef was low,this might be due to beef was not a habitually and frequently eaten in our subjects. Between the SF-FFQ2 and intake weight based on mDR (Table 2) and between the SF-FFQ2 and the intake frequency(Table 3),there was almost no corre-lation even when we set cutoff level to count the intake frequency of beef. One of reasons for this may be that there were few choices in the classifications of the SF-FFQ. According to multi-purpose cohort baseline data gathered by the former Ministry of Health and Welfare, Japan (1996), 15.4% of women subjects an-swered no intake ,49.4% anan-swered sometimes ,and 29.6% answered 1 or 2 days/week for beef. Because the next choice to no intake was once a week in our study, 30% of subjects answered no intake and 67.5% answered once a week . People who some-times ate beef might be at a loss as to where they
should answer. To improve validity, including a
choice for an even lower frequency may be necessary, for example, once in 2 weeks or once a month . Beef is the food item where intra-individual variation
is relatively large. Beef was classified as steak,
ham-burger steak, sukiyaki, and other items, and the por-tion size varies accordingly. Because it is processed into various foods,some respondents may not be aware of having eaten beef because it is invisible. In addi-tion, 40.0% or 27.5% of people answered fewer fre-quency categories in the SF-FFQ than in the mfDR, whereas the over-reporting rates were 17.5% and 25.0%, respectively. The underestimation for meat, poultry and other foods of animal origin by the
SF-FFQ is also found in other cohort studies. We
thought that social desirability possibly biased the reporting of dietary intakes on the SF-FFQ for beef because some people may believe that beef as a red meat is linked to an increased risk of heart disease and several kinds of cancer.
For chicken, the energy-adjusted ρwas low (ρ= 0.11) between the SF-FFQ2 and intake weight based on the mDR (Table 2). In addition, between the SF-FFQ2 and the intake frequency (Table 3), even when we set a cutoff level to count the intake frequency of chicken, there was no correlation. According to multi-purpose cohort baseline data gathered by the former Ministry of Health and Welfare, Japan (1996), 6.0% of women subjects answered no intake ,45.2% answered sometimes , and 39.3% answered 1 or 2 days/week . Because the next choice to no intake was once a week in our study, 30% of subjects answered no intake and 67.5% answered once a week . Because there was no choice of sometimes on Evaluation of the FFQ for Japanese Working Women
our SF-FFQ, people who sometimes ate chicken may not have been able to answer using an exact category on the SF-FFQ. To improve relative validity, in the same way as with beef, including a choice for even lower frequency may be necessary, for example,
once in 2 weeks or once a month .
As mentioned above,we think that the ability for ranking in the group to the intake of beef and chicken is relatively low. However, in joint classification by SF-FFQ2 and mfDRs (Table 3), the percentage of corresponding categories (42.5% and 47.5% for beef, 35.0% and 35.0% for chicken) and corresponding and adjacent categories (92.5% and 95.0% for beef, 87.5% and 87.5% for chicken) were relatively high, and extreme category was low (0.0% and 0.0% for beef, 2.5% and 2.5% for chicken) when we did not set a cutoff level (20 g)in DR and when we set it,respective-ly. From these, it was shown that our SF-FFQ is suitable to estimate the intake frequency of the beef and the chicken roughly.
For tofu, the energy-adjusted ρbetween the SF-FFQ2 and the mDR was low (ρ=0.26) (Table 2). In fact, blood isoflavone levels were gathered from the same subjects in the current investigation and from the same period, and correlations with the SF-FFQ for natto and for miso soup intake were confirmed,but the correlation with tofu was weak (Ohta Y.,master thesis, personal communication). This suggests that the rela-tive validity of the SF-FFQ for tofu may be low. However, when we did set a cutoff level to count the intake frequency of tofu, the ρestimated between the answer on the SF-FFQ2 and the five frequency cate-gories on the mfDR was 0.53. From this,it may be said that although the correlation between the SF-FFQ and the intake weight was not acceptable for tofu, the correlation between the SF-FFQ and the intake fre-quency of tofu was acceptable. On the other hand,the correlation between the SF-FFQ and the intake fre-quency of tofu was not acceptable when we set a cutoff level (70 g)to count the intake frequency of tofu. For this reason, we surmised that the portion size was not constant for tofu because it was difficult to recognize intake quantity accurately because tofu was cooked in many different forms and quantities in meals. How-ever, it may be possible to assess intake quantity because it is known that most of the variation in intake of any food is explained by frequency of use and the relative validity of the intake frequency of tofu was recognized.
For soy milk products, the reproducibility (0.16 for kappa statistic, ρ=0.28) (Table 1) was low. According to the DRs for 14 days, the mean intake frequency of soy milk products was 0.3 times/week regardless of whether we set a cutoff level, and more than 85% of subjects were categorized as no intake (Table 3). We hypothesize that reproducibility was low for soy milk products because soy milk products were not habitually and frequently eaten foods. In addition, between the SF-FFQ2 and intake weight based on mDR (Table 2), ρ was low (ρ=0.25).
However, a poor association was confirmed between the SF-FFQ2 and intake frequency based on the mfDRs whether we set a cutoff level (ρ=0.35) or not (ρ=0.32) (Table 3). Therefore, we thought that we might be able to measure an intake of soy milk prod-ucts by setting a portion size at around 110 g.
Another concern was whether the use of the SF-FFQ was possible for the person whose working hours were irregular. Therefore, we attempted to define the relative validity of the SF-FFQ for shift workers. Low to high validity was shown (energy-adjusted ρ:0.25-0.81) for seven food items (pork, fish, green/yellow vegetables,fruit,milk/dairy products,natto,and miso soup)and the intake frequency of breakfast. The beef, chicken, tofu, and soy milk products which were almost no correlation for all subjects were negative to almost no correlation in energy adjusted ρ for shift workers, too. The result of comparing the relative validity of the SF-FFQ between shift workers (Table 4) and all subjects (Table 2) was that the energy adjusted ρof natto decreased remarkably(0.51-0.28). On the day of the night duty, it is reported that shift
worker tended to omit breakfast. Natto is eaten for
breakfast willingly in Japan. As the reason that the shift worker could not answer an intake of the natto by the SF-FFQ definitely, the irregular lifestyle of the
shift workers may influence it. However,
energy-adjusted ρof natto for shift workers is 0.28 and still low validity was shown.
Only 40 people from among the 698 cohort mem-bers of the Gunma Nurses Health Study (GNHS) agreed to participate and the relatively small number of subjects is a limitation of the study. It will be necessary in the future to further evaluate the validity of the SF-FFQ by examining the association between biomarkers and the SF-FFQ.
The subjects of this study were nursing profes-sionals from only one prefecture. They were not representative of the Japanese nursing profession as a whole,or of working women in Japan. The possibility of non-response bias should be considered. However, in this study,the degree of reproducibility and validity for the SF-FFQ with the shift workers resembled that of all subjects in most food items. This suggests that the SF-FFQ is suitable for assessing eating habits for both shift workers and all subjects and can be used for working women with various work schedule.
Having evaluated seasonality for each person in only two seasons was another limitation. Yamamoto et al. evaluated the intake of soy products in each of the four seasons(spring,summer,autumn,and winter) and showed that differences in intake frequency of soy products by season were small. In this study,the four seasons were covered because the time frames were summer-autumn and winter-spring. In addition,using the mean DR of two 7-day DRs as a reference method minimized the influence of seasonal variations. Actu-ally,it shows that there is little influence of the season that reproducibility of the fruit was high.
has acceptable level of reproducibility and relative validity for most food items regardless of working hours,although the accuracy for evaluating the intake of beef and chicken was a relatively low.
Acknowledgments
This research was supported in part by a Grant-in-Aid for Scientific Research (K. H., grant numbers (B) 22390128); and The JMWH Bayer Grant from the Japan Society for Menopause and Women s Health (2009) (Y. M.). We would like to thank the subjects who cooperated with this study. We are also grateful to Ms. Kozue Kurosaki, Ms. Yuki Ideno, and Ms. Kazue Nagai for their assistance with the data manage-ment.
References
1. Tsugane S, Sawada N. The JPHC study:design and some findings on the typical Japanese diet. Jpn J Clin Oncol 2014;44:777-782.
2. Nagata C,Mizoue T,Tanaka K,et al. Soy intake and breast cancer risk:an evaluation based on a systematic review of epidemiologic evidence among the Japanese population. Jpn J Clin Oncol 2014;44:282-295.
3. Matsuda A,Matsuda T,Shibata A,et al. Cancer incidence and incidence rates in Japan in 2008: a study of 25 population-based cancer registries for the monitoring of cancer incidence in Japan (MCIJ) project. Jpn J of Clin Oncol 2013;44:388-396.
4. McNeill SH. Inclusion of red meat in healthful dietary patterns. Meat Sci 2014;98:452-460.
5. Ministry of Internal Affairs and Communications. Labour Force Survey;Average of 2013 (bulletin board).
http://www.stat.go.jp/data/roudou/sokuhou/nen/ft/pdf/ index1.pdf(accessed September 2014).
6. Ministry of Agriculture, Forestry and Fisheries. Trends of food consumption and production, annual report on food, agriculture and rural areas in Japan (FY2006) trends in food, agriculture and rural areas. 13-14.
http://www.maff.go.jp/j/wpaper/w maff/h18/pdf/fy2006 rep.pdf(accessed September 2014).
7. Willet WC. Nutritional epidemiology,2nd ed. New York: Oxford University Press, 1998.
8. Wakai K. A review of food frequency questionnaires developed and validated in Japan. J Epidemiol 2009;19: 1-11.
9. Hayashi K, Mizunuma H, Fujita T, et al. Design of the Japan Nurses Health Study: a prospective occupational cohort study of women s health in Japan. Ind Health 2007; 45:679-86.
10. Sakai T, Kogiso M. Soy isoflavone and immunity. J Med Invest 2008;131:2741-2747.
11. Wada K, Nakamura K, Tamai Y, et al. Soy isoflavone intake and breast cancer risk in Japan:from the takayama study. Int J Cancer 2013;133:952-960.
12. Yamamoto S, Sobue T, Kobayashi M, et al. Soy, iso-flavones,and breast cancer risk in Japan. J Natl Cancer Inst 2003;95:906-913.
13. Yamamoto S, Sobue T, Sasaki S, et al. Validity and reproducibility of a self-Administered food-frequency ques-tionnaire to assess isoflavone intake in a Japanese popula-tion in comparison with dietary records and blood and urine isoflavones. J Nutr 2001;131:2741-2747.
14. Ministry of Health, Labour and Welfare. Food and Nutri-tion in Health Japan21.
http://www1.mhlw.go.jp/topics/kenko21 11/b1.html (ac-cessed September 2014)[Japanese]
15. Ministry of Agriculture,Forestry and Fisheries,Ministry of Health, Labour and Welfare, Ministry of Education, Cul-ture, Sports, Science and Technology. The Dietary Guide-line 2000.
http://www.maff.go.jp/j/syokuiku/minna navi/guide/ index.html (accessed September 2014)[Japanese] 16. Sasazuki S,Inoue M,Iwasaki M,et al. Intake of n-3 and n-6
polyunsaturated fatty acids and development of colorectal cancer by subsite: Japan Public Health Center-based pro-spective study. Int J Cancer 2011;124:1644-1649.
17. Sawada N,Inoue M,Iwasaki M,et al. Consumption of n-3 fatty acid and fish reduces risk of hepatocellular carcinoma. Gastroenterology 2012;142:1468-1475.
18. Iso H, Kobayashi M, Ishihara J, et al. Intake of fish n-3 fatty acid and risk of coronary heart disease among Japanese: the Japan Public Health Center-Based (JPHC) Study Cohort I. Circulation 2006;113:195-202.
19. McAfee A, McSorley E, Cuskelly G, et al. Red meat consumption:an overview of the risks and benefits. Meat Sci 2010;84:1-13.
20. Mekary RA,Giovannucci E,Cahill L,et al. Eating patterns and type 2 diabetes risk in older women:breakfast consump-tion and eating frequency. Am J Clin Nutr 2013; 98: 436-443.
21. Ruxton CH, Kirk TR. Breakfast:a review of associations with measures of dietary intake,physiology,and biochemis-try. Br J Nutr 1997;78:199-213.
22. Yoshimura Y. Excel Eiyo-kun. Ver. 4.5. Tokyo: Kenpa-kusya, 2005.[Japanese]
23. Resource Council, Science and Technology Agency, Gov-ernment of Japan. Standard Tables of Food Composition in Japan, fifth revised and enlarged edition. Tokyo:Print-ing Bureau, Ministry of Finance, 2005.[Japanese] 24. The Japan Dietetic Association (ed). Nutrition education
and food education practice using (Food Valance Guide). Tokyo:daiichi-shuppan. co. jp, 2012.[Japanese] 25. Colditz GA,Willett WC,Stampfer MJ,et al. The influence
of age, relative weight, smoking, and alcohol intake on the reproducibility of a dietary questionnaire. Int J Epidemiol 1987;16:392-398.
26. Watanabe M,Tsugane S,Sobue T,et al. Ministry of Health and Welfare, multi-purpose cohort baseline data. Tokyo: Japan Public Health Association, 1996.[Japanese] 27. Hunter DJ, Sampson L, Stampfer MJ, et al. Variability in
portion sizes of commonly consumed foods among a popu-lation of free-living women. Am J Epidemiol 1988; 127: 1240-1249.
28. Siegl KJ,Fan J,Sabate J,et al. Race-specific validation of food intake obtained from a comprehensive FFQ: the Adventist Health Study-2. Public Health Nutr 2011; 14: 1988-1997.
29. Hebert JR, Clemow L, Pbert L, et al. Social desirability bias in dietary self-report may compromise the validity of dietary intake measures. Int J Epidemiol 1995;24:389-398. 30. Heady JA. Diets of bank clerks. Development of a method of classifying the diets of individuals for use in epidemiological studies. J R Statist Soc 1961;124:336-371. 31. Yoshizaki T, Tada Y, Kodama T, et al. Influence of shiftwork on association between body mass index and lifestyle or dietary habit in female nurses and caregivers. J Jpn Soc Nutr Food Sci 2010;63:161-167.[Japanese] 32. Takagi K. Influence of shift work on time and frequency of
meal taking. J Hum Ergol 1972;1:195-205. Evaluation of the FFQ for Japanese Working Women