Coexistence curve of polystyrene in methylcyclohexane. IX. Pressure
dependence of tricritical point
Toshiaki Dobashi and Tetsuya Koshiba
Department of Biological and Chemical Engineering, Faculty of Engineering, Gunma University, Kiryu, Gunma 376, Japan
Mitsuo Nakata
Department of Polymer Science, Faculty of Science, Hokkaido University, Sapporo 060, Japan
~Received 31 January 1996; accepted 7 May 1996!
The effect of pressure on the tricritical point ~TCP! of a ternary system, polystyrene ~PS!I1PSII1methylcyclohexane, was studied by numerical analysis of the generalized Flory– Huggins equation for the Gibbs free energy. For the ternary system, the molecular weight of PSII
M2t, total volume fraction of PSfst, volume fraction of PSIIwith respect to total volume of PSj2t, and temperature Ttat TCP were calculated for various values of the molecular weight of PSIM1 in the pressure range from 0 to 100 MPa. As M1 increases, the ratio rt5M2t/ M1andfstdecrease, while Tt andj2t increase monotonically irrespective of p. The curves of rt andfst vs p have a maximum, while the curves of Ttandj2t vs p have a minimum, irrespective of M1. For small M1 these curves are nearly flat and roughly symmetrical with respect to the extrema. From these calculated results it is predicted that the tricritical solution at atmospheric pressure remains very near the tricritical state along the cloud-point curve in the temperature vs pressure diagram. © 1996 American Institute of Physics. @S0021-9606~96!50531-3#
I. INTRODUCTION
Systems of polymer homologs in a solvent are appropri-ate to comprehensive studies of phase equilibrium, because the phase behavior may vary with changes in the molecular weight Mi of the polymer homolog i and be analyzed by using the Flory–Huggins ~FH! equation for the Gibbs free energy,1–3in which only the parameter g for interaction be-tween polymer and solvent is taken into account. For ternary systems of two polymer homolog with molecular weights M1and M2(.M1) in a solvent, analysis of the original FH equation predicts three-phase separation, when the molecular weight ratio, r5M2/ M1, exceeds a critical value r'10.2,3 For bimodal polyethylene4 and bimodal polystyrene solutions5 the three-phase separation was observed in the temperature range indicated by analysis of the FH equation with the empirically determined parameter g. A ternary sys-tem which has a critical value of r is a tricritical syssys-tem in which the upper critical end point~UCEP! and lower critical end point~LCEP! coincide, to yield a tricritical point ~TCP!.3 In a previous study using bimodal polystyrene ~PS! in methylcyclohexane ~MCH! we determined the three-phase coexistence curve by a refractive index method.6 The ob-served S-shaped coexistence curve was symmetrical about the midpoint and the two diameters corresponding to UCEP and LCEP were parallel to each other in a diagram of tem-perature vs total volume fraction of PS.7 The symmetry of the coexistence curve was considered to be due to the tric-ritical phenomena, although the ratio r541.6 of the system was much larger than the critical ratio '10 predicted from the original FH theory. Sundar and Widom determined the three-phase equilibrium points for ternary systems of bimo-dal PS in cyclohexane for different values of the ratio r.8The temperature difference between the LCEP and UCEP
dimin-ished with decreasing r and the critical value of r was sug-gested to be near 25. Broseta9analyzed the size of the three-phase region as a function of r using the FH equation and estimated the tricritical value to be between 20 and 25 from the plot of Dtc52DT/(Q2T1c) against r, where DT de-notes the difference between the upper and lower limiting temperatures for the three-phase region, Q the Q tempera-ture, and T1c the critical temperature of the solvent-smaller molecular weight PS. Shen et al.10 determined the coexist-ence curves for the ternary system of bimodal PS in methyl-cyclohexane and obtained rt523 for M1540 000 by the plot of (DT/Tt)2/3against r.
It is difficult to locate the TCP experimentally for a ter-nary system of a bimodal polymer in a solvent since the variablesfs,j2, and T as well as r must have unique values which satisfy the tricritical condition. Consequently, the phase equilibrium properties near TCP cannot be measured precisely. Therefore, we have carried out numerical analyses of the critical line and the two-phase coexistence curve near TCP for bimodal PS in MCH using the empirically deter-mined parameter g.11
Recently, we measured the pressure dependence of the critical point of the binary system PS1MCH for different PS molecular weights and located the critical double point at a minimum of the critical line.12 The behavior of the critical lines allowed us to determine the pressure dependence of the parameter g. In this work, we have calculated the pressure dependence of the TCP of the ternary system PSI1PSII 1MCH for different PSI molecular weights by using the parameter g. The ternary system was found to have two TCPs at lower and higher pressures. The numerical calcula-tion of the TCP using the empirically determined parameter
2906 J. Chem. Phys. 105 (7), 15 August 1996 0021-9606/96/105(7)/2906/4/$10.00 © 1996 American Institute of Physics Downloaded¬11¬Oct¬2007¬to¬210.151.113.98.¬Redistribution¬subject¬to¬AIP¬license¬or¬copyright,¬see¬http://jcp.aip.org/jcp/copyright.jsp
g may provide a useful guide for experimental studies in future.
II. CALCULATION
The Gibbs free energy of mixing per unit volume for the system PS homologs1MCH is given by1,12,13
DG/~RT!5f0 lnf01
(
i ~fi /mi!lnfi1gf0fs, ~1! g5g01gp, ~2! g05a1~b01b1/T1b2T!/~12gf!, ~3! gp5~a/T!~11bT!@p2c~11dT!p2#, ~4! with a520.1091, b0520.5832, b15278.6 K,b251.69531023 K21, and g50.2481, a50.434 K MPa21, b520.003 94 K21, c50.0823 MPa21, and d520.002 98 K21. Here, f0,fi, andfs are the volume fractions of the solvent, polymer homolog i, and total polymer, respectively. T is the absolute temperature, R the gas constant, and mithe chain length of polymer homolog i. The tricritical condition of the ternary system is expressed as11,14
S
]nG 1 ]f1 nD
T, P,G2 50 ~n51 – 4! ~5! andS
]5G 1 ]f1 5D
T, P,G2 .0, ~6! with Gi5S
]DG ]fiD
T, P,f jÞi .For a ternary system of two homologous polymers in a solvent with chain lengths m1 and m2, analysis of the origi-nal FH equation revealed that the tricritical condition was satisfied at a unique value rtof the ratio r5m2/m1.
2,3 This is also the case for the ternary system PSI1PSII1MCH with free energy given by Eq.~1!, in which the parameter g has a fdependence.11The critical line Tc5Tc(f1c,f2c) for two-phase equilibrium at constant m1, m2, and p can be calcu-lated using Eq. ~5! (n51,2) for the ternary system. Along the critical line, Eq.~5! (n53) has no solution for r,rtand two solutions for r.rt for given m1 and p. The ratio r at which the two solutions coincide is a tricritical ratio rt, be-cause Eq. ~5! (n54) and Eq. ~6! are satisfied at this ratio simultaneously. Thus, the chain length m2, temperature and volume fractionsfi (i51,2) at the TCP can be determined for given m1 and p using Eq. ~5!. By repeating the above calculation, the TCP was determined in the pressure range from 0 to 100 MPa for m1550, 100, 500, 1000, 5000, and 10 000.
III. RESULTS
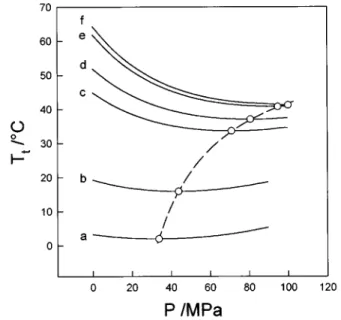
Figures 1–4 show the calculated pressure dependence of Tt, rt,fst, andj2t at the selected values of m1, where the subscript t denotes the value at the tricritical point. In Fig. 1, Ttis observed to increase monotonically with increasing m1. All of the curves have a minimum. Both the pressure and the temperature at the minimum point increase with increasing m1. The locus of the minimum points is given by
pt2152c
8
~11d8
Tt!. ~7!The coefficients c
8
and d8
were determined as c8
50.083160.0006 MPa21 and d8
520.002 9960.000 01 K21by a least squares method. Figure 2 shows rt as a func-tion of p for the selected values of m1. rt decreases with increasing m1 irrespective of p. As indicated by the open circle, each curve has a maximum, which shifts to higher pressure with increasing m1 with an S-shaped locus. As shown in Figs. 3 and 4, as m1 increases,fstdecreases whilej2tincreases monotonically irrespective of p. The changes in
fstandj2twith changing pressure are very small, although
fsthas a maximum and j2t has a minimum with respect to p. Each curve in Figs. 1–4 has an extremum at around the same value of p for the same value of m1. Each might be roughly symmetrical with respect to its extremum, when the calculation would be extended to higher pressures.
IV. DISCUSSION
Figures 1–4 show the behavior of the TCP as a function of the chain length m1 and pressure p. The m1dependencies of Ttandfstat zero pressure can be compared with those of the critical temperature Tcand critical volume fractionfcof the binary system PSI1MCH, respectively. In Fig. 5 Ttand FIG. 1. Tricritical temperature as a function of pressure at chain lengths
m1550 ~curve a!, 100 ~b!, 500 ~c!, 1000 ~d!, 5000 ~e!, 10 000 ~f! for the
system PSI1PSII1MCH. Open circles show minimum. Dashed curve is
described by using Eq.~7!.
2907 Dobashi, Koshiba, and Nakata: Coexistence curve of polystyrene in methylcyclohexane. IX
J. Chem. Phys., Vol. 105, No. 7, 15 August 1996
fstare plotted against the logarithm of m1 with open circles and filled circles, respectively, at p50. The broken curves a and b, which illustrate the plots of Tcandfcagainst m1 for the binary system PSI1MCH, were calculated using Eqs. ~1!–~4! at p50. The points for Ttandfstbehave in a simi-lar way to curves a and b, respectively. Figure 4 shows that j2t is less than 0.01 and changes slightly with m1. These observations indicate that the TCP is located near the critical point of the binary system PSI1MCH with a somewhat higher temperature and larger volume fraction in the tem-perature vs total volume fraction diagram.11 The pressure
dependence of the TCP also resembles that of the critical point of the binary system PSI1MCH. The critical volume fraction was independent of pressure and the critical line given by Tc vs pc had a shallow minimum which shifted to higher pressure and higher temperature with increasing chain length.12The shift of the minimum point was represented by an expression similar to Eq. ~7! but with slightly different coefficients,
FIG. 5. Tricritical temperature Tt ~open circle s! and tricritical volume fraction fst~filled circle d! at p50 as a function of logarithm of chain length m1. Broken curves a and b represent plots of critical temperature Tc and critical volume fraction fc vs chain length m1 for the system PSI
1MCH, respectively, at p50. FIG. 2. Tricritical chain-length ratio rt as a function of pressure at chain
lengths m1550 ~curve a!, 100 ~b!, 500 ~c!, 1000 ~d!, 5000 ~e!, 10 000 ~f! for
the system PSI1PSII1MCH. Open circles indicate maximum.
FIG. 3. Tricritical volume fractionfstof total PS as a function of pressure at a chain lengths m1550 ~curve a!, 100 ~b!, 500 ~c!, 1000 ~d!, 5000 ~e!,
10000~f! for the system PSI1PSII1MCH.
FIG. 4. Tricritical volume fractionj2tof PSIIin total PS as a function of
pressure at chain lengths m1550 ~curve a!, 100 ~b!, 500 ~c!, 1000 ~d!, 5000
~e!, 10 000 ~f! for the system PSI1PSII1MCH. 2908 Dobashi, Koshiba, and Nakata: Coexistence curve of polystyrene in methylcyclohexane. IX
J. Chem. Phys., Vol. 105, No. 7, 15 August 1996
c50.0823 MPa21and d520.002 98 K21. The extremum is referred to as a critical double point, at which the coexistence curve shows interesting behavior.
It should be noted that each Tt vs Pt curve in Fig. 1 is composed of ternary systems with various values of m2 which satisfy the tricritical condition for a given value of m1. rt5(m2/m1)tis shown in Fig. 2. Therefore, the Ttvs Pt curves are not easily accessible in experimental studies. However, we can anticipate interesting phenomena from the curves in Fig. 2. The rt vs Pt curves have maxima as indi-cated by the open circles. Curves a and b suggest that a tricritical solution at atmospheric pressure PLmay be a tric-ritical state again at a higher pressure PU at which rt be-comes equal to rt at atmospheric pressure. The tricritical values of T, fs, and j2 at the upper tricritical pressure PU are slightly different from those at the lower tricritical pres-sure PL as seen in Figs. 1, 3, and 4, respectively. Between the two pressures PU and PL the solution cannot separate into three phases because of r,rt.
With decreasing m1, the maxima of the curves in Fig. 2 shift to lower pressure and the curves become flat. In the pressure range used in the calculation, rt of curve b takes values between 13.127 and 13.197, which correspond to val-ues between 1.7983105 and 1.8083105 for the molecular weight of PSII. Here, the chain length m is calculated from the molecular weight M using M5137m. In usual experi-ments, this variation in the molecular weight is negligibly
small and obscured by the molecular weight distribution. For low m1 the variations in fst andj2t with pressure are also very small. Therefore, the cloud-point curve, which can be determined for a tricritical solution at PL as the locus of precipitation temperature vs pressure, can be taken practi-cally as a tricritical line. The tricritical solution at the pres-sure PL remains very near the tricritical state along the cloud-point curve. It is difficult to predict the behavior of the cloud-point curve at pressures higher than PUbecause of the appearance of three-phase separation.15
1P. J. Flory, Principles of Polymer Chemistry~Cornell University, Ithaca,
NY, 1953!, Chap. XII.
2H. Tompa, Trans. Faraday Soc. 45, 1142~1949!. 3K. Sˇolc, J. Polym. Sci. Polym. Phys. Ed. 20, 1947~1982!.
4R. Koningsveld and A. J. Staverman, Kolloid Z. Z. Polym. 220, 31~1967!. 5R. Koningsveld, L. A. Kleintjens, and A. R. Shultz, J. Polym. Sci. A-2 8,
1261~1970!.
6T. Dobashi and M. Nakata, J. Chem. Phys. 84, 5775~1986!. 7M. Nakata and T. Dobashi, J. Chem. Phys. 84, 5782~1986!. 8G. Sundar and B. Widom, Fluid Phase Equilibria 40, 289~1988!. 9
D. Broseta, J. Chem. Phys. 91, 1897~1989!.
10W. Shen, G. R. Smith, C. M. Knobler, and R. L. Scott, J. Chem. Phys. 94,
7943~1990!.
11T. Dobashi and M. Nakata, J. Chem. Phys. 99, 1419~1993!.
12H. Hosokawa, M. Nakata, and T. Dobashi, J. Chem. Phys. 98, 10078
~1993!.
13T. Dobashi, M. Nakata, and M. Kaneko, J. Chem. Phys. 72, 6692~1980!. 14J. T. Bartis, J. Chem. Phys. 59, 5423~1973!.
15R. B. Griffiths, J. Chem. Phys. 60, 195~1974!.
2909 Dobashi, Koshiba, and Nakata: Coexistence curve of polystyrene in methylcyclohexane. IX
J. Chem. Phys., Vol. 105, No. 7, 15 August 1996