T his doc ument is downloaded at: 2018-03-23T 18:12:08Z
T itle
UA V を用いた鬼木棚田でのマイクロスケールな蒸発散推定
A uthor(s )
谷口, 幸弥; 日高, 悠広; 永渕, 嵩; 春成, 寿郎; 小川, 進
C itation
長崎大学大学院工学研究科研究報告, 48(90), pp.70-75; 2018
Is s ue D ate
2018-01
UR L
http://hdl.handle.net/10069/37941
R ig ht
NA O S IT E : Nag as aki Univers ity's A c ademic O utput S IT E
UAV
を 用 い た 鬼 木 棚 田 で の マ イ ク ロ ス ケ
ル な 蒸 発 散 推 定
谷 口 幸 弥
*
日 高 悠 広
*
永 渕
嵩
*
春 成 寿 郎
*小 川 進
* *EVAPOTRANSPIRATION ESTIMATE IN MICROSCALE AT ONIGI RICE
TERRACES USING UAV
by
Yukiya Taniguchi*, Haruhiro HIDAKA*, Takashi NAGAFUCHI*, Toshiro HARUNARI*,
Susumu OGAWA*
Life and livelihood of Onigi rice terraces declined by cultivation abandonment and crop
conversion in Hasami town. As the rice terraces were developed on the slopes, the area in rice terraces
is small and its productivity is lower than flatland paddy fields. Therefore, und erstanding the
conditions of vegetation, the water balance and land uses are important for Onigi rice terraces. Land
cover maps are required in many places including rice terraces si nce 66% of Japan is covered with
forests. On the other hand, in recent years, the spread of a UAV progressed rapidly. A UAV is used in
many fields. Images of a UAV are higher resolution than aerial photographs of satellites, and the
photographs could be repeated easily. Land cover classification of vegetation and water areas can be
done from RGB and infrared images. A UAV has automatic navigation functions, and the air dose rate
was measured even in places where human intrusion was difficult. In this study, annual analysis of land
covers was carried out with a UAV automatic navigation for Onigi rice terraces in Hasami Town. First,
a UAV route map of Onigi rice terraces was made with automat ic navigation software. Next, in April,
June and July of 2017, a UAV flew over the rice terraces. 5-band images of visible range and near
infrared were acquired with IR filters. 3D models and orthographic images were created from these
5-band aerial images. Spatial The distributions of NDVI and evapotranspiration were calculated with
GIS software from the orthographic images. Their seasonal changes wer e examined from calculated
NDVI and evapotranspiration spatial distributions.
Key words: Evapotra nspira tion, NDVI, Photogra mmetry, SfM-MVS
1. INTRODUCTION
In Onigi rice terraces existing in Hasami-town, agriculture is declining. Farm work by machines and people access are difficult because the rice terraces exist in in a sloping ground. The rice terrace growth control is more difficult than flat paddies (1). Therefore, for time-series change of the vegetation, the moisture contents and evapotranspiration in the rice terraces are required. On the other hand, in recent years, the spread of a UAV progressed rapidly. A UAV became popular in the fields of earth science and archeology (2).Compact digital cameras
mounted on a UAV have much higher resolution than aerial photographs of traditional aircrafts. The shooting was
repeated spatially (2). A UAV was used for a long flight by general users with high performance of batteries, the weight reduction of aircrafts, and higher precision of GPS and IMU (3). Small size GPS automatic recording systems with high portability, and general versatility were installed at low cost, and the air dose rate was measured.A spatial
dose distribution was measured over places where the access was difficult by a small UAV (4).UAV survey with
automatic navigation can be done in complicated terrains. The aerial images become three-dimensional using a SfM-MVS software. High-resolution terrain images were obtained and analyzed (2). Ortho mosaic images and DSM of several-cm-level spatial resolution were obtained from
平成29年12月28日受付
3D models (4). By computing these data with GIS software, landslide collapses, vegetation, and hydrological balance were analyzed. In this study, creating time-series of change of the vegetation, the evapotranspiration were examined using UAV automatic navigation in Onigi rice terraces from April 2 to September 18, 2017.
Fig 1. Horizontal image in Onigi rice terrace.
2. METHODS
2.1 Automatic navigation map
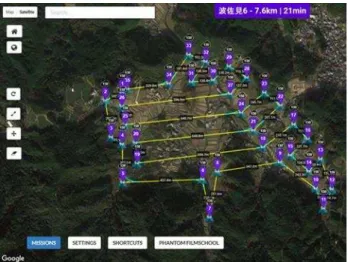
In this study, Litchi for DJI was used to create an automatic navigation route map of Onigi rice terraces. The UAV route map is shown in Fig. 2. For all routes, the altitude was fixed at 150-m height. The speed was set by 28 km/h. In July and September survey, the camera was set by automatic shoot every 2 seconds. The flight time was 21 minutes and the total flight distance was 7.6 km with the consumption of the battery at 70%.
Fig 2. UAV route map using Litchi for Onigi rice
terraces.
2.2 UAV
On April 2 and 23, June 10, July 22, and September 18, 2017, the authors visited Onigi rice terraces in Hasami-town. Aerial images of RGB and near infrared were taken by the UAV. The infrared images was taken by attaching infrared filters to the UAV lens cover.
Table 1. Band classification
2.3 3D analysis
Based on 6-dimensional information of the images with color and GPS from the obtained aerial images, 3D models were created using PhotoScan. If alignment and high-density cloud construction are "high" or more, the analysis takes a huge amount of time because the number of images was large and the shooting range was wide. In addition, 3D construction might have concentrated on places where photographing was frequent. Therefore, in this study, all alignment and high-density cloud construction were set by "medium". This analysis was done each RGB and near infrared. Synthetic orthophotos with were created from these three dimensional models.
2.4 GIS analysis
2.4.1 NDVI
Spatial distribution maps of NDVI were created from orthophotos of RGB and near infrared using ArcGIS function. NDVI means Normalized Difference Vegetation Index. This vegetation index was calculated using difference between red and near infrared. Plants absorbed much red light and emitted much near infrared light. The vegetation distribution maps were created by subtracting the red images from the near infrared images of RGB image from the near-infrared image. The calculation formula of NDVI is expressed by (1). Band 3 was red color of visible light. Band 4 was near infrared. Band 5 was short
Band Wavelength (nm) Color
1 400-500 Blue
2 500-585 Green
3 585-760 Red
4 760-900 Near infrared
5 900< Short infrared
71
wavelength infrared. NDVI will be corrected with MODIS data.
NDVI =���� − �������� + ���� (1)
2.4.2 Evapotranspiration
According to the study by Dan (2017) (10), between evapotranspiration and NDVI has a positive correlation. The regression equation is expressed by (2). Where x NDVI, y is evapotranspiration (mm/month). This regression equation corresponded to the climate of the Mekong Delta. A correction coefficient was required to calculate of evapotranspiration for Onigi rice terraces from this equation. The correction coefficient was calculated using the annual average temperature and annual average humidity of both Mekong Delta and Nagasaki. From their temperature and humidity, two representative values of evapotranspiration in Mekong Delta and Nagasaki were calculated using Tetens equation. The evapotranspiration of Nagasaki was divided by the evapotranspiration of Mekong Delta. This value was used for a correction coefficient.
= 99.7 + . 7 (2)
3. RESULTS
Figs. 3 and 4 show distribution maps of RGB images and NDVI for Onigi rice terraces on April 2 and 23, 2017. Figs. 5 and 6 show other distribution maps of RGB images, NDVI, and evapotranspiration for Onigi rice terraces on June 10 and July 22, 2017. Figs. 7 and 8 show ordinal camera images of RGB, NDVI and evapotranspiration (mm/day) distributions on July 15, 2017. Each flight time was only for 20 minutes and the spatial resolution was approximately nine cm per pixel.
3.1 NDVI
From Figs 3 to 7, NDVI changes from April to September, NDVI was low in rice terraces until June. In July data, NDVI was high after rice planting was completed. Differences between places with and without rice were identified in NDVI distribution maps. In NDVI horizontal images of Figs. 7 and 8, the vegetation index of July data was higher than that of September data.
3.2 Evapotranspiration
In the evapotranspiration distribution maps, only vegetation areas were extracted. In June 10, evapotranspiration of forests were calculated with regression equation (2). The evapotranspiration was not calculated in paddy rice area because rices were not planted and NDVI was negative values. The rice areas were covered with water on June 10. However, the evapotranspiration of rice fields were calculated from the average temperature and humidity on June 10 for Nagasaki using Tetens equation. The evapotranspiration was 1.10 mm/day. On July and September 18, evapotranspiration distributions in wide range were calculated by one image because vegetation areas increased. From ordinal camera images in Figs. 7 and 8. In paddy fields, the vegetation index of September was lower than that of July. While, the forest vegetation index of September was higher than that of July.
4. DISCUSSION
4.1 Weather conditions
Vegetation and evapotranspiration distributions in microscale were estimated easily by only one UAV. Different biomass per plant is estimated from these evapotranspiration distributions. These images were higher resolution which has several centimeters than satellite data. Meanwhile, in June and July, there were blue parts in several places outside. These were parts where 3D models of near-infrared images were not obtained by camera vibration and darkness. Compared with RGB images, infrared images are more likely to vibration and darkness. In September, a 3D model of near-infrared image was created. But some errors occurred in NDVI distribution because the weather was cloudy. If the shooting part is shadowed, infrared light reflectance becomes weaker. Thus, this UAV method was quasi-all-weather-type and not used for cloudy or a little rainy. However, these images were also taken using the ordinal digital camera by attaching infrared filters. These filters are purchased by 10 or 20 dollars. Photogrammetry using digital camera is conducted all-weather-type even cloudy or a little rainy condition. Evapotranspiration was also obtained in microscale using ordinal camera easily. This method was used at any time according when a researcher wants to measure
NDVI distribution images were difference images which were subtracted by red and near infrared images. For this reason, to research vegetation seasonal change of Onigi
rice
Fig 3. RGB and NDVI distributions on April 2, 2017.
Fig 4. RGB and NDVI distributions on April 23 2017.
4.45 0.94
Fig 5. RGB, NDVI and evapotranspiration (mm/day) distributions on June
73
0.98 4.42
Fig 6. RGB, NDVI and evapotranspiration (mm/day) distributions on July 22, 2017.
4.32 0.91
Fig 7. Ordinal camera images of RGB, NDVI and evapotranspiration (mm/day) distributions on July 15, 2017.
4.42 1.50
terraces using these data, NDVI has to be corrected. Correction coefficients would be created from the average value of NDVI obtained in this study and NDVI values of MODIS data. NDVI will be corrected with this method in the future.
5. CONCLUSIONS
Complex terrain survey was measured by a UAV in three-dimensions. Furthermore, the spatial distributions of NDVI and evapotranspiration were obtained. In this study, by attaching infrared film on camera lens, arbitrary different wavelengths were taken with only one UAV. As a result, the biomass of plants was measured quantitatively from NDVI and evapotranspiration in Onigi rice terraces too. UAV was lower price, higher resolution and quasi-all-weather-type than satellite images. In addition this method using infrared filter was also applied for the ordinal camera. In the case of the ordinal camera method, the photogrammetry was all-weather-type. Therefore, species and biomass quantity per microscale plant and the water balance, which were not measured with conventional satellite data, and the water balance could be estimated.
REFERENCES
1) T. Nagafuchi, Y. Imamura, S. Ogawa, 2017, A study on the landscape characteristic of Onigi rice terraces in Hasami town, NAOSITE, 47(89), pp.87-92.
2) S. Ishiguro, Y. Kumahara, H, Goto, T. Nakata, N. Matsuta, N. Sugino, D. Hirouchi, M. Watanabe, 2016, Evakuation of high-resolution digital surface models of surface rupture associated with the 2014 Kamishiro fault earthquake, central, Japan, using unmanned aerial vehicle photography and SfM-MVS analysis, Journal of The Remote Sensing Society of Japan, 36(2), pp. 107-116. 3) K. Sakai, R. Yamamoto, K. Hasegawa, T. Izumi, H. Matsuyama, 2016, Generation of a DSM of the forest crown by vertical+oblique stereo pair images taken by a small-sized UAV, Journal of The Remote Sensing Society of Japan, 36(4), pp. 388-397.
4) A. Hama, K. Tanaka, H. Yamaguchi, A. Kondo, 2017, Dose rate mapping by small UAV to radioactive contamination area, Journal of The Remote Sensing Society of Japan, 37(1), pp. 13-20.
5) S. Otsubo, S. Ogawa, H. Hidaka, G. Yamada, 2016, Present state of UAV and applications for civil engineering, NAOSITE, 46(86), pp. 43-49.
6) G. Yamada, S. Ogawa, S. Otsubo, and H. Hidaka, 2016, Simulation of disaster research with UAV on Kumamoto Earthquake, Asian Conference on Remote Sensing, 37. 7) S. Otsubo, S. Ogawa, H. Hidaka, Y. Imamura, 2017, Survey on the vegetation cover and irrigation for rice terrace with UAV, NAOSITE, 47(88), pp. 7-12.
8) H. Mizuochi, T. Hiyama, H. Kanamori, T. Ota, Y. Fujioka, M. Iijima, K. K. Nasahara, 2016, Water storage monitoring of seasonal wetlands in a semi-arid environment by the integrated use of long-term satellite images and UAV topography measurement, Journal of The Remote Sensing Society of Japan, 36(2), pp. 81-92. 9) Research Group for High-resolution Satellite Remote Sensing, 2016, High resolution satellite remote sensing for the disaster of the 2016 Kumamoto earthquake,