D
i s c r i m
i nat i on of Cher enkov l i ght i n Li qui d
Sc i nt i l l at or f or N
eut r i nol es s D
oubl e Bet a
D
ec ay Exper i m
ent
著者
FU
KU
D
A Yos hi yuki , KAM
EI Yut o, N
ar enger i l e,
O
BATA Aki r a, M
O
RI YAM
A Shi get aka, O
G
AW
A I z um
i ,
G
U
N
J I Takahi r o, H
AM
AYA Ryohei , TSU
KAD
A Sat or u
雑誌名
宮城教育大学紀要
巻
52
ページ
139- 147
発行年
2018- 01- 31
Discrimination of Cherenkov light in Liquid
Scintillator for Neutrinoless Double Beta Decay
Experiment
*FUKUDA Yoshiyuki, *KAMEI Yuto , *Narengerile , *OBATA Akira **MORIYAMA Shigetaka, ***OGAWA Izumi
****GUNJI Takahiro, ****HAYAMI Ryohei and ****TSUKADA Satoru
Abstract
A liquid scintillator containing a tetrakis(isopropyl acetoacetato)zirconium has been developed for ZICOS experiment. We will use 180 tons of liquid scintillator containing 75 kg of 96Zr in the inner balloon(45 kg in
iducial volume)surrounding 64 % photo coverage of 20 inch photomultiplier. In order to reach the sensitivity ≥1027 years, we have to reduce 95 % of 208Tl decay backgrounds at least. Using Monte Carlo simulation, we could
demonstrate new method using the hit pattern of PMT which received Cherenkov light, and could reduce 93 % of 208Tl background with 78 % eiciency for 0νββ signal. For the discrimination of Cherenkov light, we measured
the timing pulse shape of Zr loaded liquid scintillator using FADC digitizer, and we found an inconsistent pulse shape at the rise timing with the template of scintillation. Also the event with an inconsistent pulse shape seems to have a directionality.
Key words:Neutrinoless Double Beta Decay (ニュートリノを放出しない二重ベータ崩壊) Neutrino Mass(ニュートリノ質量)
Liquid Scintillator (液体シンチレータ) Cherenkov Light (チェレンコフ光) Pulse Shape Discrimination (波形分別法)
* Department of Physics, Faculty of Education, Miyagi University of Education, Sendai, Miyagi 980-0845, Japan ** Kamioka Observatory, Institute for Cosmic Ray Research, The University of Tokyo, Hida, Gifu, 506-1205, Japan *** Applied Physics, Faculty of Engineering, University of Fukui, Fukui, Fukui, 910-8507, Japan
1. ZICOS experiment
We have proposed a new experiment, ZICOS, for neutrinoless double beta decay (0νββ) search using nucleus 96
Zr with the sensitivity T10/ν2 ≥ 10 27
years [1]. 96
Zr has third highest Q-value (3.35 MeV) among possible 0νββ isotopes, therefore, in general, the radioactive backgrounds such as 214
Bi in U series and 10
C, which is spallation product of energetic cosmic muon, could be avoidable due to their lower energy.
We will use total 180 tons of liquid scintillator containing 10 wt.% concentration of a tetrakis (isopropyl acetoacetato) zirconium (Zr(iprac)4), which includes 72 kg (45 kg in fiducial volume)
of 96
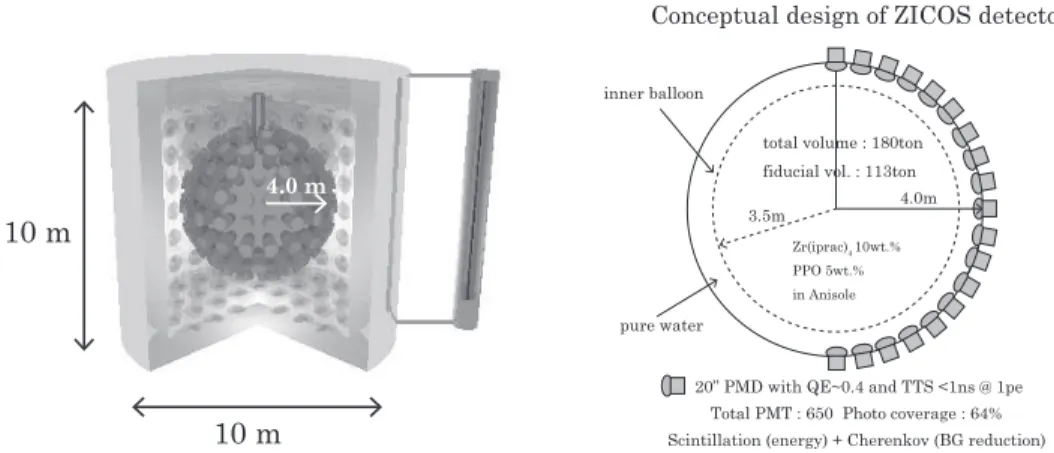
Zr assuming 2.8 % natural abundance, inside of the balloon. The inner balloon (3.5 m in radius) is located in the spherical detector (4.0 m in radius) which has 64 % of photo coverage of 20 inch photomultiplier (PMT). The outer region of the inner balloon will be filled with an ultra pure water which has almost same density as Anisole. This is very important for reducing backgrounds due to208
Tl decay which may adhere to the surface of the balloon as described in next section. The energy resolution is expected to 2.6 % at 3.35 MeV[2].
4.0 m
10 m 10 m
4.0m
Zr(iprac)4 10wt.%
PPO 5wt.% in Anisole
20” PMD with QE~0.4 and TTS <1ns @ 1pe Total PMT : 650 Photo coverage : 64%
Conceptual design of ZICOS detector
Scintillation (energy) + Cherenkov (BG reduction) total volume : 180ton
fiducial vol. : 113ton
3.5m inner balloon
pure water
Figure 1. The left panel shows the global design of the ZICOS detector. The inner detector is
located in pure water tank, and has 650 of 20 inch photomultiplier with 64 % of photo coverage. The right panel shows the conceptual design of the inner detector. The inner balloon will be filled with a liquid scintillator which contains 10 wt.% of Zr(iprac)4 and 5 wt.% of PPO. The
outside of the inner balloon will be filled with an ultra pure water in order to reduce208
Tl decay backgrounds.
2. Background reduction using Cherenkov lights
According to recent results form KamLAND-Zen[3], there found backgrounds around 3.35 MeV, and they were events of 208
Tl decay which was adhere on a surface of the balloon. In the case of KamLAND-Zen, they also used a liquid scintillator for outside of the balloon, therefore they succeeded to reduce 208
Tl backgrounds even though whose vertex remain within their fiducial volume due to measure all energy from 208
Tl decay (Q-value is 4.99 MeV).
On the other hands, ZICOS detector will use pure water instead of liquid scintillator for outside of the balloon, therefore almost half of 208
Tl backgrounds observed in KamLAND-Zen should be reduced by missing the energy. However, another half still exist inside of the balloon. In order to remove those backgrounds to reach the sensitivityT0ν
1/2 ≥2×10
26
years, we have been developed techniques which use Cherenkov light for discrimination of signal and background[2]. Basically 208
Tl decays into exited state of 208
Pb with beta emission, and the transition to the
2
ground state with several gammas emission happens after the beta decay. At least, latter includes 2.6145 MeV gamma. This means that some electrons could emit Cherenkov light from different
position. On the other hands, two electrons emitted by 0νββ also could release Cherenkov lights
but from same position. This difference could be used for the reduction of208
Tl backgrounds.
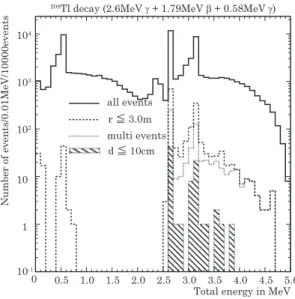
In fact, the Monte Carlo simulation with EGS5, which simulates 208
Tl beta decay with
Emax = 1.7963 MeV, and two gammas emission (Eγ = 2.6145 MeV and 0.5832 MeV), indicates
that about 95 % of 208
Tl backgrounds, whose vertex remains within fiducial volume, could be reduced by the distance of electrons as shown in Fig.2. Instead of vertex reconstruction using
Total energy in MeV 0 0.5 1.0 1.5 2.0 2.5 3.0 3.5 4.0 4.5 5.0 1
10 102
103
Number of events/0.01MeV/10000events
10-1
104
all events
r ≦ 3.0m
multi events d ≦ 10cm
208Tl decay (2.6MeV γ + 1.79MeV β + 0.58MeV γ)
Figure 2. The reduction step of208
Tl events. The solid line shows all generated events by Monte Carlo, the dashed line shows the vertex located within 3.0 m fiducial volume, the dotted line shows the event consists of multi electrons, and the shaded region shows an averaged distance between those electrons to be shorter than 10 cm.
Cherenkov lights, we better to consider the difference of hit pattern of Cherenkov lights between
208
Tl backgrounds and 0νββ signals, since the vertex reconstruction might be difficult using
only Cherenkov lights. However, the vertex could be obtained by scintillation because of large amount of light yield. The vertex should be the center position of light yield weighted for the generated position of electrons. Once we use the vertex position obtained by scintillation, then
we can define an averaged direction ( ˆd) as
ˆ
d≡ nhit∑
i=1 − →
di (1)
where −→di is unit vector to i-th PMT from the vertex position, and nhit is the number of hit
PMT which received Cherenkov lights larger than 1 pe. Using the averaged direction, we can
also define an averaged angle (ˆθ) as
ˆ
θ≡ 1 nhit
nhit∑
i=1
θi (2)
whereθi is the angle between the averaged direction ( ˆd) and the vector
− →
di. This averaged angle
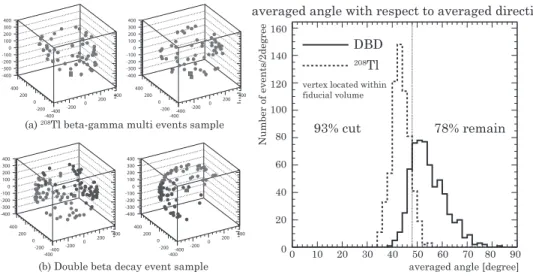
might have a topological information. If we set an averaged angle 48 degree as a cut point, we
can reduce about 93 % of 208
Tl backgrounds with 78 % efficiency for 0νββ signal as shown in
right panel of Fig.3. More detailed explanations are described in Ref.[4].
-400 -200 0 200 400 -400 -200 0 200 400 -400 -300 -200 -100 0 100 200 300 400 -400 -200 0 200 400 -400 -200 0 200 400 -400 -300 -200 -100 0 100 200 300 400 -400 -200 0 200 400 -400 -200 0 200 400 -400 -300 -200 -100 0 100 200 300 400 -400 -200 0 200 400 -400 -200 0 200 400 -400 -300 -200 -100 0 100 200 300 400
(a) 208Tl beta-gamma multi events sample
(b) Double beta decay event sample
0 10 20 30 40 50 60 70 80 90 averaged angle [degree] 20
40 60 80 100
Number of events/2degree
0 120 140 160 DBD 208Tl
vertex located within fiducial volume
averaged angle with respect to averaged direction
93% cut 78% remain
Figure 3. The left panel shows PMT hit pattern of Cherenkov lights for typical (a) 208
Tl decay and (b) 0νββ in case of vertex located within the fiducial volume. The right panel shows that the averaged angle distribution for each case. If we set 48 degree as a cut point, we can reduce 93 % of 208
Tl backgrounds with 78 % efficiency for 0νββ signal.
3. Discrimination of Cherenkov light using pulse shape
Since it is important to measure the energy as precise as possible using scintillation lights for the discrimination of signal and background, we have to distinguish the PMT whether received Cherenkov lights or not even though all PMT received scintillation light. The separation of Cherenkov and Scintillation light is realized by the difference of emission mechanism. Cherenkov radiation is generated by the vibration of an electromagnetic dipole moment, so that the timing spreads during passing time of the charged particle (a few 100 pico seconds). On the other hands, scintillation is the radiation from transition between the exited state and lower state, therefore the timing spreads with a few tenth of nano seconds. In fact, the difference of spectral shape at the rise timing due to Cherenkov light emitted from cosmic muon was really observed in Linear Alkyl Benzene [5].
We had tried to measure such timing of signal using CAEN FADC V1721 digitizer. In order to compare the spectral shape, we had to make a template for scintillation signal. For the measurement of scintillation from electrons, we collimated the 60
Co source and gammas entered at far edge of the vial in parallel direction with respect to the PMT surface in order to avoid incident Cherenkov light to the PMT surface. The template of scintillation was made by following steps. At first, we accumulated many pulses around the Compton edge. Then we got both Mean and RMS using FADC count distribution for each timing bin. At this time, we conventionally fixed the peak position at 60 ns for all pulses. Actually there were two types for template, which was fast timing and delayed timing due to the time resolution of FADC (1 timing bin corresponds to 2 ns). However we showed here only the timing shape which has better chi square in order to avoid the confusion.
The crosses shown in Fig.5 and Fig.8 show the template of scintillation obtained by Anisole and Zr loaded liquid scintillator, respectively. Both templates have about 7 ns of the decay timing.
Next we measured the timing spectral shape of Anisole. In this time, gammas from the 60
an unique direction and energy (1.02 MeV). The PMT was located at 90 degree, which is an angle between the incident gamma and the PMT surface as shown in Fig.4, because the PMT is easy to receive Cherenkov light. The PMT located at 10 degree will be used for checking of the directionality of Cherenkov light as described later.
angle
60Co
NaI detector
LS
BS
γ
γ
electron (1.02MeV)
Cherenkov light
30deg
90deg
10deg
angle
60Co
NaI detector
LS
BS
γ
γ
Cherenkov light
30deg
Figure 4. Configuration of the measurement for Cherenkov light. The PMT was located at 90
and 10 degree which is an angle between the incident gamma from the60
Co source and the PMT surface. The back scattering gamma was detected by NaI detector. The data were triggered by the coincidence of PMT and NaI signal.
Figure 5 shows typical timing pulse shape observed in Anisole. Most of events look like the right panel of Fig.5. The shape is not agree with the template of scintillation, and the shape looks faster both rise and decay timing. Same shape was also observed in pure water as shown in Fig.6, since pure water did not release scintillation. However, we could not confirm that this pulse shape was caused by Cherenkov lights using only these results.
0 5 10 15
0 5 10 15
50 60 70 80 90
time [ns]
50 60 70 80 90
time [ns] event sample #1
template of scintillation data observed in Anisole
event sample #2
FADC count FADC count
template of scintillation data observed in Anisole
Figure 5. Observed timing pulse shape in Anisole. The pulse shale of left panel is consistent with template of scintillation, however number of events was quite small. On the other hands, the pulse shape of right panel shows inconsistent with the template, and most of events are similar to this shape.
In order to remove the effect of scintillation, we used the UV cut filter (product of FUJI FILM Corporation: SC-37), which cuts off the light shorter than 400 nm, for the measurement
0 5 10 15 20
0 5 10 15 20
50 60 70 80 90
time [ns]
50 60 70 80 90
time [ns]
event sample #1 event sample #2
template of scintillation data observed in pure water
template of scintillation data observed in pure water
FADC count FADC count
Figure 6. Typical timing pulse shape observed in pure water. All the events have quite same pulse shape as Anisole and have inconsistent pulse shape with the template, since pure water did not release scintillation.
of timing shape in Anisole. As a results, no scintillation event like left panel of Fig.5 was found, since the peak wavelength of scintillation for Anisole is 300 nm.
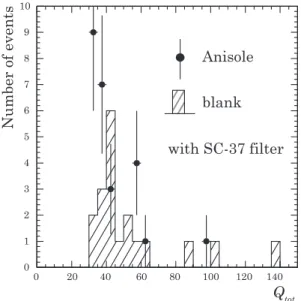
Of course, Cherenkov lights could be emitted by the reaction of incident gammas at the surface of PMT glass or the vial glass, and same pulse shape should be observed even though no Anisole in the vial (blank case). However the comparison of the total charge integrated FADC counts over the entire timing region as follows;
Qtot =
90ns∑
ti=54ns
FADC count(ti) (3)
between the case of Anisole and blank gives us that the event with large charge(Qtot≥50) looks have Cherenkov photons as shown in Fig.7. Therefore we assumed that an observed shape with large pulse height as shown in right panel of Fig.5 mainly consist of Cherenkov light, because of low quantum efficiency of the PMT at the wavelength of scintillation for Anisole.
0 1 2 3 4 5 6 7 8 9 10
Qtot 0 20 40 60 80 100 120 140
Number of events
Anisole
blank
with SC-37 filter
At last, we measured the timing pulse shape for Zr loaded liquid scintillator. Figure 8 shows typical pulse shape mainly observed in liquid scintillator. The left panel of Fig.8 is consistent with the template of scintillation, and about 70 % of events look have this shape. The right panel of Fig.8 shows that the pulse shape at the rise timing statistically inconsistent with the template. If the difference at the rise timing is caused by Cherenkov light, we could extract the
0 20 40 60
50 60 70 80 90 time [ns] event sample #1
FADC count
template of scintillation data observed in Zr loaded LS
0 20 40 60 80
50 60 70 80 90 time [ns] template of scintillation data observed in Zr loaded LS
event sample #2
FADC count
Figure 8. Typical timing pulse shape observed in Zr loaded liquid scintillator. The left panel of shape is consistent with template of scintillation, however, the left panel differ from the template at the rise timing. The template shape was overlaid by best fit position using entire timing of shape.
0 50 100
FADC count
template for scintillation data observed in Zr loaded LS
50 60 70 80 90
time [ns]
0 5 10 15
50 60 70 80 90
time [ns]
FADC count
subtracted
data observed in Anisole
Figure 9. Typical inconsistent timing pulse shape with the template of scintillation observed in Zr loaded liquid scintillator. The left panel of shape is overlaid by template of scintillation with fitting using only decay timing. Therefore the difference at the rise timing looks clearly. Shaded region in left panel corresponds to dashed line in right panel, which is obtained by subtraction of data and template. Solid line is overlaid using the shape observed in Anisole with adjusting the peak position.
shape using subtraction of signal and template as shown in Fig,9. The left panel of Fig.9 shows the typical inconsistent events and the template are overlaid by fitting at the decay timing only (it is not fitted by the entire timing as shown in the right panel of Fig.8). The shaded region shows the difference between data and template, therefore the difference at the rise timing looks clearly. The dashed line in the right panel of Fig.9 shows subtracted shape, and the typical shape observed in Anisole as shown in Fig.5 is overlaid as a solid line. Those shapes look consistent with each other. This means that the inconsistent shape at the rise timing might be caused by Cherenkov light.
7
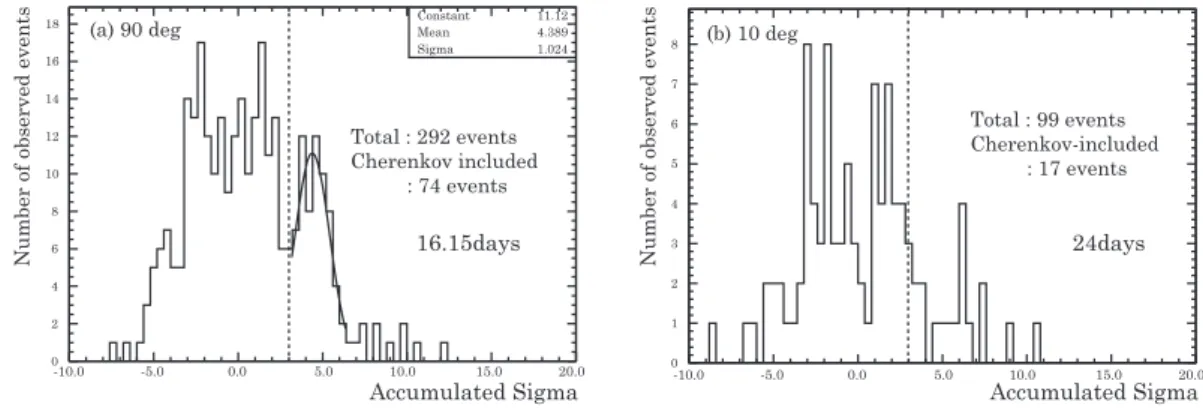
In order to estimate statistically this inconsistency, we might define an accumulated sigma (ACS) which is summing of sigma between data and template at first 3 bins of the rise timing. Figure 10 shows the accumulated sigma distribution in case of 90 degree and 10 degree, which is the angle between incident gamma and the PMT surface, respectively. Latter case means that the PMT might not be easy to receive the Cherenkov light. In the left panel of Fig.10, there is
0 2 4 6 8 10 12 14 16
18 Constant 11.12 Mean 4.389 Sigma 1.024
0 1 2 3 4 5 6 7 8
-10.0 -5.0 0.0 5.0 10.0 15.0 20.0
Accumulated Sigma -10.0 -5.0 0.0 5.0 10.0 15.0 20.0Accumulated Sigma
(a) 90 deg (b) 10 deg
Total : 292 events Cherenkov included : 74 events
Total : 99 events Cherenkov-included : 17 events
16.15days 24days
Number of observed events Number of observed events
Figure 10. The accumulated sigma (ACS) distribution for (a) 90 degree and (b) 10 degree,
which is the angle between incident gamma and the PMT surface. There is peak around 4.4 of ACS and those events actually have inconsistent pulse shape at rise timing with the template of scintillation.
peak around 4.4 on the ACS. Looking at event by event, those events have actually inconsistent pulse shape at the rise timing with the template of scintillation.
If we assume that the event which has greater value than 3.0 for ACS possibly include Cherenkov light at the rise timing, then the event rate included Cherenkov light is 4.6 events per day for 90 degree and 0.7 events per day for 10 degree, respectively. The significance of those difference is almost 6 sigma. Same situation was also observed in case of Anisole. There were 5 events for 90 degree and 1 event for 10 degree within 7days measurement.
Therefore, Cherenkov light emitted by 1 MeV electron seems to have a directionality even though such a low energy electron should be multiply scattered. However, the event rate of only scintillation received in Zr loaded liquid scintillator looks also have a directionality as shown in Fig.10. We will have to check this using more data and detailed analysis in order to confirm the results.
4. Conclusion
A conceptual design for ZICOS experiment with 180 tons of liquid scintillator loaded 10 wt.%
Zr(iprac)4 which correspond to 78 kg (45 kg in fiducial volume) for 96Zr was presented. The
energy resolution will be obtained by 2.6 % at 3.35 MeV assuming 64 % photo coverage using 20
inch PMT. We estimated the sensitivity of ZICOS experiment. If we can reduce 95 % of 208
Tl
backgrounds, then we can realizeT10/ν2≥2×10
26
years, and if we succeed to enrich96
Zr above
50 %, then we will achieve T0ν
1/2 ≥10 27
years.
We tried to demonstrate the method for 208
Tl background reduction using Cherenkov hit pattern, and got 93 % reduction with 78 % signal efficiency. For the discrimination of Cherenkov light, we measured a timing pulse shape using FADC digitizer, and found the difference at the rise timing. The pulse shape discrimination (PSD) using the accumulated sigma was also demonstrated. To confirm observed directionality, we need more statistics and detailed analysis.
Acknowledgments
This work was supported by a Grant-in-Aid for Scientific Research on Innovative Areas (No.24104501 and No.26105502) from the Ministry of Education, Culture, Sports, Science and Technology (MEXT), a Grant-in-Aid for Scientific Research (C) (No.24540295) from the Japanese Society for the Promotion of Science (JSPS), and the Foundation for High Energy Accelerator Science. We would like to thank Dr. K.Hiraide for giving us sample programs to read data from CAEN V1721 digitizer.
References
[1] Y.Fukuda, S.Moriyama and I.Ogawa, Nuclear Instruments and Methods A732(2013) 397. [2] Y.Fukuda, Journal of Physics: Conference Series718(2016) 062019.
[3] A.Gandoet al.(KamLAND-Zen collaboration), Physical Review Letters117(2016) 082503.
[4] Y.Fukuda and S.Moriyama, Bulletin of Information Processing Center of Miyagi University of Education, COMMUE24(2017) 19. (Japanese only)
[5] J.Caravacaet al., Physical Review C95(2017) 055801.