2014 A WEALTH OF INFORMATION
ON GLOBAL PUBLIC HEALTH
© World Health Organization 2014
All rights reserved. Publications of the World Health Organization are available on the WHO web site (www.who.int) or can be purchased from WHO Press, World Health Organization, 20 Avenue Appia, 1211 Geneva 27, Switzerland (tel.: +41 22 791 3264; fax: +41 22 791 4857; e-mail: [email protected]).
Requests for permission to reproduce or translate WHO publications – whether for sale or for non- commercial distribution – should be addressed to WHO Press through the WHO web site (http:// www.who.int/about/licensing/copyright_form/en/index.html).
The designations employed and the presentation of the material in this publication do not imply the expression of any opinion whatsoever on the part of the World Health Organization concerning the legal status of any country, territory, city or area or of its authorities, or concerning the delimi- tation of its frontiers or boundaries. Dotted lines on maps represent approximate border lines for which there may not yet be full agreement.
The mention of speciic companies or of certain manufacturers’ products does not imply that they are endorsed or recommended by the World Health Organization in preference to others of a similar nature that are not mentioned. Errors and omissions excepted, the names of proprietary products are distinguished by initial capital letters.
All reasonable precautions have been taken by the World Health Organization to verify the infor- mation contained in this publication. However, the published material is being distributed without warranty of any kind, either expressed or implied. The responsibility for the interpretation and use of the material lies with the reader. In no event shall the World Health Organization be liable for damages arising from its use.
Design by designisgood.info
Printed by the WHO Document Production Services, Geneva, Switzerland. WHO/HIS/HSI/14.1
A SNAPSHOT OF GLOBAL HEALTH
, Between 2000 and 2012, measles deaths worldwide have been cut by almost 80% – from 562 000 to 122 000 deaths. , Human African trypanosomiasis (commonly known as
sleeping sickness) is at its lowest level in 50 years, with fewer than 10 000 cases of infection reported in 2009.
, The risk of a child dying before their fifth birthday is 8 times higher in the WHO African Region than a child in the WHO European Region.
, Nearly 800 women die every day due to complications in pregnancy and childbirth.
, More than 2.5 billion people worldwide are estimated to be at risk of dengue infection.
, In the WHO Western Pacific Region, almost one in two adult men smoke tobacco.
, In 2012, more than 140 000 people in high-income countries had pertussis (whooping cough), a serious disease in infants that is preventable by vaccination.
, High-income countries have an average of almost 90 nurses and midwives for every 10 000 people while some low-income countries have fewer than 2 per 10 000 people.
The World Health Statistics is the definitive source of information on the health of the world’s people.
Published every year since 2005 by the World Health Organization (WHO), this publication contains a wealth of information on global public health from 194 countries.
Where does
this information
come from?
WHO relies on many sources to compile the World Health Statistics. These include government birth and death registration systems, hospital records, household surveys, censuses, certiied expenditure records and data obtained from research projects.
WHO makes every effort to make the best possible use of data reported by countries but many countries do not have strong health information systems so the data is not always available and varies in quality. Sometimes we have to adjust this information to deal with missing values, to correct for known biases, and to help make comparisons between countries and over time. We also use statistical modelling to help ill gaps in data.
Demographic and socioeconomic statistics come from databases managed by other organizations in the United Nations family and beyond, including the International Telecommunication Union, United Nations Department of Economic and Social Affairs, United Nations Children’s Fund and the World Bank.
Figure 1. Years gained in life expectancy 1990–2012, by sex and country income group
10
8
6
4
2
0
Gains in life expectancy (years)
Male Female
Lower-middle-income countries 6.1
7.5
Upper-middle-income countries 6.0
5.7
High-income countries 4.8
3.7
Low-income countries 9.0 9.1
We are all living longer
The world has witnessed major gains in life expectancy in recent decades. A baby girl born in 2012 can expect to live an average of 72.7 years, and a baby boy to 68.1 years. This is 6 years longer than the average global life expectancy for a child born in 1990.
Low-income countries have made the most significant progress, with an increase of 9 years of average life expectancy between 1990 and 2012 – from 51.2 to 60.2 years for men and 54.0 to 63.1 years for women. This has been achieved despite the ongoing HIV pandemic affecting many low-income countries in sub-Saharan Africa. An important contributor to increasing life expectancy in low-income countries has been progress in reducing child deaths, as well as reductions in deaths from infectious diseases in adults.
The top six countries that made the greatest progress in extending life expectancy were Liberia (by 19.7 years) followed by Ethiopia, Maldives, Cambodia, Timor-Leste and Rwanda.
Among high-income countries, the average gain in life expectancy was 5.1 years, ranging from 0.2 years in the Russian Federation to 9.2 years in the Republic of Korea.
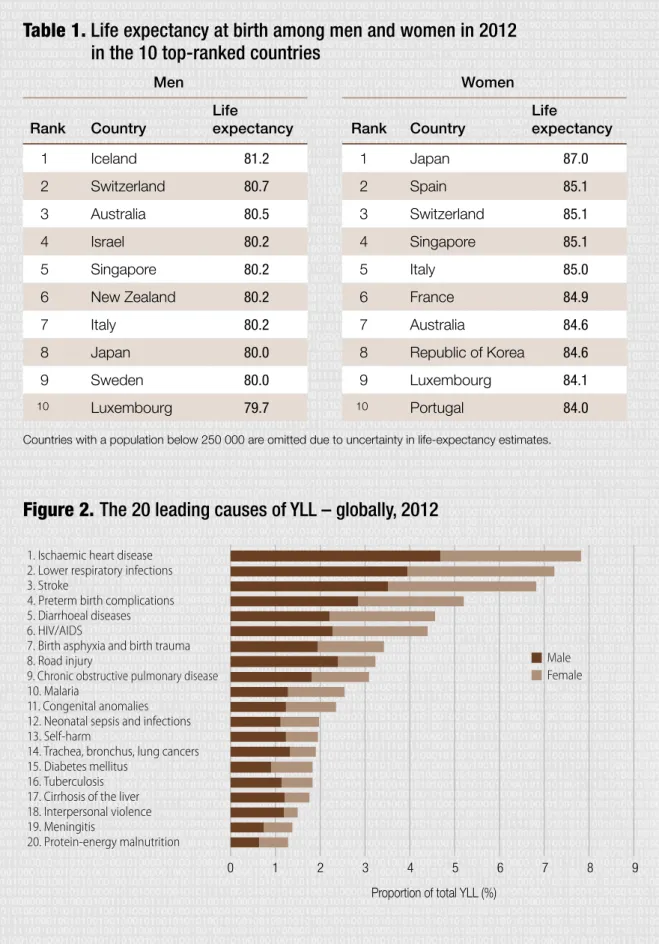
Table 1. Life expectancy at birth among men and women in 2012 in the 10 top-ranked countries
Men Women
Rank Country
Life
expectancy Rank Country
Life
expectancy
1 Iceland 81.2 1 Japan 87.0
2 Switzerland 80.7 2 Spain 85.1
3 Australia 80.5 3 Switzerland 85.1
4 Israel 80.2 4 Singapore 85.1
5 Singapore 80.2 5 Italy 85.0
6 New Zealand 80.2 6 France 84.9
7 Italy 80.2 7 Australia 84.6
8 Japan 80.0 8 Republic of Korea 84.6
9 Sweden 80.0 9 Luxembourg 84.1
10 Luxembourg 79.7 10 Portugal 84.0
Countries with a population below 250 000 are omitted due to uncertainty in life-expectancy estimates.
Figure 2. The 20 leading causes of YLL – globally, 2012
1. Ischaemic heart disease 2. Lower respiratory infections 3. Stroke
4. Preterm birth complications 5. Diarrhoeal diseases 6. HIV/AIDS
7. Birth asphyxia and birth trauma 8. Road injury
9. Chronic obstructive pulmonary disease 10. Malaria
11. Congenital anomalies 12. Neonatal sepsis and infections 13. Self-harm
14. Trachea, bronchus, lung cancers 15. Diabetes mellitus
16. Tuberculosis 17. Cirrhosis of the liver 18. Interpersonal violence 19. Meningitis
20. Protein-energy malnutrition
Proportion of total YLL (%)
Male Female
1 2 3 4 5 6 7 8 9
0
But how long depends on where
you are born…
A boy born in 2012 in a high-income country can expect to live to 75.8 years – more than 15 years longer than a boy born in a low-income country (60.2 years). For girls, the difference is even more marked; a gap of 18.9 years separates life expectancy in high-income (82.0 years) and low- income countries (63.1 years).
Life expectancy among men is 80 years or more in 9 countries, with the highest in Australia, Iceland and Switzerland. Among women, all countries in the top 10 have life expectancies of 84 years or longer. Women in Japan have the highest life expectancy in the world at 87.0 years, followed by Spain, Switzerland and Singapore.
At the other end of the scale, there are 9 countries (all in sub-Saharan Africa) where the average life expectancy for both men and women is still less than 55 years.
…which also determines what you
are likely to die from
The top three causes of premature death are coronary (ischaemic) heart disease, lower respiratory infections (such as pneumonia) and stroke. Years of life lost are a good measure of premature death, calculated from the number of deaths at each age, multiplied by the global standard for the years of life considered lost for a death at each age.
Half of the top 20 causes are infectious diseases, and maternal, neonatal and nutritional causes, while the other half are due to noncommunicable diseases (NCDs) or injuries.
In the past decade, however, almost every country in the world experienced a major shift away from premature deaths due to infectious diseases and towards NCDs and injuries.
Countries are at very different stages of this epidemiological transition. On average, in the WHO African Region, 70% of all years of life lost are due to infectious diseases and maternal, neonatal and nutritional causes. In high- income countries, these causes now account for only 8% of all years of life lost.
Our children are getting fatter
In 2012, around 44 million (6.7%) of the world’s children aged less than 5 years were overweight or obese.
This number and proportion has increased from around 31 million (5%) in 1990. In the WHO African region alone the number of overweight children increased from 4 to 10 million over the same period.
At the 2012 World Health Assembly, countries agreed to work towards halting any further increases in the proportion of overweight children, one of the six global nutrition targets aimed at improving maternal, infant and young child nutrition by 2025.
Obesity in childhood is associated with a wide range of serious health complications and an increased risk of premature illness. Exclusive breastfeeding from birth to 6 months of age is one way to help prevent early child overweight.
Figure 3. Children aged < 5 years overweight (%), latest available year, 2006–2012
Countries shown without available data may have survey estimates prior to 2006 or use national reference data instead of WHO standards.
Percentage (%)
< 5.0 5.0–9.9 10.0–14.9
≥ 15.0
Data not available Not applicable
Focus needed to save more
newborns
Between 2000 and 2012, child survival improved significantly. The under- five mortality rate fell from 75 to 48 deaths per 1000 live births. Still, around 6.6 million children died in 2012.
The first 28 days of life are the most dangerous period, during which 44% of all deaths of children aged less than five occur. Some progress has been made in reducing deaths from birth asphyxia and birth trauma (intrapartum-related complications) (-29%) and complications due to prematurity (-14%). However, much more attention is needed to increase access to life-saving interventions to save more newborns.
More progress was made in saving children after the first month of life. For example, child deaths declined due to measles (-80%), HIV/AIDS (-51%), diarrhoea (-50%), pneumonia (-40%), and malaria (-37%).
Globally, preterm-birth complications were the leading cause of under-five deaths in 2012 (17.3% of deaths), followed by pneumonia (15.2%), birth asphyxia and birth trauma (11.4%), noncommunicable diseases (10.8%) and diarrhoea (9.5%).
Figure 4. Changes in major causes of under-five deaths – globally, 2000-2012
1 500 000 1 000 000
500 000 0
Diarrhoea (–50%) Measles (–80%)
Malaria (–37%) Pneumonia (–40%)
Other infectious, perinatal and nutrutional (–30%)
Intrapartum-related complications (–29%) HIV/AIDS (–51%)
Injuries (–22%)
Preterm birth complications (–14%)
Noncommunicable diseases (–11%)
Number of deaths
2000 2012 Neonatal Postneonatal
Figure 5. Trends in cause-of-death data reporting, by country income group
Number of countries
1950 1953 1956 1959 1962 1965 1968 1971 1974 1977 1980 1983 1986 1989 1992 1995 1998 2001 2004 2007 2010 2012 806040200100
ICD-8 ICD-9 ICD-10
Global development starts
with reliable data
Complete information from a civil registration and vital statistics system – that is, the registering of all births and all deaths and the recording of causes of death – represents one of the most valuable assets a country can have.
Reliable information on numbers of births and deaths, and causes of death, is essential in guiding national, regional and global health priorities.
Currently only one third of all deaths worldwide are recorded in civil registries along with cause-of-death information using the International Classification of Diseases (ICD).
Around half of 194 countries regularly report this information and these are mostly high-income countries.
The ICD is updated and revised to reflect the latest knowledge available on major diseases and health conditions. WHO is currently developing the 11th revision of the ICD.
Low-income countries Lower-middle-income countries Upper-middle-income countries High-income countries
Because of typically observed lag of 18-24 months before countries report finalized latest data, it should not be inferred from this chart that reporting for the most recent years has decreased.