Directed Inspection and Maintenance Leak Survey at a
Gas Fractionation Plant Using Traditional Methods and
Optical Gas Imaging
Paper Number: 06-A-119-AWMA
Prepared by Dave Picard
Clearstone Engineering Ltd., 700, 900-6 Avenue S.W., Calgary, Alberta, T2P 3K2
Jeff Panek
Innovative Environmental Solutions Inc., P.O. Box 177, Cary, IL 60013-0177
Presented by Dave Fashimpaur
BP, Refining Technology, 150 W. Warrenville Rd., Naperville, IL 60563
ABSTRACT
A fugitive emissions measurement program was conducted at a Gas Fractionation Plant. The purpose of this work was to 1) quantify methane, total hydrocarbon (THC) and greenhouse gas (GHG) emissions, 2) identify and evaluate potential cost-effective emissions reducing opportunities. A tertiary objective of the survey was to qualitatively compare the performance of optical gas imaging with traditional leak detection methods.
The plant is a large natural gas liquids (NGL) fractionation, storage and shipping facility. Total annual emissions were determined from the compiled measurement results and process data. Specific emission-control opportunities were identified and a cost-benefit analysis was performed. The analysis takes into account the estimated cost and life of repairs and the value of the conserved gas.
The measurement program comprised a fugitive emissions survey of all equipment components in natural gas, NGL, ethane, propane, butane, iso-butane, normal butane and condensate service. A total of approximately 77,800 individual equipment components were surveyed for leaks using a combination of traditional screening techniques and the optical gas imaging camera.
The majority of losses from fugitive equipment leaks are attributed to a relatively small number of equipment components. Only 423 (or 0.5 percent) of the components surveyed were determined to be leaking, and of these, 320 were determined to be cost-effective to repair. Implementing all cost-effective repairs would reduce hydrocarbon emissions by an estimated 465.0 x 10³ m3/y and GHG emissions by 826.5 tonnes CO2E per year. Annual savings of Can. $383,500 could be achieved through avoided product losses.
INTRODUCTION
This report presents the details and results of a targeted emission survey conducted at a Canadian Gas Fractionation Plant during the period of October 18 to 22, 2004. The main objectives of the survey were to identify and measure hydrocarbon emissions resulting fugitive equipment leaks, and to highlight potentially cost-effective opportunities to reduce these emissions. A tertiary objective of the survey was to compare the overall performance of the Hawk passive IR camera optical leak detection method to conventional leak detection methods. Based on the data collected during the survey, an assessment of fugitive emissions and comparison of the detection methods is provided.
An overview is presented of the developed emissions inventory including total hydrocarbons (THC), methane and greenhouse gases (GHG). The results are based on conditions observed at the time of the site visit and are summarized by process area and component type. Site-specific average emission factors developed based on the measured emission data are also presented. A comparison of these factors with corresponding values published by U.S. EPA for gas facilities (1996) and for refineries (1995) and by CAPP for upstream gas facilities (1999) is provided.
Qualitative comparisons of traditional leak detection techniques to optical gas imaging are made. The Leak Survey Inc. (LSI) Hawk passive IR camera was used in this survey.
Facility Description
The Gas Fractionation Plant is a large natural gas liquids fractionation, storage and shipping facility producing propane, isobutane, normal butane, condensate and a mixed ethane/propane product. The facility receives feedstock from local refineries, gas and chemical plants; however, the majority of the NGL feedstock is received by pipeline from Enbridge and Shell. Fractionated products are distributed to customers by pipeline, rail tanker cars and tank truck. The current processing capacity of the facility is in excess of 22,000 m3/day.
two rail racks and four tank truck lading racks, each capable of loading propane, isobutane and normal butane
METHODOLOGY
This section describes the methodology used by the study team to identify and evaluate cost-effective emission-reduction opportunities at upstream oil and gas facilities.
Emissions Survey
The main elements of the site survey included the following:
• screening of equipment components to detect leaks,
• measurement of emission rates from identified leaking equipment components
• measurement of emissions from continuous vents and residual flows from emergency vents during passive periods,
• developing counts of the surveyed equipment components,
• development of the emissions inventory,
• determination of site-specific average emission factors
• cost-benefit analysis of the identified control opportunities.
Component Screening
Equipment components on all process-, fuel- and waste-gas systems were screened for leaks. The types of components surveyed included flanged and threaded connections (i.e., connectors), valves, pressure-relief devices, open-ended lines, blowdown vents (i.e., during passive periods), instrument fittings, regulator and actuator diaphragms, compressor seals, engine and compressor crankcase vents, sump, drain tank vents and tank hatch seals.
Components in heavy-liquid service generally were not screened since they do not contribute significantly to total hydrocarbon losses at oil and gas facilities due to their low average leak rates (US EPA, 1995) and relative numbers. Traditional leak detection (or screening) was done using bubble tests with soap solution, portable hydrocarbon gas detectors (Bascom-Turner Gas Sentry CGI-201 and CGI-211 and a GMI Gas Surveyor3) and an ultrasonic leak detector (SDT International, SDT-120).
Figure 1. Bubble test on leaking valve
Ultrasonic detectors are effective for leak detection in areas with low background noise levels in the ultrasonic range. In all cases a screening value of 10,000 ppm or greater was used as the leak definition. If a component was determined to be emitting by one of the alternative techniques (i.e., bubble tests or the ultrasonic leak detector), it was then screened using the hydrocarbon vapor analyzer to determine if the component satisfied this leak definition.
All identified leaking components were tagged, and the specific source of leakage and date were noted on each tag. The emissions rate from all leakers in hydrocarbon service were then determined. All leaker tags were left in place after the leak rate was measured to allow for follow-up action by facility personnel.
The following basic information was recorded for each leaking component:
• component type • process unit
• model or style of component • process stream
• service • pressure
• size • temperature
Leak-Rate Measurements
The HiFlow Sampler, see Figure 2, was the primary method used to measure emission rates from leaking equipment components.
Specific cases where the HiFlow Sampler was not used include any components leaking at rates above the upper limit of the unit (i.e., above about 14 m3/h for the current HiFlow design) and most open-ended lines and vents. Either bagging or direct measurement techniques, as appropriate, were used in these cases. The following is a brief description of the HiFlow Sampler developed by GTI.
The operating principle of the HiFlow Sampler is simple – a variable-rate induced-flow sampling system for total capture of the emissions from a leaking component. The HiFlow Sampler determines the mass rate of emissions by measuring THC concentration and flow rate. The reliability and use of the HiFlow Sampler has been demonstrated in a number of studies (Howard et al., 1994; Lott et al., 1995).
Leak Statistics
The component count identified a total of 77,800 equipment components in pressurized gas/vapour service, in both process gas and fuel gas service. Table 1 presents a summary of the number of components encountered, and the fraction within each component category that were leaking.
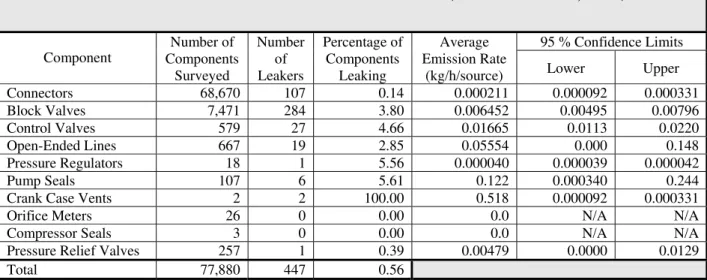
Table 1 Fraction of leaking components and average component emission rates for data collected at the Gas Fractionation Plant (October 18 to 22, 2004).
95 % Confidence Limits Component
Number of Components
Surveyed
Number of Leakers
Percentage of Components
Leaking
Average Emission Rate
(kg/h/source) Lower Upper
Connectors 68,670 107 0.14 0.000211 0.000092 0.000331
Block Valves 7,471 284 3.80 0.006452 0.00495 0.00796
Control Valves 579 27 4.66 0.01665 0.0113 0.0220
Open-Ended Lines 667 19 2.85 0.05554 0.000 0.148
Pressure Regulators 18 1 5.56 0.000040 0.000039 0.000042
Pump Seals 107 6 5.61 0.122 0.000340 0.244
Crank Case Vents 2 2 100.00 0.518 0.000092 0.000331
Orifice Meters 26 0 0.00 0.0 N/A N/A
Compressor Seals 3 0 0.00 0.0 N/A N/A
Pressure Relief Valves 257 1 0.39 0.00479 0.0000 0.0129
Total 77,880 447 0.56
While there are currently no guidelines regarding the allowable percentage of leaking components at gas processing facilities, such regulations do exist for VOC emissions from chemical plants and refineries (CCME, 1993). These regulations stipulate that fugitive equipment leaks are considered well controlled when the percentage of leaking components for each component type (except compressor and pump seals) is two percent or less. For compressor and pump seals, the allowable percentage of leaking components is ten percent or less.
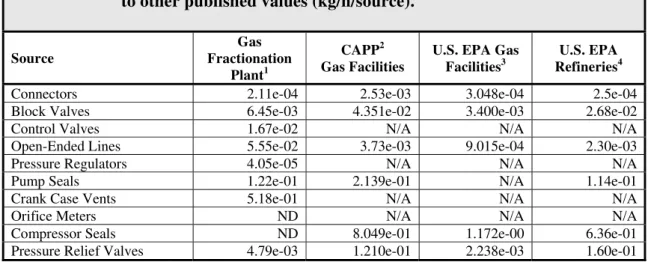
Table 2 Comparison of average emission factors derived from collected data to other published values (kg/h/source).
Source
Gas Fractionation
Plant1
CAPP2 Gas Facilities
U.S. EPA Gas
Facilities3 RefineriesU.S. EPA 4
Connectors 2.11e-04 2.53e-03 3.048e-04 2.5e-04
Block Valves 6.45e-03 4.351e-02 3.400e-03 2.68e-02
Control Valves 1.67e-02 N/A N/A N/A
Open-Ended Lines 5.55e-02 3.73e-03 9.015e-04 2.30e-03
Pressure Regulators 4.05e-05 N/A N/A N/A
Pump Seals 1.22e-01 2.139e-01 N/A 1.14e-01
Crank Case Vents 5.18e-01 N/A N/A N/A
Orifice Meters ND N/A N/A N/A
Compressor Seals ND 8.049e-01 1.172e-00 6.36e-01
Pressure Relief Valves 4.79e-03 1.210e-01 2.238e-03 1.60e-01
N/A Average emission factor for this source type is not available.
ND Leaks for this type of component not detected at the Gas Fractionation Facility. 1 Based on data collected at the Gas Fractionation Plant October 18 to 22, 2004.
2 Source: Canadian Association of Petroleum Producers. 1999. A Detailed Inventory of CH4 and
VOC Emissions from Upstream Oil and Gas Operations in Canada. Volume 2: Development of the Upstream Emissions Inventory. Calgary, AB.
3 Source: U.S. EPA and GRI. 1996. Methane Emissions from the Natural Gas Industry. Volume 8: Equipment Leaks. Research Triangle Park, NC 27711
4 Source: U.S. EPA and GRI. 1995. Protocol for Equipment Leak Emission Estimates. Table 2-2: Refinery Average Emission Factors, pg. 2-13.
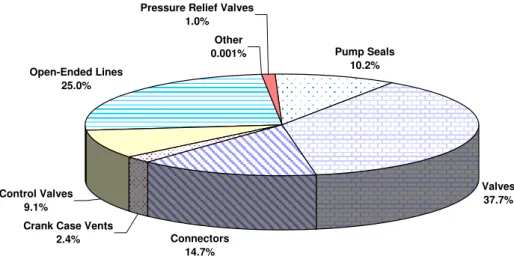
Open-Ended Lines 25.0%
Other
0.001% Pump Seals
10.2%
Control Valves 9.1%
Connectors 14.7%
Valves 37.7% Pressure Relief Valves
1.0%
Crank Case Vents 2.4%
Figure 3 Relative distribution, on a volumetric basis, of total hydrocarbon (THC) emissions from leaking equipment components at the Gas Fractionation Plant.
EMISSION REDUCTION OPPORTUNITIES
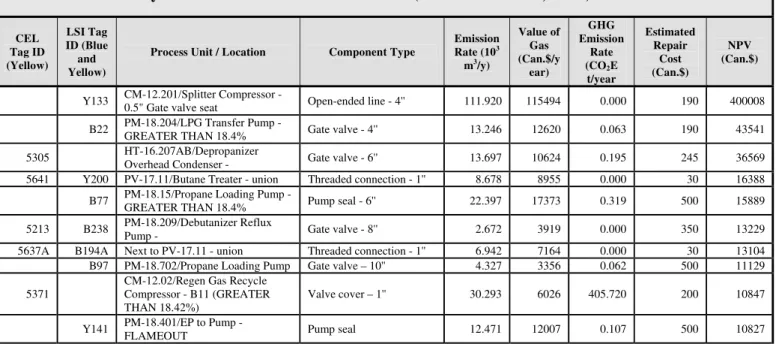
Total gas losses from identified leaking equipment components at the site (i.e., components having a screening value of 10,000 ppm of greater) amounted to 470.8 x 10³ m3/y worth an estimated Can. $386,465 annually. This was contributed by 423 components; 320 of these are estimated to be economical to repair. The top 10 economic repairs are summarized in Table 3. As is typically the case, the majority of losses from fugitive equipment leaks are attributed to a relatively small number of components. The 320 components that were estimated to be economic to repair represent 0.4 percent of the components in hydrocarbon service, yet account for approximately 73.7 percent of fugitive total hydrocarbon emissions (emissions from equipment components with both detectable and non-detectable leakage).
Table 3 Summary of emissions from top 10 economic-to-repair leaking equipment components surveyed at the Gas Fractionation Plant (October 18 to 22, 2004).
CEL Tag ID (Yellow)
LSI Tag ID (Blue and Yellow)
Process Unit / Location Component Type
Emission Rate (103
m3/y)
Value of Gas (Can.$/y
ear)
GHG Emission
Rate (CO2E t/year
Estimated Repair
Cost (Can.$)
NPV (Can.$)
Y133 CM-12.201/Splitter Compressor - 0.5" Gate valve seat Open-ended line - 4'' 111.920 115494 0.000 190 400008
B22 PM-18.204/LPG Transfer Pump -
GREATER THAN 18.4% Gate valve - 4'' 13.246 12620 0.063 190 43541
5305 HT-16.207AB/Depropanizer
Overhead Condenser - Gate valve - 6'' 13.697 10624 0.195 245 36569 5641 Y200 PV-17.11/Butane Treater - union Threaded connection - 1'' 8.678 8955 0.000 30 16388
B77 PM-18.15/Propane Loading Pump -
GREATER THAN 18.4% Pump seal - 6'' 22.397 17373 0.319 500 15889
5213 B238 PM-18.209/Debutanizer Reflux
Pump - Gate valve - 8'' 2.672 3919 0.000 350 13229
5637A B194A Next to PV-17.11 - union Threaded connection - 1'' 6.942 7164 0.000 30 13104 B97 PM-18.702/Propane Loading Pump Gate valve – 10'' 4.327 3356 0.062 500 11129
5371
CM-12.02/Regen Gas Recycle Compressor - B11 (GREATER THAN 18.42%)
Valve cover – 1'' 30.293 6026 405.720 200 10847
Y141 PM-18.401/EP to Pump - FLAMEOUT Pump seal 12.471 12007 0.107 500 10827
LEAK DETECTION METHODOLOGY COMPARISON
Conventional leak detection techniques, including bubble tests, handheld organic vapour analysers and acoustic ultrasonic leak detection equipment, have traditionally been used to screen equipment components for leaks in accordance with Method 21 (US EPA, 1997). The traditional leak detection techniques are tedious and time consuming. Recently, optical gas imaging technology, such as the LSI Hawk camera, has been developed in an effort to improve the efficiency of the leak detection process. Optical IR cameras have performed well during numerous field trials. Optical gas imaging technology has the ability to screen difficult to monitor components more easily than traditional screening techniques. Both techniques are dependent on operator experience and diligence for a valid and complete leak screening assessment.
Table 4 Qualitative comparison of traditional leak detection techniques and the optical infrared LSI Hawk camera technology.
Parameter Conventional Leak Detection
Techniques
Optical Infrared LSI Hawk Camera
Speed Screening speed:
Typically 1,200 components/person/day For a two person team:
2,400 components/day or 240 components/hour. Screening technicians that are not familiar with the process and appropriately trained may needlessly screen non-target
components (e.g., electrical conduit and components in water service).
Screening speed:
For a two person team: 23,000 components/day or 2,300 components/hour. However, greater time is required to tag the identified leakers since the camera operator must communicate the leak location to his/her assistant. Similar potential for needlessly screening non-target components.
Mobility Size: Gas detectors and spray bottles are
small and light-weight and allow the operator to be very mobile in all areas.
Difficult to access components:
Depending on component, ladders or other access points must be found. Extension poles may be used to screen roofline vents and other elevated sources.
Size: Size and weight make the camera difficult to manoeuvre in elevated areas. Operating in congested areas is not practical. Size and weight have been reduced in the Flir GasFindIR camera.
Difficult to access components:
Using the camera elevated components and other difficult access locations can be screened from the ground or at a distance.
Cost Conventional Screening Equipment:
$5,000 - $10,000 (USD)
Charge for experienced two person contract team: $1,200 per day (USD) plus expenses. Cost would be much less if the work is performed by summer students.
Camera: commercially-available FLIR GasFindIR camera now $75,000 (USD), ~$93,000 with additional lenses
Change for experienced two person contract team: $3,000 per day (USD) plus expenses
Potential Application for Routine LDAR Screening
Traditional techniques are simple to learn and require limited expertise. Suitable for use by summer students as part of a seasonal LDAR survey.
Use of the camera requires individuals with specific training. The new Flir GasFindIR camera has automatic contrast control and is easier to use the HAWK camera but still requires training and experience.
Weather Operators are limited by very inclement
weather and cold (less than -15°C). Screening equipment is not affected by poor weather other than extreme cold.
Parameter Conventional Leak Detection Techniques
Optical Infrared LSI Hawk Camera
Leak
Identification
Application of Leak Definition:
An objective leak definition (i.e., US EPA definition of 1 percent hydrocarbon concentration in vicinity of leaker) can be applied using gas detectors.
Leak Isolation: It is sometimes difficult to identify a leaking component where there are high background readings due to interference from other nearby leaking sources and in congested areas.
Unconventional Leakers: Traditional
techniques focus in on expected sources and locations (e.g., seal vents, mechanical connections, covers, etc). Leakage at other points on a component or on piping (e.g., due to corrosion and mechanical damage) may not be identified.
Missed Sources: The reliability of the
method is highly dependent on the care and attention used by the screening technician.
Application of Leak Definition:
The camera operator is able to qualitatively assess the size of each leaker (i.e., small, medium, large), but the technology currently does not apply an objective leak definition.
Leak Isolation: Camera can more
clearly ‘see’ a source of leakage in close proximity of other leaking and non-leaking components.
Unconventional Leakers: The
camera is more apt to pick up leaking equipment components in unconventional places since a wide field of view is used.
Missed Sources: Less sensitive to,
but still dependent on, the level of care and attention applied by the screening technician.
Safety Intrinsic Safety: All traditional
screening equipment is rated intrinsically safe.
Slips, trips and falls: Traditional leak detection techniques require the screening technician to be in close contact with the process equipment which poses a risk of slips, trips and falls. Other injuries resulting from burns and pinched fingers more likely.
Exposure to Vapours: Operators must
be in close proximity to equipment components in order to identify leakers, therefore, there is a greater chance of operator exposure to hazardous compounds in the gas (e.g., H2S and benzene).
Intrinsic Safety: HAWK camera
not intrinsically safe, hot work permit required. Flir camera designed to meet NEC Class 1 Div. 2 criteria.
Slips, trips and falls: The size and weight of the camera, coupled with the operator’s restricted view when using the camera may contribute to slips, trips and falls. Furthermore, once leaks are detected, the operator must still get in amongst the
equipment to install leaker tags.
Exposure to Vapours: Risk
Parameter Conventional Leak Detection Techniques
Optical Infrared LSI Hawk Camera
Ancillary Benefits
Air Leaks: Leaks of instrument air,
nitrogen and other non-hydrocarbon gases may be detected.
Quantify Emissions: Emission
quantification from identified leakers is typically provided as part of the leak detection program.
Identification of Operational Issues:
Given the close scrutiny that equipment receives during the
application of traditional leak detection techniques, other concerns or problems can be identified. For instance, internal leakage into a flare header can be identified by noting frosted valves.
Air Leaks: The cameras are
designed to only see hydrocarbon leaks.
Quantify Emissions: Camera crews
to date do not offer the service of quantifying emissions from leaking equipment components. LSI may be offering quantification in the near future.
Identification of Operational
Issues: The IR camera is capable of
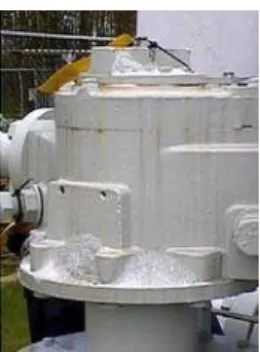
seeing any number of items in the IR range. For instance, the camera is capable of visualizing the solids level in tanks.
CONCLUSIONS
1. The emissions survey has provided: an assessment of total hydrocarbon, methane and greenhouse gas emissions at the facility; average site-specific emission factors for future estimation of emissions from fugitive equipment leaks; an estimate of the emissions from rail car spit tubes during filling; and, a ranked listing of identified leak control opportunities.
2. Emissions from leaking equipment components were generally well-controlled and this is attributed to a good maintenance program. Few large leakers were identified, and less than 0.6 percent of all equipment components in gas service were determined to be leaking. Typically, fugitive equipment leaks are considered to be adequately controlled when a leak frequency of less than 2 percent is achieved. The average emission factors derived from the site-specific data generally compare favorably to corresponding factors for the upstream oil and gas industry in Canada and US EPA published factors for gas facilities and refineries.
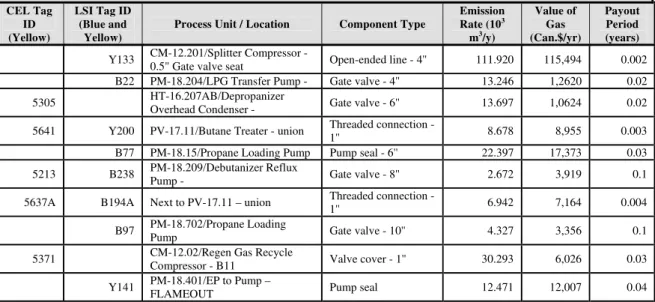
3. 320 cost-effective emission control opportunities were identified. This represents a potential reduction in fugitive THC emissions of 465.0 x 10³ m3 per year (83 percent of THC emissions from fugitive equipment leaks) and a potential savings of up to Can.$383,500 per annum in avoided product loss. The top ten cost-effective to repair emitters are listed in order of decreasing magnitude in Table 5.
that were not found by the optical gas imaging camera were large enough to be detected by the camera but were missed by the camera operator.
Table 5 Summary of 10 largest cost-effective emission reduction opportunities.
CEL Tag ID (Yellow)
LSI Tag ID (Blue and
Yellow)
Process Unit / Location Component Type
Emission Rate (103 m3/y)
Value of Gas (Can.$/yr)
Payout Period (years)
Y133 CM-12.201/Splitter Compressor -
0.5" Gate valve seat Open-ended line - 4'' 111.920 115,494 0.002 B22 PM-18.204/LPG Transfer Pump - Gate valve - 4'' 13.246 1,2620 0.02
5305 HT-16.207AB/Depropanizer
Overhead Condenser - Gate valve - 6'' 13.697 1,0624 0.02
5641 Y200 PV-17.11/Butane Treater - union Threaded connection -
1'' 8.678 8,955 0.003
B77 PM-18.15/Propane Loading Pump Pump seal - 6'' 22.397 17,373 0.03
5213 B238 PM-18.209/Debutanizer Reflux Pump - Gate valve - 8'' 2.672 3,919 0.1
5637A B194A Next to PV-17.11 – union Threaded connection -
1'' 6.942 7,164 0.004
B97 PM-18.702/Propane Loading
Pump Gate valve - 10'' 4.327 3,356 0.1
5371 CM-12.02/Regen Gas Recycle
Compressor - B11 Valve cover - 1'' 30.293 6,026 0.03
Y141 PM-18.401/EP to Pump – FLAMEOUT Pump seal 12.471 12,007 0.04
REFERENCES CITED
CAPP. 1999. A Detailed Inventory of CH4 and VOC Emissions from Upstream Oil and Gas Operations in Canada. Volume II: Development of the Upstream Emissions
Inventory. Prep. by Clearstone Engineering Ltd. Calgary, AB. CAPP Pub. #1999-0010.
CCME (Canadian Council of Ministers of the Environment). 1993. Environmental Code of Practice for the Measurement and Control of Fugitive VOC Emissions from
Equipment Leaks. Winnipeg, MB. CCME Pub. No. CCME-EPC-73E.
Howard, T., R. Siverson, A. Wenzlick and B. Lott. 1994. A High Flow Rate Sampling System for Measuring Emissions from Leaking Process Components. Presented at the 1994 International Workshop on Environmental Impacts of Natural Gas Losses, Prague, Czech Republic.
Lott, B., T. Howard and M. Webb. 1995. New Techniques Developed for Measuring Fugitive Emissions. Pipe Line and Gas Industry, v 75, n10, October 1995.
IPCC. 1996. Climate Change 1995: The Science of Climate Change. Cambridge University Press. New York, NY. pp.572.
U.S. EPA (Environmental Protection Agency). 1982. Fugitive Emission Sources of Organic Compounds – Additional Information Emissions, Emission Reductions and Costs. Report No. EPA-450/3-82-010. Table 2-15. p.2-22.
U.S. EPA (Environmental Protection Agency). 1995a. Protocol for Equipment Leak Emission Estimates. Available through NTIA. Springfield VA. Publication No. EPA-453/R-95-017. Section 2.
U.S. EPA (Environmental Protection Agency). 1995b. Compilation of Air Pollutant Emission Factors. Volume I: Stationary Point and Area Sources. Available through NTIA. Springfield VA. Publication No. PB95-196028. Fifth Edition and Supplements.
U.S. EPA (Environmental Protection Agency) and GRI. 1996. Methane Emissions from the Natural Gas Industry. Volume 8: Equipment Leaks. Available through NTIA. Springfield VA. Publication No. EPA-600/R-96-080h.
U.S. EPA (Environmental Protection Agency). 1997. Method 21 – Determination of Volatile Organic Compound Leaks. Available on the EPA website. (www.epa.gov/ttn/emc/promgate.html).
KEY WORDS
Carbon Dioxide Equivalent (CO2E) Connectors - Fugitive Emissions Fugitive Equipment Leaks Open-ended Valves and Lines Optical Gas Imaging
Pressure Relief Valves Pump Seals
Reciprocating Compressor Packing Systems
Standard Reference Conditions Total Hydrocarbons